Self-organization, and transitions from reversible to irreversible behaviour, of interacting particle assemblies driven by externally imposed stresses or deformation is of interest in comprehending diverse phenomena in soft matter. They have been investigated in a wide range of systems, such as colloidal suspensions, glasses, and granular matter. In different density and driving regimes, such behaviour is related to yielding of amorphous solids, jamming, and memory formation, etc. How these phenomena are related to each other has not, however, been much studied. In order to obtain a unified view of the different regimes of behaviour, and transitions between them, we investigate computationally the response of soft sphere assemblies to athermal cyclic shear deformation over a wide range of densities and amplitudes of shear deformation. Cyclic shear deformation induces transitions from reversible to irreversible behaviour in both unjammed and jammed soft sphere packings. Well above isotropic jamming density (), this transition corresponds to yielding. In the vicinity of the jamming point, up to a higher density limit we designate , an unjammed phase emerges between a localised, absorbing phase, and a diffusive, irreversible phase. The emergence of the unjammed phase signals the shifting of the jamming point to higher densities as a result of annealing, and opens a window where shear jamming becomes possible for frictionless packings. Below , two distinct localised states, termed point and loop reversibile, are observed. We characterise in detail the different regimes and transitions between them, and obtain a unified density-shear amplitude phase diagram.
Unified phase diagram of reversible-irreversible, jamming and yielding transitions in cyclically sheared soft sphere packings
I Introduction
The response of disordered assemblies of particles to externally imposed stresses or deformation is of importance in wide ranging investigations addressing transitions between rigid and flowing states of soft matter systems, and characterizing the rigid and flowing states. Questions in this regard pertain to the rheology of complex fluids, in particular, dense particulate suspensionsMason et al. 1996; Brown and Jaeger 2012; Peters et al. 2016; Mari et al. 2014; Wyart and Cates 2014, jamming in granular matterLiu and Nagel 2010; Bi et al. 2011; Ren et al. 2013; Coulais et al. 2014; Baity-Jesi et al. 2016; Behringer and Chakraborty 2018; Vinutha and Sastry 2016a; Vinutha and Sastry 2019 and the mechanical behaviour, yielding and shear banding in amorphous solids (from metallic glasses to yield stress soft materials)Falk and Langer 2011; Karmakar et al. 2010; Urbani and Zamponi 2017; Jin et al. 2018; Jaiswal et al. 2016; Leishangthem et al. 2017; Parisi et al. 2017; Divoux et al. 2016; Bonn et al. 2017; Vasisht et al. 2017; Kawasaki and Berthier 2016. Investigations on these questions inform geophysical phenomena such as earthquakes and landslides Jagla et al. 2014; Uhl et al. 2015; Jerolmack and Daniels 2019, material properties of metallic glassesSun et al. 2016; Priezjev 2019, the control of rheological response of suspensions Ness et al. 2018, origins of irreversible behaviourPine et al. 2005; Corte et al. 2008; Schreck et al. 2013; Regev et al. 2013, and memory formation in a variety of condensed matter systemsKeim et al. 2018; Royer and Chaikin 2015; Fiocco et al. 2014; Adhikari and Sastry 2018; Lavrentovich et al. 2017; Paulsen et al. 2014; Keim and Nagel 2011, to name a few examples. A number of experimental and computational investigations addressing such questions have employed the protocol of oscillatory or cyclic shear deformation, often in the athermal limit, when thermal fluctuations do not play a significant role.
At low densities, cyclically sheared colloidal suspensions (and models thereof) exhibit a continuous transition from reversible to irreversible behaviour Pine et al. 2005; Corte et al. 2008, with time scales to reach steady states apparently diverging at the transition. At high densities, dense glasses exhibit a sharp, discontinuous yielding transition Fiocco et al. 2013; Leishangthem et al. 2017; Regev et al. 2013; Priezjev 2013; Regev et al. 2015; Kawasaki and Berthier 2016, nevertheless with apparent divergence of times to reach the steady state. These two regimes also display memory effects with Keim and Nagel 2011; Paulsen et al. 2014; Fiocco et al. 2014; Adhikari and Sastry 2018 significant differences in behaviour. At intermediate densities, where jamming behaviour has been explored O’Hern et al. 2003; Chaudhuri et al. 2010; Ozawa et al. 2012, mechanical measurements reveal interesting phenomena such as softening and yielding Coulais et al. 2014; Dagois-Bohy et al. 2017, which are not fully or well characterized. Thus, depending on the density regime, one finds transitions from reversible to irreversible behaviour with varying characteristics.
Given the diversity of observed behaviours, it is of interest to comprehend the relationship between these seemingly different but related phenomena. Such a comprehensive understanding is hampered by the fact that these different regimes have been probed on physically very different experimental systems (colloidal suspensions, granular matter, molecular or atomic glasses), or different computational models and methods. It is thus desirable to interrogate all these phenomena in a single system to establish the relationship between different regimes of behaviour. In the present work, we address this goal by studying the model system of athermal soft sphere assemblies, which have been used to model, depending on the density of the packings, the behaviour of colloidal suspensions, granular matter and dense glasses. We study the behaviour of a binary (50:50) mixture of soft spheres interacting through a harmonic potential, subjected to athermal cyclic deformation of varying amplitudes ( see Appendix for details) over a density range that encompasses all these regimes. By doing so, we observe reversible to irreversible transitions at the high and low density regimes, analogous to previous studies, but our results illuminate several new aspects not previously addressed. At intermediate densities, we further observe a window in which cyclic shear deformation unjams initially jammed configurations. This window is sandwiched between a reversible regime at low amplitudes and an irreversible regime at high amplitudes. Interestingly, this unjamming window allows us to probe a phenomenon that hitherto has largely been addressed in the context of frictional granular packings, namely shear jamming. Owing to the unjamming we obtain by cyclic shear deformation, we can study shear jamming in a frictionless system. We present our findings below by considering three distinct density regimes, and finally, construct a unified phase diagram that integrates all the observed regimes and transitions among them. Related results in two dimensions are presented in Nagasawa et al. 2019.
II Reversible-irreversible and yielding transition
The soft sphere model system well above has been studied and observed to behave as a good glass former Berthier and Witten 2009a; Berthier and Witten 2009b. It has been shown previously that amorphous solids under cyclic shear deformation yield at a well defined strain at which they undergo (in the steady states reached after repeated cycles of strain, which we always focus on unless otherwise stated) a transition from a reversible state (where particles return to the same position after each cycle) to an irreversible, diffusive, state Fiocco et al. 2013; Regev et al. 2013; Leishangthem et al. 2017. Therefore we identify the yield strain at which the mean squared displacement (MSD) of particle positions measured stroboscopically changes from zero (absorbing phase, A) to finite values (diffusive or yielding phase Y) in a discontinuous fashion. The yield strain can also be identified by the non-monotonic, and discontinuous change in the steady state value of the potential energy (PE) Regev et al. 2013; Leishangthem et al. 2017; Parmar et al. 2019. In Fig. 1(a), we show the mean squared displacement (MSD) for different shear amplitudes at one high packing fraction, , above the jamming density (the minimum value of in this system is estimated to be ). For small amplitudes, the MSD is negligible and non-increasing with cycles, whereas above a strain amplitude of , it exhibits a linear increase with accumulated strain (Fig. 1(a)). The diffusion coefficients obtained from , shown in the inset of Fig. 1(a), display a discontinuous jump at , as observed in previous studies Kawasaki and Berthier 2016; Parmar et al. 2019. In Fig. 1(b), we show the steady state per particle potential energy (PE) as a function of the strain amplitude, which shows a discontinuity at , as seen previously for a binary Lennard-Jones glass Leishangthem et al. 2017; Parmar et al. 2019. We identify the steady state by monitoring PE as a function of (see Appendix section ). From these two characterizations, we identify as the yield strain value. The same behaviour is observed over a range of densities (data not shown) at roughly a constant and is consistent with the characterization of the yielding transition in previous work.
III Unjamming and shear jamming above the isotropic jamming density
We next consider the density range just above the isotropic jamming density, , estimated to be using previously employed methods O’Hern et al. 2003; Chaudhuri et al. 2010 of compressing low density configurations. As noted before, the jamming density is not unique Chaudhuri et al. 2010; Ozawa et al. 2012; Kumar and Luding 2016; Jin et al. 2018, and jammed packings just above exhibit peculiar mechanical properties O’Hern et al. 2003; Wyart et al. 2005. We thus expect interesting responses to cyclic deformation in this regime.
We observe that for a range of packing fractions close to the system unjams for an intermediate range of amplitudes, i.e., shear stress goes to zero. In Fig. 2 (a), we show the steady state value of the stroboscopic average mechanical contact number (defined in Appendix, section ), and the shear stress in Fig. 2(b), for different densities, as a function of strain amplitude. The corresponding behaviour of the geometric contact number and the non-rattler contact number () (see Appendix, section 1) is shown in the Appendix, along with the dependence of on the minimization protocol and the variation of with (Appendix, sections and ). The shear stress jumps to zero when (also , ) goes below , the isostatic value for jamming in frictionless packings. The unjamming range of shear amplitudes is largest at , and decreases with increasing density, till it vanishes at . At , both for high amplitudes and very low amplitudes, the system has a finite value of stress. We identify the finite stress packings at low amplitudes as the absorbing phase, and at high amplitudes as the yielded phase. We interpret the presence of an unjamming regime as a reflection of the jamming density moving to higher values upon cyclic deformation. Thus, we identify as the or the cyclic jamming point, the highest jamming density obtained under athermal cyclic shear. Noting that equals the highest density obtained in Chaudhuri et al. 2010, it is tempting to treat it as the highest possible jamming density, but further exploration of possible protocols is required to draw such a conclusion. Our results concerning unjamming are consistent with the observation of softening behaviour of jammed solids close to , for an intermediate range of strain amplitudes Dagois-Bohy et al. 2017.
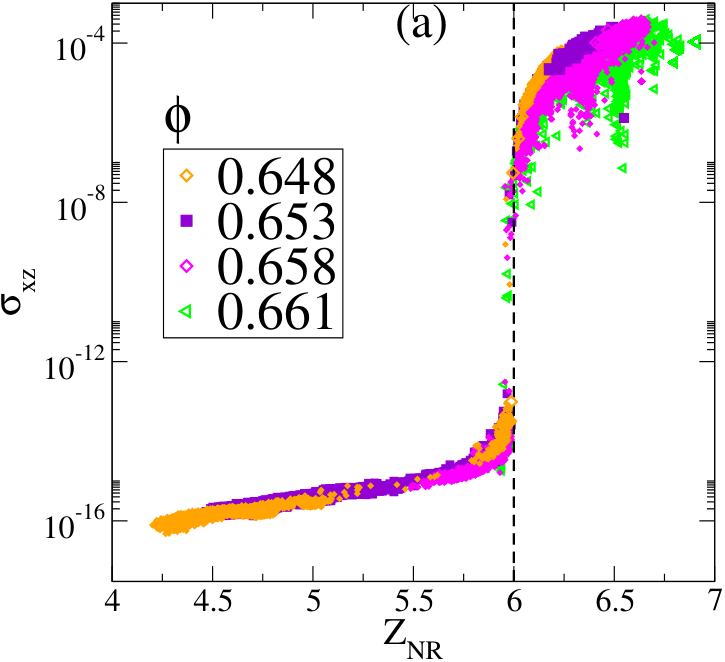
In Fig. 3 (a), we show the shear stress as a function of , for one sample per density and strain amplitude (in the same range as Fig. 2). Each point in the scatter plot corresponds to all the stroboscopic configurations, from the initial configuration up to cycle numbers when the steady state is reached. For , Fig. 3 (a) exhibits two branches, one with close to zero stress and one with finite stress when , above the isostatic contact number. The re-entrant finite stress regime with at high strain amplitudes corresponds to shear jamming, explored in great detail for frictional granular packings Zhang et al. 2010; Bi et al. 2011; Vinutha and Sastry 2016a; Vinutha and Sastry 2019; Otsuki and Hayakawa 2018; Ishima and Hayakawa 2019; Möbius and Heussinger 2014, but also as a possibility in recent times for frictionless packings Kumar and Luding 2016; Baity-Jesi et al. 2016; Jin et al. 2018. Our results open a novel route to generating unjammed packings above the isotropic jamming point , which can shear jam upon the application of shear.
Since the shear jamming is analogous to and contiguous with the yielding transition at higher densities, it is interesting to analyse their comparison further. To this end, we show in Fig 3(b) the MSD in the steady state. for a range of shear amplitudes spanning the absorbing, unjamming and shear jamming regimes. The MSD shown correspond to zero diffusivity for the absorbing (jammed) and the unjamming regimes (and therefore does not distinguish these phases), but a finite diffusivity in the shear jamming phase. As shown in the inset of Fig 3, the diffusivities display a discontinuous jump upon entering the shear jamming regime, analogous to the irreversible, yielded regime at higher densities (see Fig. 1), above . Although diffusivity does not distinguish the absorbing and unjammed regimes, they are distinguished by the presence of zero vs. finite stresses.
IV Reversible-irreversible transitions below the isotropic jamming density
We next study cyclically sheared sphere assemblies below , which show more complex behaviour in the reversible regime Schreck et al. 2013 than initially analysed for colloidal suspensions Pine et al. 2005; Corte et al. 2008. Schreck et al. Schreck et al. 2013 showed that for such packings, two kinds of reversible states are present, referred to as point reversible states (PR) and loop reversible states (LR). In PR states, particles self organize during the initial cycles of strain so that they do not collide with each other. In the LR state, particle continue to collide in the steady state, but return to their original positions at the end of each cycle. For packings below , potential energies and stresses are always zero. Thus, we characterise the trajectories of particles in the steady state in various ways to distinguish different phases and transitions. In addition the MSD, we compute the non-affine path length () (the length of the path traversed by particles in excess of of affine displacements due to global shear strain), and the percentage of new collisions () in a given cycle, compared to a reference cycle in the steady state (see Appendix, section ). As shown in Fig. 4(a), the MSD saturates for small amplitudes and shows diffusive behaviour at higher amplitudes, identified as the irreversible phase (IR). The diffusion coefficient shows a discontinuity (inset of Fig. 4) in a manner analogous to the shear jamming and yielding transitions. MSD fails to identify the transition from the point reversible to the loop reversible state. However, the non-affine path length does: is negligible for point reversible states whereas it is finite for loop reversible states. The number of new collisions further distinguishes the reversible states from the irreversible states, being zero for reversible states and finite for irreversible states. As shown in Fig. 4 (b), the combination of and helps organize all the regimes we observe across densities into three groups: (i) vanishing , (point reversible), (ii) finite , vanishing (loop reversible, unjamming and absorbing states), and (iii) finite and finite (irreversible, shear jammed and yielded states). Additional characterization given in Appendix, section , shows that changes discontinuously both at the PR-LR, and LR-IR transitions, and jumps at the LR-IR transition. Surprisingly, the number of collisions, and the fraction of particles undergoing collisions, change discontinuously at the PR-LR transition, at variance with expectations based on previous work Pine et al. 2005; Corte et al. 2008. The time taken to reach steady state (measured through the decay of (Appendix section 7)), shows non-monotonic change across both the PR-LR and LR-IR transitions, consistently with expectations Pine et al. 2005; Corte et al. 2008; Fiocco et al. 2013; Leishangthem et al. 2017 for reversible-irreversible transitions.
The reversible-irreversible transition line for packings above corresponds to the yielding and shear jamming transitions, whereas below no such obvious correspondence can be drawn. There are recent studies suggesting the possibility of connecting the reversible-irreversible transition line to the shear jamming transition in frictional packings Vinutha and Sastry 2016b; Vinutha and Sastry 2019; Zhang et al. 2010; Otsuki and Hayakawa 2018, but further analysis is needed make such a connection firmly.
V Phase diagram
Although the above analysis apparently offers a tidy grouping of all observed regimes into three types, one may ask if no further boundaries and transitions separate them further. There is indeed such a further separation, in the form of zero or finite energies and stresses. These quantities separate states below and those above, but with a curious exception. Moving from low to high densities at intermediate strain amplitudes at which the unjamming phase exists, energies do not become finite at but at higher densities that correspond to the transition from the unjamming phase to the absorbing phase, or the shear jamming phase. For strain amplitudes larger than the shear jamming value at , the jump to finite energies occurs at . Thus, the unjamming phase forms a curious zero energy and stress pocket in a finite energy regime for densities .
The global phase diagram that emerges, shown in different density regimes in Fig. 6 (a) - (c) and in its entirety in 6 (d), has the point reversible phase at low densities and strain amplitudes, that terminates at the isotropic jamming density . Starting with the loop reversible states below that lie at larger strains, moving to larger densities, one has a sequence of loop reversible states in the form of the unjammed phase, and the absorbing phase. At all densities, at still higher strain amplitudes, one sees a transition to the irreversible states. Interestingly, at all densities, the transition to the irreversible phase is characterized by a discontinuous jump in diffusion coefficients, which has in the past been shown to characterize the yielding transition in glasses under cyclic shear Kawasaki and Berthier 2016; Parmar et al. 2019. The new remarkable observation is that all the transitions we analyse are associated with discontinuous changes in characterisations of trajectories (except the absorbing to unjammed states, characterised instead by a jump in contact number). The presence of loop reversible states at all densities is another general feature that is revealed by our results. Whether these special states are robust in the presence of thermal and other forms of noise remains to be investigated, but they are a common feature of athermally driven systems. Following recent work Adhikari and Sastry 2018; Mungan et al. 2019, analyzing memory effects in the the different reversible regimes in light of the behaviour outlined in this work is of great interest. Although the unjamming phase is closely associated with the presence of a line of jamming points along the density axis, the isotropic jamming density (or minimum jamming density) emerges as a non-trivial threshold density. Point reversible states are confined to densities below this value, and energies and stresses become finite in the irreversible phase beyond this density. As noted however, energies and stresses remain zero above this density in the unjamming pocket, the origins of which merit further investigation.
VI Summary and conclusions
In summary, we have studied the reversible-irreversible transition below, close to and above the jamming density . We have characterised different phases across the isotropic jamming density in detail by studying different microscopic quantities like the mean squared displacement, percentage of new collisions, non-affine path length, stress, potential energy, and contact numbers. For high density jammed packings, the reversible-irreversible transition corresponds to the yielding transition. We have demonstrated the presence of an unjamming region close to but above . We identified as the cyclic shear jamming density, above which the soft sphere packings behave like an elastic amorphous solid. Below , two different forms of reversible phases are present, namely, point and loop reversible. We showed that the non-affine path length and percentage of new collisions clearly distinguish reversible phases and irreversible phases for the whole range of densities. The transition to irreversible behavior is always characterised by the onset of diffusive behaviour of the particles across . All transitions are characterised by discontinuous changes in relevant quantities.
Our work offers a comprehensive view of the response of particle assemblies to cyclic deformation, and is of relevance to a wide range of problems concerning the behaviour of driven amorphous particle assemblies. There are many other obvious directions in which our work can be extended, and we close by a brief discussion of some such directions. Despite much work, the origin of irreversible behaviour, in particular as a transition from periodic to chaotic states Lavrentovich et al. 2017; Regev and Lookman 2017 remains incompletely elucidated. Our work has focused exclusively on frictionless sphere packings, but the role of friction in shear jamming is well appreciated and therefore understanding the implications of results for frictionless packings to the frictional case and extending the analysis here to the frictional case is of obvious importance. Some progress in that direction has been recently made Otsuki and Hayakawa 2018; Vinutha and Sastry 2016b; Vinutha and Sastry 2019. The other direction for further investigation is the role of thermal and other forms of noise on the behaviour revealed by our study. The observation of unjamming opens the exciting possibility of systematically studying (in progress Babu et al. 2019) shear jamming and the related phenomenon of dilatancy in frictionless systems, and the possibility of a unified understanding of frictionless and frictional shear jamming.
Appendix
.1 Materials and Methods
We consider a binary mixture (50:50) of frictionless spheres interacting via a harmonic repulsive potential, , where is the interaction strength, and , the diameter of the particle. and , and reduced units are defined in terms of and .
We apply cyclic shear deformation using the athermal quasistatic protocol (AQS) which consists of an affine transformation to the coordinates (), followed by energy minimization (conjugate gradient method (CG) except when specified otherwise), employing Lees-Edwards periodic boundary conditions. The stopping criterion for minimization is that the energy change between successive line minimizations, normalized to the energy value or the magnitude of the maximum component of force, falls below , whichever is satisfied earlier. For comparison with CG minimization, the FIRE Bitzek et al. 2006 minimization method has been used (see Appendix, section 5). The system is subjected to cyclic deformation of amplitude in small steps , and for densities below and above respectively.
Initial configurations in the density range are obtained from hard sphere fluid configurations at , subjected to fast compression using Monte Carlo simulations. The jamming density is estimated to be , following the method in Chaudhuri et al. 2010. Configurations close to () and above are obtained by a single step decompression or compression of configurations at followed by the energy minimization (CG).
The range of packing fraction for our study is . The strain amplitude range is and for above and below respectively. For , ranges from . To reach the steady state, we perform cycles in the irreversible regime and up to cycles in the reversible regime. Approximately 1950 independent simulations are used to construct the complete phase diagram. The number of independent samples used in different density ranges are - for , for , for , for , and samples at the lowest densities at high amplitudes.
.1.1 Definitions
We compute the following quantities (along with PE and ) to characterize the steady states:
Mean squared displacement(MSD): is defined as:
| (1) |
where is the position at zero strain of particle in cycle number . MSD is averaged over reference cycles .
Average contact number (): is defined as
where is the number of geometric contacts with .
Average non-rattler contact number (): is defined as
where is the number of rattlers in the system, i.e., particles with less than contacts.
Average mechanical contact number (): is defined as:
where are the number of the mechanical contacts. A mechanical contact is identified when the overlap of a pair is greater than (see Appendix, section ). is the number of particles that has finite force or stress. can be and above or , depending in a jammed or unjammed phase respectively. Steady state quantities are indicated with a superscript .
Non-affine path length : The non-affine path length is the average of the magnitude of non-affine displacement per particle within a cycle Schreck et al. 2013.
| (2) |
where is cycle, is strain step, , and .
Percentage of new collisions (): We compute the number of collisions that take place during a given cycle by number of pairs of particles that overlap ( when a stain step is applied. Considering a reference cycle in the steady state, we compute the number of collisions at a later cycle . The number of such collisions which also occurred in the cycle is defined as . The percentage of new collisions for the cycle (we typically use ) after the reference cycle is thus:
| (3) |
.2 Mechanical contacts
In jammed packings especially close to there are always rattler particles. Rattler particles do not belong to the stress carrying rigid network of a jammed packing. The percentage of rattler particles depends on the density of jammed packings and protocol. Higher the packing fraction lower is the percentage of rattlers. For frictionless particles, the geometric criterion for identifying rattlers is that they have contact number . A more robust criterion is a mechanical one, that is, rattlers are particles that do not carry any forces or stresses. However this mechanical criterion requires us to introduce a tolerance to identify a contact that carry stress due to the minimization protocol and the precision of computation. In Fig. 7, we show the cumulative distribution of overlaps for a jammed and an unjammed packing. Ideally the tolerance value is but due to the finite precision of the minimization and protocol details we use a tolerance value of (shown as a vertical dashed line in Fig. 7). Observe that for a jammed packing, we can clearly see that the two distributions are well separated, i.e., contacts that carry stress and those that do not. We also show the cumulative distribution for a quadruple (quad) precision minimization, see Fig. 7. We see that with quadruple precision, we can lower the tolerance value but the contacts that carry stress do not change. Note that in the jammed case, the contacts that have small overlaps with double precision computation, are pushed away when we perform quadruple precision computation. In Fig. 8, we show the full cumulative distribution of the contacts for a jammed and an unjammed configuration. For an unjammed configuration the plateau is below and for a jammed configuration the plateau emerges above .
.3 Potential energy evolution near the yield strain
We monitor the average potential energy (PE) as a function of number of cycles to test if the system has reached a steady state. In Fig. 9, we show the change in the potential energy (PE) of the system under different strain amplitudes. We observe that with the increase in strain amplitude , PE attains lower values for higher in the steady state but above , the steady state value of PE increases with . We also note that as we approach , the yield strain amplitude, from above or below, required to reach the steady state increases. In the data shown, a steady state is reached in all the cases except , at which the energies continue to evolve within the window shown.
.4 Contact number variation in the unjamming region
In Fig. (a) of the paper, we show as a function of , which shows that the system unjams for densities close to . In Fig. 10 (a) and (b), we show the steady state value of the average contact numbers and , for different densities. In Fig. 10(c), we show the evolution of stroboscopic for and different strain amplitudes, which belongs to the unjamming region. We use this to identify steady state configurations. We observe that for and , the system in the jammed (finite stress) state and in the intermediate range of the system is in the unjammed state.
.5 Dependence of geometric contacts on the minimization protocol
The configurations in the unjamming region have a finite value of , see Fig. 10(a). This is due to the minimization method used during AQS simulations. We use the FIRE minimization protocol during AQS steps and show that the unjammed configurations so obtained has . In Fig. 11, we show the evolution of the average contact number as a function of , for CG and FIRE protocol. We observe that the geometric contact number rapidly falls to zero when we use FIRE minimization. By using different tolerance values to identify the geometric contacts (like the mechanical contacts), from the CG method approaches the from the FIRE method, see Fig. 11. Even though FIRE minimization method remove overlaps completely, computationally FIRE minimization method is almost one order of magnitude slower compared to CG minimization method.
.6 Non-affine path length, collisions and active particles below
Because of the finite precision of the minimization, we find overlaps close to the machine precision even in the PR phase. In order to compute the collisions that take place, we, therefore, impose a cut-off of for the overlaps arising between particles after the affine strain step but before minimization resulting in the final configuration. We compute the non-affine path length, the percentage of new collisions () and fraction of active particles to characterise different phases and to identify the transitions. For the point reversible states (PR), particles trace the same path in a cycle (as there are no collisions ) and hence and is zero. For the loop reversible states (LR), collisions occur in a cycle, and hence the non-affine path length is finite. Also, in the loop reversible states, even though collisions occur, they occur between the same pairs and hence , see Fig. 12. Only in the diffusive region, irreversible states (IR), is finite. In Fig. 12(a), we show as a function of , which we have used to identify the steady state configurations. When a particle at least collides once within a cycle during the affine transformation, in its steady state, we identify such a particle as an active particle. Even though the number of collisions shows a strain dependent increase (see Fig. 12(e)) beyond PR phase, almost all the particles seem to collide at least once in a cycle in LR or IR phase (Fig. 12 (f)). To summarise, PR to LR transition is identified by the discontinuous jump in , and fraction of active particles whereas LR to IR transition is captured through the discontinuous increase of and .
.7 Timescales across the phases below
The non-affine path length that we have used to identify and characterise different phases below , captures the slow down of relaxation to the steady state near the PR - LR and LR - IR transitions. The timescale () has been extracted from the relaxation of the as the system approaches a steady state with increasing . The point reversible phase shows an exponential decay , whereas the loop reversible phase and the irreversible phase show a stretched exponential decay () of the non-affine path length. We see an initial increase of the as we approach PR-LR boundary (see Fig 13) and we see a similar increase in timescale across LR-IR boundary after an intermediate decrease of in the middle region of the LR phase. This behaviour indicates the existence of two different transitions at the upper and lower limit of the loop reversible phase. The results shown do not permit us to conclude that the time scales diverge at the transitions, and a more careful analysis close to the transitions is required to make any definite statements in this regard.
References
- Mason et al. (1996) T. Mason, J. Bibette, and D. Weitz, Journal of Colloid and Interface Science 179, 439 (1996).
- Brown and Jaeger (2012) E. Brown and H. M. Jaeger, Journal of Rheology 56, 875 (2012).
- Peters et al. (2016) I. R. Peters, S. Majumdar, and H. M. Jaeger, Nature 532, 214 (2016).
- Mari et al. (2014) R. Mari, R. Seto, J. F. Morris, and M. M. Denn, Journal of Rheology 58, 1693 (2014).
- Wyart and Cates (2014) M. Wyart and M. Cates, Physical review letters 112, 098302 (2014).
- Liu and Nagel (2010) A. J. Liu and S. R. Nagel, Annu. Rev. Condens. Matter Phys. 1, 347 (2010).
- Bi et al. (2011) D. Bi, J. Zhang, B. Chakraborty, and R. Behringer, Nature 480, 355 (2011).
- Ren et al. (2013) J. Ren, J. A. Dijksman, and R. P. Behringer, Physical review letters 110, 018302 (2013).
- Coulais et al. (2014) C. Coulais, A. Seguin, and O. Dauchot, Physical review letters 113, 198001 (2014).
- Baity-Jesi et al. (2016) M. Baity-Jesi, C. P. Goodrich, A. J. Liu, S. R. Nagel, and J. P. Sethna, J. Stat. Phys. , 1 (2016).
- Behringer and Chakraborty (2018) R. P. Behringer and B. Chakraborty, Reports on Progress in Physics 82, 012601 (2018).
- Vinutha and Sastry (2016a) H. Vinutha and S. Sastry, Journal of Statistical Mechanics: Theory and Experiment 2016, 094002 (2016a).
- Vinutha and Sastry (2019) H. Vinutha and S. Sastry, Physical Review E 99, 012123 (2019).
- Falk and Langer (2011) M. L. Falk and J. S. Langer, Annu. Rev. Condens. Matter Phys. 2, 353 (2011).
- Karmakar et al. (2010) S. Karmakar, E. Lerner, and I. Procaccia, Physical Review E 82, 055103 (2010).
- Urbani and Zamponi (2017) P. Urbani and F. Zamponi, Physical review letters 118, 038001 (2017).
- Jin et al. (2018) Y. Jin, P. Urbani, F. Zamponi, and H. Yoshino, arXiv preprint arXiv:1803.04597 (2018).
- Jaiswal et al. (2016) P. K. Jaiswal, I. Procaccia, C. Rainone, and M. Singh, Physical review letters 116, 085501 (2016).
- Leishangthem et al. (2017) P. Leishangthem, A. D. Parmar, and S. Sastry, Nature communications 8, 14653 (2017).
- Parisi et al. (2017) G. Parisi, I. Procaccia, C. Rainone, and M. Singh, Proceedings of the National Academy of Sciences 114, 5577 (2017).
- Divoux et al. (2016) T. Divoux, M. A. Fardin, S. Manneville, and S. Lerouge, Annual Review of Fluid Mechanics 48, 81 (2016).
- Bonn et al. (2017) D. Bonn, M. M. Denn, L. Berthier, T. Divoux, and S. Manneville, Reviews of Modern Physics 89, 035005 (2017).
- Vasisht et al. (2017) V. V. Vasisht, G. Roberts, and E. Del Gado, arXiv preprint arXiv:1709.08717 (2017).
- Kawasaki and Berthier (2016) T. Kawasaki and L. Berthier, Physical Review E 94, 022615 (2016).
- Jagla et al. (2014) E. A. Jagla, F. P. Landes, and A. Rosso, Physical review letters 112, 174301 (2014).
- Uhl et al. (2015) J. T. Uhl, S. Pathak, D. Schorlemmer, X. Liu, R. Swindeman, B. A. Brinkman, M. LeBlanc, G. Tsekenis, N. Friedman, R. Behringer, et al., Scientific reports 5, 16493 (2015).
- Jerolmack and Daniels (2019) D. J. Jerolmack and K. E. Daniels, arXiv preprint arXiv:1903.04462 (2019).
- Sun et al. (2016) Y. Sun, A. Concustell, and A. L. Greer, Nature Reviews Materials 1, 16039 (2016).
- Priezjev (2019) N. V. Priezjev, Journal of Non-Crystalline Solids 503, 131 (2019).
- Ness et al. (2018) C. Ness, R. Mari, and M. E. Cates, Science advances 4, eaar3296 (2018).
- Pine et al. (2005) D. Pine, J. P. Gollub, J. Brady, and A. Leshansky, Nature 438, 997 (2005).
- Corte et al. (2008) L. Corte, P. Chaikin, J. P. Gollub, and D. Pine, Nature Physics 4, 420 (2008).
- Schreck et al. (2013) C. F. Schreck, R. S. Hoy, M. D. Shattuck, and C. S. O’Hern, Physical Review E 88, 052205 (2013).
- Regev et al. (2013) I. Regev, T. Lookman, and C. Reichhardt, Physical Review E 88, 062401 (2013).
- Keim et al. (2018) N. C. Keim, J. Paulsen, Z. Zeravcic, S. Sastry, and S. R. Nagel, arXiv preprint arXiv:1810.08587 (2018).
- Royer and Chaikin (2015) J. R. Royer and P. M. Chaikin, Proceedings of the National Academy of Sciences 112, 49 (2015).
- Fiocco et al. (2014) D. Fiocco, G. Foffi, and S. Sastry, Physical review letters 112, 025702 (2014).
- Adhikari and Sastry (2018) M. Adhikari and S. Sastry, The European Physical Journal E 41, 105 (2018).
- Lavrentovich et al. (2017) M. O. Lavrentovich, A. J. Liu, and S. R. Nagel, Physical Review E 96, 020101 (2017).
- Paulsen et al. (2014) J. D. Paulsen, N. C. Keim, and S. R. Nagel, Physical review letters 113, 068301 (2014).
- Keim and Nagel (2011) N. C. Keim and S. R. Nagel, Physical review letters 107, 010603 (2011).
- Fiocco et al. (2013) D. Fiocco, G. Foffi, and S. Sastry, Physical Review E 88, 020301 (2013).
- Priezjev (2013) N. V. Priezjev, Phys. Rev. E 87, 052302 (2013).
- Regev et al. (2015) I. Regev, J. Weber, C. Reichhardt, K. A. Dahmen, and T. Lookman, Nature communications 6, 8805 (2015).
- O’Hern et al. (2003) C. S. O’Hern, L. E. Silbert, A. J. Liu, and S. R. Nagel, Physical Review E 68, 011306 (2003).
- Chaudhuri et al. (2010) P. Chaudhuri, L. Berthier, and S. Sastry, Physical review letters 104, 165701 (2010).
- Ozawa et al. (2012) M. Ozawa, T. Kuroiwa, A. Ikeda, and K. Miyazaki, Physical review letters 109, 205701 (2012).
- Dagois-Bohy et al. (2017) S. Dagois-Bohy, E. Somfai, B. P. Tighe, and M. van Hecke, Soft matter 13, 9036 (2017).
- Nagasawa et al. (2019) K. Nagasawa, K. Miyazaki, and T. Kawasaki, arXiv preprint arXiv:xxx.yyyy (2019).
- Berthier and Witten (2009a) L. Berthier and T. A. Witten, EPL (Europhysics Letters) 86, 10001 (2009a).
- Berthier and Witten (2009b) L. Berthier and T. A. Witten, Physical Review E 80, 021502 (2009b).
- Parmar et al. (2019) A. D. Parmar, S. Kumar, and S. Sastry, Physical Review X 9, 021018 (2019).
- Kumar and Luding (2016) N. Kumar and S. Luding, Granular Matter 18, 58 (2016).
- Wyart et al. (2005) M. Wyart, S. R. Nagel, and T. A. Witten, EPL (Europhysics Letters) 72, 486 (2005).
- Zhang et al. (2010) J. Zhang, T. Majmudar, A. Tordesillas, and R. Behringer, Granular Matter 12, 159 (2010).
- Otsuki and Hayakawa (2018) M. Otsuki and H. Hayakawa, arXiv preprint arXiv:1810.03846 (2018).
- Ishima and Hayakawa (2019) D. Ishima and H. Hayakawa, arXiv preprint arXiv:1902.04759 (2019).
- Möbius and Heussinger (2014) R. Möbius and C. Heussinger, Soft matter 10, 4806 (2014).
- Vinutha and Sastry (2016b) H. Vinutha and S. Sastry, Nature Physics 12, 578 (2016b).
- Mungan et al. (2019) M. Mungan, S. Sastry, K. Dahmen, and I. Regev, arXiv preprint arXiv:1905.09259 (2019).
- Regev and Lookman (2017) I. Regev and T. Lookman, arXiv preprint arXiv:1701.04020 (2017).
- Babu et al. (2019) V. Babu, D. Pan, Y. Jin, H. Vinutha, B. Chakraborty, and S. Sastry, (in preparation) (2019).
- Bitzek et al. (2006) E. Bitzek, P. Koskinen, F. Gähler, M. Moseler, and P. Gumbsch, Physical review letters 97, 170201 (2006).