A local resolution of the Hubble tension:
The impact of screened fifth forces on the cosmic distance ladder
Abstract
The discrepancy between the values of the Hubble constant derived from the local distance ladder and the cosmic microwave background provides a tantalising hint of new physics. We explore a potential resolution involving screened fifth forces in the local Universe, which alter the Cepheid calibration of supernova distances. In particular, if the Cepheids with direct distance measurements from parallax or water masers are screened but a significant fraction of those in other galaxies are not, neglecting the difference between their underlying period–luminosity relations biases the local measurement high. This difference derives from a reduction in the Cepheid pulsation period and possible increase in luminosity under a fifth force. We quantify the internal and environmental gravitational properties of the Riess et al. distance ladder galaxies to assess their degrees of screening under a range of phenomenological models, and propagate this information into the posterior as a function of fifth force strength. We consider well-studied screening models in scalar–tensor gravity theories such as chameleon, K-mouflage and Vainshtein, along with a recently-proposed mechanism based on baryon–dark matter interactions in which screening is governed by local dark matter density. We find that a fifth force strength that of gravity can alleviate (though not resolve) the tension in some scenarios, around the sensitivity level at which tests based on other distance ladder data can constrain this strength. Many of our models reduce the tension below , but reduction below is unlikely possible while maintaining self-consistency of the distance ladder. Although our analysis is exploratory and based on screening models not necessarily realised in full theories, our results demonstrate that new physics-based local resolutions of the tension are possible, supplementing those already known in the pre-recombination era.
I Introduction
The Hubble parameter , describing the expansion rate of the Universe today, is a critical quantity in cosmology. Perhaps the most significant discrepancy that currently exists in the standard cosmological model, CDM, is that when measured locally (out to 100 Mpc) is found to be 74 km s-1 Mpc-1, while high-redshift observations imply 67 km s-1 Mpc-1. The current most precise estimates from these two regimes are km s-1 Mpc-1 from the local distance ladder Riess et al. 2016; Riess et al. 2018; Riess et al. 2019 (hereafter R16, R18 & R19) and km s-1 Mpc-1 from the cosmic microwave background (CMB) Aghanim et al. 2018 (hereafter Planck), a tension of . These are supplemented at low redshift by independent analyses such as H0LiCOW, which uses time delay distances to low-redshift lensed quasars to derive km s-1 Mpc-1 Wong et al. 2019, and at high redshift by galaxy and Ly measurements of baryon acoustic oscillations calibrated against elemental abundances from Big Bang nucleosynthesis Addison et al. 2018 and the “inverse distance ladder” Macaulay et al. 2019, yielding km s-1 Mpc-1 and km s-1 Mpc-1 respectively.
Prospective resolutions to this disagreement fall into one of three classes. The first is to modify the statistical framework to refine the measure of the tension (e.g. Cardona et al. 2017; Zhang et al. 2017; Feeney et al. 2018; Bennett et al. 2014). While a range of estimates for the probability of distance ladder and CMB concordance are derivable from plausible methodologies, the magnitude of the raw discrepancy (derived simply by combining errorbars in quadrature) has been growing, and is now sufficiently large that almost all statistical approaches suggest strong disagreement. The second is to argue that one or more of the pipelines suffer from systematics which have not been fully accounted for in the fiducial analyses. This is more plausible for the distance ladder measurements than the CMB due to the complexity of the calibrations between rungs of the ladder and the range of models required to describe the astrophysical objects involved, although some fraction of the discrepancy could be due to systematics in CMB measurements (e.g. Spergel et al. 2015). For the distance ladder, re-analyses have focused on the treatment of outliers in the Cepheid period–luminosity relation (PLR) Efstathiou 2014; Becker et al. 2015, the dependence of supernova luminosity on the mass and star formation rate of the host galaxy Rigault et al. 2015, the parallaxes of Milky Way Cepheids Benedict et al. 2007; Shanks et al. 2019 and the geometric distances to the anchor galaxies Fitzpatrick et al. 2000; Humphreys et al. 2013.

The final class of solutions to the tension is to postulate new physics that introduces a difference between the expansion rate inferred locally and at recombination. Although requiring a deviation from CDM, and therefore less conventional, this could naturally explain the fact that a variety of local measurements cluster around km s-1 Mpc-1 and high-redshift ones around km s-1 Mpc-1. For example, it has been proposed that the Milky Way is near the centre of a statistically underdense region of size potentially several hundred Mpc, which would generate streaming velocities away from us and hence bias local measurements of high Wojtak et al. 2014; Kenworthy et al. 2019. The CMB measurements are also sensitive to the physics of recombination, which may be modified to alter the constraint Lin et al. 2019; Chiang and Slosar 2018. Alternatively, an increase in the number of relativistic degrees of freedom by 0.4–1 (“dark radiation”) could partially resolve the tension Wyman et al. 2014; Aubourg et al. 2015; Hinshaw et al. 2013; Ade et al. 2016; this is degenerate with a change in the effective strength of gravity between the epochs of Big Bang Nucleosynthesis and recombination Steigman 2012. There is also a significant degeneracy with the systematic lensing power parameter Ade et al. 2016, whose measured deviation from unity is not understood. A component of dark energy at very high redshift Karwal and Kamionkowski 2016; Poulin et al. 2019; Kaloper 2019, an interaction of dark energy Pourtsidou and Tram 2016; Agrawal et al. 2019a, an injection of energy from scalar fields at recombination Agrawal et al. 2019b or the decay of dark matter into dark radiation at the time of matter-radiation equality Berezhiani et al. 2015; Bringmann et al. 2018; Pandey et al. 2019 or later Vattis et al. 2019 may also push the CMB value upwards. A full high-redshift solution would appear to require an exotic physics scenario however, as none of the commonly-considered extensions to CDM offer an entirely satisfactory solution Ade et al. 2016; Bernal et al. 2016; Alam et al. 2017.
We propose a local resolution to the tension relying on theoretically and observationally well-motivated physics beyond the standard model. Specifically, we describe how a partially screened fifth force naturally leads to an overestimate of in distance-ladder analyses if the gravitational properties of Cepheids calibrating the period–luminosity relation (principally in the Milky Way and N4258) differ from those of Cepheids in galaxies with Type Ia supernovae (hereafter simply “SNe”), which are used to extend the distance ladder to higher redshift. The emergence of a fifth force is a generic prediction of theories that couple new dynamical degrees of freedom to matter, postulate new interactions between objects, or seek to provide a dynamical explanation of dark energy Clifton et al. 2012; Koyama 2016; Burrage and Sakstein 2018; Sakstein 2018a (although see Heckman et al. 2019 for an exception). The phenomenon of screening—a reduction of fifth force strength in regions of strong gravitational field—was originally proposed to keep scalar–tensor theories of gravity consistent with tests of the equivalence principle, the inverse square law and post-Newtonian tests of gravity within the Solar System while allowing them to impact astrophysical and cosmological observables, and has now been recognised as a fairly generic property of theories with fifth forces (see e.g. Khoury 2010; Jain and Khoury 2010; Joyce et al. 2015; Burrage and Sakstein 2016; Burrage and Sakstein 2018; Sakstein 2018a; Ishak 2019, and references therein). The Universe’s accelerated expansion has been hypothesised to arise from new fields in this way Copeland et al. 2006; Clifton et al. 2012, and the low-energy limits of UV complete theories are expected to contain screened fifth forces on a range of scales Davis et al. 2012; Jain et al. 2013; Vikram et al. 2018; Koyama and Sakstein 2015; Sakstein 2015a; Sakstein 2015b; Sakstein et al. 2017a; Babichev et al. 2016; Sakstein et al. 2017b; Sakstein et al. 2016; Sakstein et al. 2017c; Sakstein 2018b; Adhikari et al. 2018; Khoury et al. 2018. Empirical searches for these are growing in sophistication (Burrage and Sakstein 2018; Burrage 2019; Brax et al. 2018, e.g.), with several indications that they may in fact be of use in accounting for certain astrophysical phenomena Lombriser and Peñarrubia 2015; Burrage et al. 2017; Desmond et al. 2018a; Desmond et al. 2018b; Naik et al. 2019.
In this paper we develop a framework for propagating gravitational enhancements due to fifth forces into the distance constraints on extragalactic Cepheid hosts, and hence when SN measurements are included. We implement a range of phenomenological screening models within this framework—in which the degree of screening is set by either environmental or intra-halo gravitational variables—in order to quantify the bias expected in under various scenarios for fifth force behaviour. Some of our screening proxies correspond to commonly studied mechanisms including chameleon Khoury and Weltman 2004a; Khoury and Weltman 2004b, symmetron Hinterbichler and Khoury 2010, dilaton Brax et al. 2010, K-mouflage Babichev et al. 2009 and Vainshtein Vainshtein 1972 screening. In a companion paper Sakstein et al. 2019, we present a new screening mechanism in which interactions between dark matter and baryons make Newton’s constant a function of local dark matter density: this enables us to add to our list of possible screening proxies. This theory is particularly interesting because the same dark matter–baryon interactions could drive cosmic acceleration Berezhiani et al. 2017. Other proxies that we consider do not (yet) correspond to known screening models but simply quantify different aspects of gravitational environment.
The structure of the paper is as follows. In Sec. II we provide more information on the determination of by the distance ladder method, the origin and nature of screened fifth forces, and the impact of fifth forces on Cepheids. In Appendix B we consider the further effect of unscreening SNe. In Sec. III we describe our models for setting the fifth force strengths experienced by the objects in the distance ladder dataset, then use this information to rederive the galaxies’ distances and hence the constraint. In Sec. IV we formulate and carry out consistency tests within the distance ladder data that limit the possible action of a fifth force, then use these bounds to derive maximal viable modifications to by our mechanism. Sec. V provides caveats and possible systematics, speculates on future theoretical and observational developments, and discusses the broader ramifications of our work for expansion rate inference and the study of fifth forces generally. Sec. VI concludes.
II Unscreening the distance ladder
II.1 Overview
Determining via the distance ladder involves calibrating distances to a number of different types of objects in the local Universe in order to reach cosmological redshifts. Within the Milky Way (MW), parallaxes of Cepheids are measured with Hipparcos, HST and Gaia, allowing direct determination of their distance. This enables their apparent magnitudes to be converted into luminosities, which, along with the measured pulsation periods, provides an absolute calibration of the PLR. This is believed to be near-universal across the Cepheid population García-Varela et al. 2013, although there is a weak dependence on metallicity Storm et al. 2011. Further constraining power for the PLR comes from Cepheids in the Large Magellanic Cloud (LMC) and M31 Persson et al. 2004; Gieren et al. 1998, the distances to which are measured independently with detached eclipsing binaries Pietrzyński et al. 2013, and in N4258 whose distance is calibrated with a water maser Humphreys et al. 2013. The distance ladder is then extended with a sample of Cepheids in more distant galaxies. The periods and apparent magnitudes of these Cepheids are measurable, but their luminosities and hence distances must be inferred by situating them on the PLR. The galaxies are chosen to host SNe so that their Cepheid distances allow calculation of the SN absolute magnitudes. As SNe are standardizable candles, this information may be used to calibrate a cosmological SN sample and hence extend the distance–redshift relation beyond . The slope of this relation as provides the value of Riess et al. 2009; Riess et al. 2011.
A key assumption of this method is that the physics governing the objects used in the ladder (principally Cepheids and SNe) is homogeneous between rungs. If this assumption breaks down, a bias will be induced in the distance determinations, which will propagate into the cosmological SN analysis and hence the inferred value of . In general, any novel physics affecting Cepheids, SNe, masers, or eclipsing binaries should be parameterised, implemented in the full likelihood function and marginalised over to rederive the posterior.
In this work we explore a specific class of modifications to Cepheids involving the action of a screened fifth force. The effect of this on the distance ladder derives primarily from the impact of a new force on the pulsation and energy generation rate of Cepheids. Taking a scalar–tensor theory for illustration, and assuming a Compton wavelength for the scalar much larger than the size of the star (i.e. the field is relatively light), the fifth force scales with distance as and hence simply augments the gravitational force, effectively increasing the value of Newton’s constant from to . We show below that this reduces the Cepheid pulsation period while increasing the luminosity. If all Cepheids experience the same effective , this does not affect distance inferences as the PLR traced out by the calibration Cepheids in the MW and N4258 will coincide with that of the Cepheids in the SN hosts. However, if the calibration and cosmological Cepheids experience different values of on average, the offset in PLR normalizations will bias the inferred Cepheid luminosities and hence their distances. A schematic of the distance ladder, and the sensitivity of its rungs to fifth forces, is shown in Fig. 1 (left).
The scenario we envision is that a difference in between the MW, N4258, and other galaxies comes about through a difference in their screening properties, caused in turn by a difference in their gravitational environments. In particular, if all MW and N4258 Cepheids are screened by their dense surroundings (as the Solar System must be to suppress the fifth force locally) and a significant fraction of the extragalactic Cepheids are not, the inferred luminosities of the latter will be lower than the true ones, and hence the distances to their hosts will be underestimated. For fixed redshift, this biases the estimate of high. Additionally, the uncertainty in the screening properties of the Cepheids would broaden the posterior. We therefore expect this scenario to reduce the tension of the distance ladder and CMB estimates. Sec. II.2 quantifies the effect of on Cepheid properties, while Sec. III further propagates this information into distance estimates to the SN hosts, and hence .
We consider a variety of phenomenological proxies for the degree of screening and use them to separate Cepheids into those sensitive or insensitive to the fifth force. These proxies are inspired by the chameleon Khoury and Weltman 2004b, symmetron Hinterbichler and Khoury 2010, dilaton Brax et al. 2010, K-mouflage Babichev et al. 2009; Brax and Valageas 2014, Vainshtein Vainshtein 1972, and baryon–dark matter interaction Sakstein et al. 2019 screening mechanisms, although they are typically more general and/or empirically motivated:
- i
Externally sourced Newtonian potential . This is the environmental contribution to screening by the thin-shell mechanisms chameleon, symmetron, and dilaton. This model has the additional degree of freedom of the Compton wavelength of the scalar field , which determines the radius out to which sources contribute to the screening potential. We explore the range .
- ii
Externally sourced acceleration . This is the environmental contribution to screening under a kinetic mechanism such as K-mouflage. Although kinetic models do not possess a mass or Compton wavelength, we introduce a cutoff scale beyond which sources are considered to have decoupled from the screening behaviour of the test object. This behaves similarly to in the thin-shell models, and we consider the same range .
- iii
Externally sourced curvature. This is quantified by the Kretschmann scalar and is a proxy for screening in the Vainshtein mechanism. We use a cutoff scale as above: in massive gravity de Rham 2014; de Rham et al. 2017a and massive Galileon de Rham et al. 2017b; Sakstein and Trodden 2018 models this would again correspond to the Compton wavelength of the field.
- iv
Galaxy stellar mass. The galaxy’s -band luminosity is used as a proxy for the galaxy’s stellar mass, which provides the bulk of the baryonic contribution to self-screening.
- v
Dynamical mass. This is inferred from the galaxies’ neutral hydrogen gas, and in particular the HI linewidth measured at of peak flux, . It is a proxy for self-screening.
- vi
Halo virial mass . Although not directly measurable, and hence subject to larger uncertainty than or , theoretically this quantifies more directly the screening properties of the halo as a whole.
- vii
Local dark matter density. Interactions between dark matter and baryons, in particular the dark energy model of Berezhiani et al. 2017, predict to be a function of the local dark matter density , with stronger modifications in less dense environments Sakstein et al. 2019. This screening mechanism is phenomenologically distinct from the others by being sensitive to the position of the test object within its dark matter halo, and can therefore assign different degrees of screening to different objects within the same halo.
II.2 Fifth force effects on Cepheids
The luminosity of Cepheid stars is due to a thin hydrogen burning shell surrounding their inert helium core (there may be a small amount of core helium burning but the luminosity is due primarily to the shell). The pulsations on the other hand are driven entirely by the star’s envelope. In particular, a layer of doubly-ionised helium acts as an energy dam because small contractions of the star result in further ionization rather than a temperature or pressure increase (which would counter the contraction) Cox 1980. The pulsation occurs because this energy is eventually released after sufficient contraction. In Sakstein et al. 2019 we describe in detail how a fifth force impacts Cepheids, finding two main effects: first, if the envelope is unscreened then the dynamics driving the pulsation are modified, and second, if the core is unscreened the luminosity will be enhanced (a faster burning rate is required to balance the stronger gravity). For chameleon models and similar, the Cepheid core is screened and the envelope is unscreened Jain et al. 2013. In the case where the fifth force is due to a dark matter–baryon interaction, as we discuss further below, the entire star is unscreened. Other screening mechanisms may exhibit either of these behaviours. We now derive the modification to the PLR due to both of these effects.
We begin with an unscreened envelope. The period of a Cepheid’s pulsation is set heuristically by the free-fall time, Cox 1980, although more accurate results with precisely the same scaling follow from the linear adiabatic wave equation Sakstein 2013. We model the impact of the fifth force as an effective increase in Newton’s constant ; for theories in which the fifth force is not of the same form as Newtonian gravity, can be thought of as an average of the radial fifth force profile weighted with a kernel that prioritises the regions most important for driving the pulsations Jain et al. 2013. This means that the PLR of unscreened Cepheids is normalised lower in by a factor than that of the screened Cepheids in the MW and N425811 1 The PLR is also calibrated using eclipsing binary distances to the LMC and M31; in Sec. V we discuss further our assumption that these also effectively calibrate the screened PLR. that comprise the calibration sample:
| (1) |
where and has base 10 throughout. A reduction in period shifts the PLR equivalently to an increase in luminosity by an amount determined by the logarithmic slope of the PLR, which we call :
| (2) |
We take a fiducial value for of Becker et al. 2015. Assuming the same PLR for both calibration and unscreened samples therefore causes the luminosity of the unscreened Cepheids to be underestimated.
Next we calculate the change to the PLR if the core is unscreened. As described in detail in Sakstein et al. 2019, we have modified the stellar structure code MESA Paxton et al. 2011; Paxton et al. 2013; Paxton et al. 2015; Paxton et al. 2018 to simulate stellar evolution for . An example is shown in Fig. 2, where we plot the Hertzsprung–Russell track for a 5 Cepheid for different values of as indicated in the legend. We see that the luminosity of the blue loop in the instability strip is enhanced for stronger gravity. To quantify this, we have run a grid of models in the mass range with , the mean metallicity in the R16 sample. (Metallicity variations will add to the scatter, but are subdominant to the effects of changing .) We find that at the blue edge of the instability strip, a convenient comparison point, is well fit by a linear relation:
| (3) |
The value of the slope depends on the mass of the Cepheid and whether it is observed at the second or third crossing of the instability strip,22 2 We define the second/third crossing as the second/third time a star crosses the instability strip. The first crossing refers to the brief period where the star has exited the main sequence but not yet become a red giant. This phase is shorter than the other two and not typically observed. as quantified in Table 1 (reproduced from Sakstein et al. 2019). A schematic depiction of how unscreening each region of the Cepheid affects the PLR is shown in Fig. 1 (right).
| Slope at crossing | Slope at crossing | |
| 7 | 4.45 | 3.79 |
| 8 | 4.34 | 3.58 |
| 9 | 4.18 | 3.46 |
| 10 | 4.00 | 3.48 |
| 11 | 3.81 | 3.58 |
| 12 | 3.67 | 3.92 |
| 13 | 3.58 | 3.95 |
III Methodology
In this section we construct a model for including a partially-screened fifth force. Rather than repeat the full inference of with additional modified gravity parameters—which would require non-public data, an extensive exploration of subtleties involving the compatibility of the datasets and treatment of outliers, and a precise prior formulation of the screening models under investigation—we opt simply to modify the R19 result according to the screening properties of the Cepheids in various scenarios. This ensures that our results agree with R19 in the fiducial case of CDM (or equivalently all galaxies fully screened), and we caution that therefore all the assumptions present in that analysis are included here. Sec. III.1 describes our methods for calculating the screening proxies, while Sec. III.2 models the posterior in a given scenario with all uncertainties folded in. This approach is model-independent and applies in full generality to any scenario in which Cepheids in the distance ladder samples experience different effective strengths of gravity. It could also be applied to scenarios in which periods and luminosities vary for other reasons. In Appendix B we consider the additional possibility of the fifth force affecting SNe, which does not however affect our conclusions.
The reader uninterested in the details of the method may safely skip now to Sec. IV, which presents our results.
III.1 Calculating fifth force strength: The screening models
In Sec. II.1 we laid out the screening proxies that we consider for segregating Cepheids into screened and unscreened subpopulations. Proxies (i)–(iii) are determined using the screening maps of Desmond et al. 2018c, which synthesises galaxy survey data, halo catalogues from N-body simulations and analytic and numerical structure formation models (based partly on the BORG algorithm Jasche and Lavaux 2019; Lavaux and Jasche 2016) to reconstruct the gravitational field out to a distance 250 Mpc. Full details can be found in the original paper. For illustration, we will consider three values for or —, and Mpc—which we indicate with a subscript to , , or . Proxies (iv) and (v), along with their uncertainties, are extracted from the NASA Extragalactic Database (NED) and Extragalactic Distance Database (EDD) respectively ( by means of the absolute visual magnitude ). We use pre-digital values for homogeneity, as many galaxies do not have digital values recorded.33 3 A few R16 galaxies are missing information in these databases. We replace the -band magnitude of NGC 4536 with the NIR magnitude, and the predigital for NGC 4038 and NGC 5917 by HIPASS measurements, also from EDD, which are similarly normalised. Galaxies for which magnitude uncertainties are not listed in NED are assigned . For the MW, we estimate and hence through a linear correlation of and stellar mass (as recorded for 145,155 galaxies in the NASA Sloan Atlas44 4 http://nsatlas.org/) assuming Licquia and Newman 2015. This yields , which roughly agrees with the result of Karachentsev et al. 2004.55 5 Several alternative methods exist for determining the virial properties of the MW, and alternative calibrations of its magnitude and linewidth are possible. Our values are however roughly consistent with literature results (e.g. Taylor et al. 2016; Dehnen et al. 2006; Eilers et al. 2019; Xue et al. 2008; Karachentsev et al. 2004). We estimate for the MW through the – relation of Lelli et al. 2019 assuming km/s, and conservatively assign , km/s. Proxy (vi) is determined from (iv) using the technique of halo abundance matching (AM) Kravtsov et al. 2004; Conroy et al. 2006; Behroozi et al. 2010; Moster et al. 2010, in particular the best-fit model of Lehmann et al. 2017. This probabilistically assigns a galaxy of given to a halo from an N-body simulation (in our case DarkSky-400 Skillman et al. 2014 post-processed with Rockstar Behroozi et al. 2013) by matching the magnitude function to the function of a halo proxy formed from a combination of halo virial mass and concentration designed to maximise agreement with clustering statistics.66 6 By using the CDM halo mass function we assume our fifth force models to have negligible effect on cosmic structure formation and the density profiles of halos. For the small subset of our screening proxies for which this has been directly tested with modified gravity N-body codes, fifth force strengths and ranges that do lead to significant changes to these observables have already been ruled out Shi et al. 2015; Bianchi et al. 2013; Lombriser 2014. Further, the values that we find to be necessary for reconciling the R19 and Planck results, , are lower than those probed cosmologically. Finally, proxy (vii) is calculated by modelling each host galaxy’s halo by an Navarro-Frenk-White (NFW) profile—with mass and concentration derived from AM, as above—and then sampling this density distribution at the position of a Cepheid within the galaxy. The locations of the Cepheids are taken from R16 Table 4. Note however that the full 3D distance of a Cepheid from the centre of its halo is not known, but only the projected 2D distance from the centre of the galaxy in the plane of the sky. We assume , corresponding on average to random orientation of the line of sight with respect to the displacement of the Cepheid from the halo centre, and take the halo centre to be at the quoted galaxy position.
Given the three variants (values of ) that we consider for proxies (i)–(iii) this gives 13 proxies in total. Although clearly correlated by common sources in the mass distribution both of the halos themselves and the surrounding environment, these are intended to largely span the gravitational parameter space of the galaxies. Other proxies may be formed by combination: for example, in thin-shell screening the strength of the fifth force is determined by the total Newtonian potential Cabré et al. 2012; Zhao et al. 2011a; Zhao et al. 2011b, which is the sum of (i) and a simple function of (v) or (vi). This makes it easy to extend or approximately interpolate our results for other screening models.
Our determination of each of these quantities is inherently probabilistic, and a potentially important source of uncertainty in our estimate of stems from uncertainties in the galaxies’ screening properties under a given model. We therefore make sure to propagate fully the uncertainties in the inputs into probability distributions for the final proxy values. The pipeline of Desmond et al. 2018c naturally produces probability distributions for , and by Monte Carlo sampling those of the inputs to that model. Uncertainties in and concentration are derived by first generating 200 AM mock catalogues (sampling the uncertainty in the galaxy-halo connection induced by the AM scatter parameter Lehmann et al. 2017), and then for each model realisation drawing a random magnitude for the galaxy from a normal distribution of mean and standard deviation and assigning to it the halo from a randomly-chosen AM mock that is nearest to it in magnitude. The uncertainties in and concentration are propagated directly into by an analogous Monte Carlo method. This procedure includes the uncertainties on the proxy values of the MW and N4258 which set the screening threshold (see below), so that all errorbars are folded into the uncertainties on each galaxy’s modified distance.
Finally these proxies must be mapped to an effective value for each Cepheid. At the phenomenological level at which we are working this mapping is fairly free, although in keeping with the principle of screening it must give for proxy values indicating a sufficiently dense environment. Specific theories impose particular requirements on the threshold value of the proxy and the value of in the unscreened regime: e.g. in Hu-Sawicki Hu and Sawicki 2007, a common benchmark model for chameleon screening, an object is unscreened if ( denotes the background value of the scalar field), in which case . In this work we consider the optimistic case in which any object with a proxy value lower than that of both N4258 and the MW is unscreened:
| (4) |
for any proxy , with . As the MW is required to be screened in any case (both to satisfy independent local tests of gravity and to ensure that the PLR calibrated by Cepheids with parallax is unchanged), this gives the largest possible unscreened fractions and hence the greatest possible reduction in . In e.g. chameleon screening, the threshold value would not be related to or but rather the self-screening parameter of the theory, (e.g. Burrage and Sakstein 2016). For possibly viable values of this, , all the galaxies in our sample would self-screen (see also Sec. V). Thus while our assumptions suffice to give a proof of principle of the effectiveness of our mechanism at altering constraints, further modelling may be required for a fully satisfactory solution within the context of a given theory. For the case of we set kpc-3, the local dark matter density Read 2014; de Salas et al. 2019.77 7 An alternative estimate of from Gaia suggests a slightly higher value of kpc-3 Buch et al. 2019. However, we also require the bulk of the observed Cepheids in the MW to be screened so that they calibrate the Newtonian PLR. The most distant such Cepheids are 1.5 further from the galactic centre than the Sun Riess et al. 2018, so assuming within this region suggests that we need kpc-3 to screen them all.
For simplicity we assume that all unscreened Cepheids have a fixed value of , independently of . Note that in general may be an increasing function of the difference between a galaxy’s proxy value and that of the MW or N4258, and may be expected to transition smoothly between screened and unscreened regimes rather than discretely. As the proxy values for the MW and N4258 are determined simultaneously with those of the other galaxies, these assumptions enable us to determine for each Cepheid for each Monte Carlo model realisation. We now describe how to propagate this information into .
III.2 model and sampling methods
III.2.1 Cepheid distances
The first step is to determine new constraints on the distances to the extragalactic Cepheid hosts. In the absence of information to the contrary we assume that in the CDM case each Cepheid in galaxy implies the same distance to the galaxy, , so that the overall inferred distance . Under a fifth force model the Cepheid distances are altered to , as we quantify below, so that the true galaxy distances are an average over the distances implied by each of the individual Cepheids, weighted by the inverse square of their magnitude uncertainties (period uncertainties are subdominant and not quoted in R16). This ensures that galaxies with smaller measurement uncertainties contribute more to than those whose properties are less well known.
| (5) |
where is the enhancement to Newton’s constant experienced by the Cepheid, is the Cepheid’s true luminosity and is that inferred from a Newtonian analysis. The distance to the Cepheid is determined by , where the measured flux, and is therefore increased according to
| (6) |
where we define as the total factor by which the distance is changed. To account for the possible variation in the – relation due to varying (Sec. II.2), for each Monte Carlo realisation of our model we separately assign each Cepheid a chance of being observed at second or third crossing and an equal probability of having an integer mass in the range –, and adopt the corresponding value from Table 1. This effectively marginalises over our ignorance of these properties and propagates the corresponding uncertainties into the distance estimates. As can be seen from Eq. (6) and Fig. 1 (right), shifts the unscreened PLR in the same direction as the reduction in period () and hence amplifies the overall bias in the inferred distances. We remind the reader that the -dependence of the Cepheid magnitude is likely not to be present in chameleon and similar models that screen the Solar System, since rapidly reverts to inside a Cepheid’s core. This corresponds to .
Combining the contributions from all Cepheids in a galaxy, weighted by their uncertainties, the distance to a given host is modified according to
| (7) |
The fractional scatter among the distance estimates of the individual Cepheids is given by
| (8) |
We estimate the uncertainty on by summing in quadrature with the fractional uncertainty on :
| (9) |
and are calculated from the independent, Cepheid-only distance moduli listed in R16 table 5.88 8 Note that this always yields a larger fractional uncertainty on than , since the assumption that all the Cepheids in the galaxy yield the same distance in CDM requires that the dispersion can only increase when the distances are modified. In reality the dispersion may instead be reduced. is however only nonzero when Cepheids within the same galaxy can have different , which is only the case for the baryon–dark matter interaction model with screening governed by . Even then it is typically small relative to , and our conclusions are unaffected by removing the and fixing the fractional distance uncertainties.
III.2.2 Supernova calibration
To propagate the distance estimates into a constraint on , the absolute SN magnitudes are calibrated for galaxies with both SNe and Cepheid distances, and then the SN magnitude–redshift relation is extended to greater distance with a cosmological SN sample. We adopt a similar philosophy for treating this part of the distance ladder. The Newtonian () distances imply the SN absolute magnitudes quoted in R16, which, combined with the improved measurement of MW Cepheid parallaxes from Gaia in R18 and additional LMC Cepheids in R19, imply km/s/Mpc. is calculated according to (R11, R16)
| (10) |
where is the normalization of the magnitude–redshift relation of the cosmological SN sample, for which we retain the R16 value . Writing this in terms of the apparent magnitude and galaxy distance, the true value implied by galaxy is
| (11) |
III.2.3 Overall inferred
Combining the modification in Eq. (11) over all the galaxies in the sample yields a new best-fit estimate for
| (12) |
where is the fractional uncertainty in the estimate of galaxy derived by propagating uncertainties in Eq. (11). This differs between the R19 inference and ours according to the best-fit distances to the galaxies and their uncertainties:
| (13) |
We estimate the uncertainty in the overall as
| (14) |
This formula modifies the fractional uncertainty on according to the variance in the estimated values among the galaxies, derived from propagating errors in Eq. (12). Note that since , the second term within the square root is always positive and hence the fractional error on is increased by the addition of partial screening. We emphasise that our easing of the tension is nevertheless driven by changes to the mean, rather than to the uncertainty.
Finally, we note that there may be uncertainty in the values themselves due to uncertainty in the proxies that determine whether or not an object is screened. We propagate this into our constraint by performing 10,000 random Monte Carlo draws from the probability distributions describing the proxy for a given model (Sec. III.1), in each case calculating and according to Eqs. (6)-(14). We estimate the true for this model realisation by scattering by . The set of 10,000 values thereby obtained describes the posterior for this model, accounting fully for all sources of uncertainty. We summarise this posterior by its mode , standard deviation and minimal (asymmetric) interval enclosing of the model realisations. We use the latter to calculate separate upper and lower uncertainties on , , to account for non-Gaussianity in the posterior. We also combine and the uncertainty into an overall discrepancy with Planck in order to quantify the ability of a given screening model to reduce the tension. For consistency with literature estimates of the discrepancy in other models, and for simplicity, we calculate this using the symmetrised errorbar :
| (15) |
where km s-1 Mpc-1 and km s-1 Mpc-1. This is to be compared with in the CDM case .
IV Results
In this section we show the screening properties of the R16 Cepheids and their hosts, describe consistency tests within the distance ladder data that limit the possible strength of a fifth force, and quantify the change in best-fit within our formalism.
IV.1 Screening properties of Cepheids and their hosts
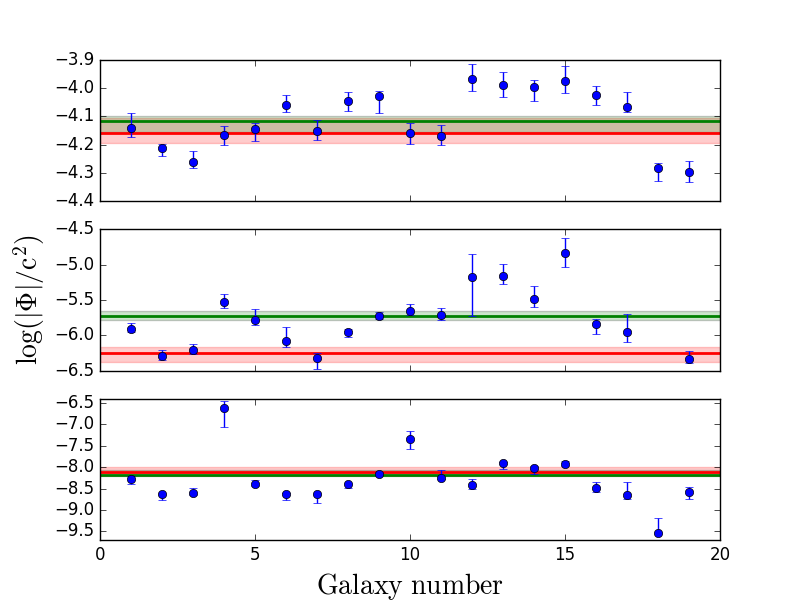
In Fig. 3 we show the proxy values over all the galaxies as determined by the procedure of Sec. III. The errorbars show the minimal width enclosing of the model realisations, the red line with shaded errorbar shows the value for the MW and the green line the value for N4258. Only galaxies below both the red and green lines have the potential for being unscreened if one requires that both the MW and N4258 Cepheids calibrate the Newtonian or screened PLR. We see that the MW is in almost all cases harder to screen than N4258, and hence it is this galaxy that effectively sets the threshold. The properties themselves are listed in tables in Appendix A.
Fig. 4 shows the distribution of dark matter densities at the positions of the Cepheids in each of the extragalactic hosts separately. The red line gives the dark matter density at the position of the Sun Read 2014, which we take to be the screening threshold in the model: all Cepheids to the left of this line are therefore considered unscreened.
In the first column of Table 4 (Appendix A) we show the unscreened fraction of Cepheids corresponding to each of the proxies.99 9 Note that in models where Cepheids do not screen differentially within a galaxy (all proxies except ), the galaxies are simply weighted by the number of Cepheids they contain in calculating this fraction. This shows the MW to be typical in the full set of Cepheid hosts but somewhat less dense (or in a less dense environment) than the average, so that when the MW is screened typical unscreened fractions are 30%. The largest unscreened fraction is obtained for , indicating that the immediate ( Mpc) environment of the MW is more dense than that of the majority of the other hosts, and vice versa for models based on the luminosity or mass estimated through hydrogen gas ( and ). A relatively high unscreened fraction is also achieved when segregating the Cepheids by the local dark matter density. As expected, the larger the unscreened fraction the greater the effect on for given . That there is little scatter in the relation indicates that the total number of unscreened Cepheids is the most important quantity for setting the bias, while which those Cepheids are is secondary. Thus the precise mechanism of screening is not particularly important; what matters is mainly the fraction of Cepheids in extragalactic hosts that feel the fifth force.



IV.2 The viable range of : Consistency tests within the distance ladder
Before showing results for the impact of our fifth force models on , we describe three ways in which they may be constrained by distance ladder data. This will indicate the maximum viable values of , which we find to be 0.15 for models that only unscreen Cepheid envelopes, and 0.04 for models that unscreen Cepheid cores as well.
Our principal test compares distance estimates to the same galaxy by means of the Cepheid PLR vs tip-of-the-red-giant-branch (TRGB) luminosity. As we have seen, unscreening Cepheids results in the standard analysis underestimating the distances to their hosts. Further, as shown by means of numerical simulation in Sakstein et al. 2019, at the hydrogen-burning shell that sources the TRGB radiation becomes unscreened, reducing its luminosity. This causes their distance to be overestimated. Combining eqs. 40 and 41 of Sakstein et al. 2019, we find that the TRGB distance modification for general degree of screening is well-fit by
| (16) |
where is the conventional result assuming General Relativity (GR). The Cepheid and TRGB modifications act in opposite directions, which means that in the presence of a screened fifth force the two distance estimates would be expected to systematically disagree, with TRGB normalised higher. We calculate the constraints this imposes on by updating the analysis of Jain et al. 2013 with the latest data from the Nasa Extragalactic Distance Database (NED-D)1010 10 https://ned.ipac.caltech.edu/Library/Distances/. Steer et al. 2016, and generalising from the specific case of chameleons considered in that work. We find 51 galaxies out to 35 Mpc with both Cepheid and TRGB distance estimates. For each one, we calculate the uncertainty-weighted average Cepheid and TRGB distance, and hence the fractional difference and corresponding uncertainty . This is to be compared to the expectation from Eqs. (6) and (16):
| (17) | ||||
where and again encode the contributions to the distance modification from unscreening the Cepheid envelope and core respectively, and angle brackets denote theoretical expectation at given . We perform the inference with a standard Gaussian likelihood
| (18) |
where , and is an additional noise term accounting for astrophysical contributions to the variance in not captured by the measurement uncertainty. Eq. (17) only gives the expectation for unscreened galaxies however; in screened galaxies we instead have . To keep the test completely general as regards screening mechanism, we assume that a fraction of the 51 galaxies in the sample are unscreened. We randomise which galaxies these are and repeat the inference of 50 times for each in the range , in order to estimate the variance in the result as different galaxies in the sample are unscreened. Marginalising over , which is well-constrained by the variance in among galaxies, we find all posteriors to be consistent with 0. We calculate from these the upper limit on as a function of , assuming either that Cepheids are entirely unscreened (, [a simple average of the values in Table 1]) or that only Cepheid envelopes are unscreened (, ). The results are shown in separate panels of Fig. 5, where the shaded region represents the uncertainty in the upper limit on due to ignorance of which galaxies are unscreened at given . (Note that in principle one could remove this uncertainty by calculating the screening level of each Cepheid and TRGB under a given model.) The dotted lines indicate typical values from the smaller R16 sample (Table 4): for the case we show the result for the screening model (), corresponding to , while for the case we highlight , which yields .
Using the bound on from this test may seem excessively lenient. However, the test is unlikely to be statistically limited because it suffers from a number of potentially significant systematic uncertainties that are difficult to assess. The measurements in NED-D incorporate a diverse range of separate studies with different assumptions for the photometric pipeline, the metallicities of the Cepheids, the intrinsic and external extinction and reddening and the zero-points for calibrating the Cepheid and TRGB distances. In addition, multiple studies may reduce the same data in different ways, so that the listed measurements are not independent. It is beyond the scope of our work to assess the robustness of this test in detail or attempt to mitigate the systematics; we simply note that even the limiting values could be fully allowed were all errors taken into account. Further discussion of these and related issues may be found in Jang et al. 2018; Hatt et al. 2017; Beaton et al. 2018; Beaton et al. 2019; Freedman et al. 2019.


A second test compares the brightnesses of SNe in different galaxies. If SNe are standardizable candles they should all have the same universal absolute magnitude after rescaling the width of the light curve. Separating the galaxies into screened and unscreened subsamples under a given screening model, it should be possible to reconstruct this for each subsample separately by using the appropriate Cepheid distance estimates. The closer the to their true values, the smaller one would expect the difference between the absolute magnitudes of the screened and unscreened SNe to be. We find a clear segregation of the values of screened and unscreened galaxies when for the models in which only Cepheid envelopes are unscreened, and when Cepheids are entirely unscreened: this test is therefore considerably weaker than that using TRGBs described above.1111 11 Note however that the constraints from this test are not sensitive to the unscreened fraction of galaxies in a given model. Hence they may be stronger than those from the TRGB test for proxies producing very low unscreened fractions, e.g. . We have however assumed that the SN luminosity should be the same between screened and unscreened galaxies, i.e. no fifth force effects on the SNe themselves. This is discussed further in Appendix B.
The final test examines the scatter in the PLR. When all Cepheids in a galaxy are unscreened only the normalization of the PLR changes, which is fully degenerate with a change in distance. However, galaxies containing Cepheids with a greater range of degrees of screening, and hence variance in , would be expected to have a larger scatter in their individual period–magnitude relations, as some scatter would derive from misestimation of their individual distances causing a shift in apparent magnitude. “Correcting” this according to the true screening model should then reduce the scatter. We do not find a significant correlation between this scatter and the fraction of unscreened Cepheids across the R16 galaxies in the model (the only model we consider in which Cepheids within a single galaxy may be differently screened), nor do we find individual Cepheids’ magnitude residuals to correlate with their degree of screening. Instead, the average PLR scatter is significantly increased relative to the magnitude uncertainties (due to a bimodality induced between screened and unscreened Cepheids within a given galaxy) when for only Cepheid envelopes unscreened, or for Cepheids entirely unscreened. Taking these as approximate limits, this test is weaker than both those above.
Each of these tests may be improved with future data, and more may be developed by considering other aspects of the distance ladder. For present purposes, however, we take the maximum viable values of from the Cepheid–TRGB distance test.
IV.3 Effect on
Fig. 6 shows for Cepheid cores either unscreened ( in Eq. (6) from Table 1; left) or screened (; right). Unscreening Cepheid cores has the same effect on as increasing by a factor 6. For each model we take the maximum allowed value of from Fig. 5, assuming the same unscreened fraction of galaxies in the R16 sample as the Cepheid–TRGB sample from NED-D. The values themselves are given in Table 4, along with the corresponding values of , and .
Fig. 7 shows the discrepancy for four models—, and both with and without Cepheid luminosity modification—as a function of . These indicate that it is possible to remove the tension by means of screening given a fifth force strength 10% that of gravity when Cepheid luminosities are altered (i.e. their cores are unscreened) and 50-100% of gravity if only their periods are altered. These values are however in tension with the Cepheid vs TRGB distance test of Sec. IV.2, and we dash the lines where this tension exceeds 5. Taking this constraint into account, our models with Cepheid cores unscreened can reduce the tension to 2, while those with Cepheid cores screened reduce it to 3.


V Discussion
In this section we indicate caveats and possible systematics in our proposed resolution to the problem, and suggest ways to develop it further.
By construction, our models screen the MW and hence pass local tests of the equivalence principles, the inverse-square law, and post-Newtonian gravity Adelberger et al. 2003; Sakstein 2018b. Their effects on cosmological observables are however less certain. Chameleon and similar models have little relation to dark energy Wang et al. 2012; Lombriser and Lima 2017, while dark energy theories that screen using the kinetic or Vainshtein mechanisms require parameters such that Cepheids (and galaxies as a whole) are self-screened. Hence our implementation of these models is not cosmological but rather represents an intermediate-scale modification of GR. The baryon–dark matter interaction model Berezhiani et al. 2017 and its screening proxy have not been explored in detail. In Sakstein et al. 2019 we derive the parameterised post-Newtonian (PPN) parameter for this model, finding that it too is dark matter density-dependent. If the MW is screened, tests based on would require data from less dense galaxies.
The parameter space for some of our proxies has already been constrained by prior analyses. For example, thin-shell models (chameleon, symmetron and dilaton) have a threshold in which determines when screening is active. values as low as 0.1 for these theories have been ruled out down to () Mpc Jain et al. 2013; Vikram et al. 2018; Desmond et al. 2019. These constraints impact the viability of screening based on external potential, internal velocity, or galaxy or halo mass. As we require for consistency of the distance ladder and Planck results when Cepheid cores are screened, a resolution of the tension is unlikely feasible within the thin-shell paradigm. Similarly, for kinetic and Vainshtein models the parameters for which stars are unscreened are already ruled out de Rham et al. 2017a; Sakstein 2018b; Sakstein et al. 2017c; Sakstein and Jain 2017, so that our models based on and would be required to invoke similar but not identical mechanisms.
Beyond the MW and N4258, further constraining power on the shape of the PLR derives from independent eclipsing binary distance estimates to M31 and the LMC, which we have not required to be screened. This is partly justified by the fact that N4258 is the most important calibration galaxy because its Cepheids have long periods and are therefore most similar to those in the SN hosts Follin and Knox 2018. M31 was not used as an anchor in R19 as its eclipsing binaries are early-type and therefore suffer from systematics associated with out-of-equilibrium atmospheric physics that are hard to assess. M31 is however at least as massive as the MW; it is therefore just as strongly screened and we expect that its Cepheids could be incorporated straightforwardly into our framework without loss of effectiveness at reducing . There are grounds also for believing the LMC to be a less reliable anchor than N4258: it requires a larger (uncertain) metallicity correction and is somewhat more prone to photometric systematics. It is however significantly less massive than the MW, making it more likely to be unscreened at least under the models based on luminosity and internal velocity. It may also be unscreened under , although the total density including the subhalo’s own mass is of order our threshold screening value of kpc-3 Siffert et al. 2011; van der Marel 2006. Larger-scale environmental proxies are very similar between the LMC and MW since the former lies well within the halo of the latter. Unscreening at least some LMC Cepheids would push the calibrated PLR towards the unscreened relation, reducing the change in . One might therefore expect a lower reconstructed with the LMC as sole distance anchor, which does not appear to be the case in the latest analysis (R19).
affects other observables besides the periods and luminosities of Cepheids, for example their light curves and spectral features. These are well measured and in good agreement with numerical predictions based on GR, and may therefore be used to further constrain the models we consider Marconi et al. 2013. We have also assumed that fifth forces do not significantly affect the other objects that help calibrate the PLR, for example the water maser in N4258 and eclipsing binaries in the LMC and M31. In chameleon (and similar), Vainshtein and kinetic screening models, it is likely that binaries are self-screened, removing any uncertainty. One possible exception in chameleon theories is if at least one of the stars is post-main-sequence. In the case of the dark matter–baryon interaction the effects are not so clear: one would need to extend the one-body computation to the more technical two-body problem Brax and Davis 2018; Kuntz et al. 2019; Brax et al. 2019. If the eclipsing binaries are unscreened becomes in Kepler’s third law, neglect of which results in an overestimate of the sum of the masses and hence of each individual mass. This would overestimate the luminosity, except that the stars themselves are more luminous because of their stronger self-gravity, partially compensating for this effect. A full modelling of these effects is left for future work. It may also be fruitful to compare the Cepheid results with those from other variable stars such as Miras Huang et al. 2018, which have different internal and environmental gravitational properties and may therefore experience different degrees of screening. This could provide constraints as powerful as those of the TRGB test of Sec. IV.2. The most general test may be to compare the masses of stars derived through dynamical, Hertzsprung–Russell and surface gravity methods: different dependences on would lead to systematic biases that correlate with environment.
The models could also be tested with other aspects of distance ladder data. For example, a given model predicts whether particular Cepheids are more likely to scatter above or below the PLR as a function of their screening properties. Subsets of the data may therefore be formed which differ in screening while being alike in other ways, and these would be expected to trace different PLRs and hence give systematically different results for . This would enable further development of consistency tests along the lines of those in Sec. IV.2. It would also be useful to investigate the systematic uncertainties associated with the Cepheid–TRGB distance test that we have used to bound . This would reveal whether our limits are overly lenient so that our constraints are over-optimistic, or conversely whether even larger values are allowed.
Our phenomenological approach has been to lay out a range of quantities describing the strength of the gravitational field in and around the R16 Cepheids that may govern their screening behaviour. For given fifth force strength, the quantity most important for determining the resulting effect on is the fraction of Cepheids a given proxy leaves unscreened. In our formalism this is the fraction in “weaker fields” than the Solar System. It would therefore be helpful to formulate new models in which the onset of screening is governed by a variable maximally different between the MW and N4258 (and the LMC and M31), on the one hand, and the remainder of the sample on the other. The best property that we have discovered so far in this respect is (the potential due to the immediate 0.5 Mpc environment), followed by the local dark matter density.
An assumption of all the present models is that the sources of screening contribute isotropically: this could be broken to allow for more complex dependence of degree of screening on environment, widening the parameter space in which to search for differences between the galaxies. One possibility is to construct models in which the threshold for screening is itself environment-dependent. This could happen for example in theories with several stable minima for the scalar, such as radiatively stable symmetrons Burrage et al. 2016 or supersymmetric models Brax et al. 2013a; Brax et al. 2013b. Another is to incorporate a nontrivial geometry-dependence of the screening thresholds Burrage et al. 2015; Bloomfield et al. 2015; Falck et al. 2014. Investigating this possibility would require designing anisotropic environmental proxies such as the tidal field or higher moments of the potential, which may be aided by constrained simulations in modified gravity Shao et al. 2019.
Finally, while we have opted simply to modify the R19 results according to the -dependence of Cepheid properties, the analysis would ideally be performed by forward-modelling within a complete and self-consistent Bayesian likelihood framework. This would provide a more precise determination of the effect of fifth force parameters on the posterior and allow the degeneracies between those parameters and other degrees of freedom in the analysis to be mapped out. It would however require a more thorough treatment of the likelihood function than is given here, in addition to more careful consideration of the metallicity dependence, outlier behaviour and potential nonlinearity of the PLR Ngeow and Kanbur 2005; Becker et al. 2015; Kodric et al. 2015. A joint analysis of both CMB and distance ladder data would enable posteriors on fifth force parameters to be derived by requiring a single value to account for both datasets, and quantify the overall increase in likelihood afforded by our models.
VI Conclusion
The tension is perhaps the most pressing problem in cosmology today. In recent years, with additional data and analyses the evidence appears to be mounting that the tension is due to new physics that invalidates direct comparison between low and high redshift probes of within CDM. In this work, we set out to alleviate the tension by questioning the assumption that the physics of Cepheid stars is identical across the galaxies used to build the cosmic distance ladder. In particular, we note that the period–luminosity relation of Cepheids is sensitive to the fifth forces that arise in most models beyond GR-based CDM. The screening mechanisms these models are expected to employ may create a difference between the calibration and cosmological subsets of the distance ladder data, and neglect of this generically biases the local high. That is, the true is lower, closer to the value inferred from the CMB.
We explore phenomenological screening models motivated by the range of mechanisms currently studied in the field. These include scalar–tensor theories of gravity as well as a new mechanism based on baryon–dark matter interactions that makes the effective strength of gravity a function of the local dark matter density Sakstein et al. 2019. Imposing the constraint that the Cepheids used to calibrate the period–luminosity relation are screened, we calculate the expected shift in the posterior as a function of fifth force strength relative to gravity, . This is done by modelling the change in both the Cepheid period and luminosity under a fifth force, then propagating this into the constraints on the host galaxy distances. These distances are combined with apparent magnitudes of SNe to calculate .
Our main results are shown in Figs. 6 and 7. We find that models that unscreen Cepheids’ cores (and hence raise their luminosities) lower the distance ladder result to at best within 2 of the Planck value (71–72 km s-1 Mpc-1) when . Such a scenario is realised concretely in the baryon–dark matter interaction model. Models that only unscreen Cepheid envelopes (e.g. chameleons) require larger for this level of improvement, although they also evade constraints from MW stars more readily since stellar evolution is much less altered. We derive relatively strong (but possibly systematics-prone) bounds on fifth force strength in our models by comparing Cepheid and TRGB distance estimates, and weaker bounds from the universality of and intrinsic PLR scatter, but conclude that there remains a viable region of screening parameter space that can reduce the Hubble tension to . This requires Cepheid cores to be unscreened. Our models are no doubt further testable with data spanning various stages of stellar evolution, following earlier studies of distance indicators such as Jain et al. 2013. We study fifth force effects on SNe in Appendix B.
A more complete resolution along these lines will require further work on the inference methodology. The full likelihood analysis should be repeated within specific candidate theories to better constrain fifth force parameters and map out their degeneracies with other degrees of freedom. A more thorough investigation of consistency tests internal to the distance ladder is also warranted, for example the scatter in individual galaxies’ Cepheid period–magnitude relations. The effects of fifth forces on alternative inference methods, such as the TRGB-calibrated distance ladder and strong lensing time delays, need to be studied. Should the baryon–dark matter interaction model remain of interest, its predictions not only for astrophysical objects but also for cosmology must be investigated. Better than Cepheid compatibility with Planck will require a qualitatively different screening mechanism than those currently under investigation, and theoretical developments may supply further insight in this regard. We conclude that there is much to explore on the implications of expansion rate measurements for local fundamental physics.
Acknowledgements: We are grateful for discussions with Koushik Sen, Radek Smolec and the wider MESA community for answering our various MESA-related questions. We thank Eric Baxter, Rachael Beaton, Cullen Blake, Ryosuke Hirai, Mike Jarvis, Justin Khoury, Lucas Macri, Helena Sanchez and Dan Scolnic for useful discussions. HD is supported by St John’s College, Oxford, and acknowledges financial support from ERC Grant No. 693024 and the Beecroft Trust. BJ is supported in part by the US Department of Energy Grant No. DE-SC0007901 and by NASA ATP Grant No. NNH17ZDA001N. JS is supported by funds made available to the Center for Particle Cosmology by the University of Pennsylvania.
References
- Riess et al. (2016) A. G. Riess et al., Astrophys. J. 826, 56 (2016), arXiv:1604.01424 [astro-ph.CO] .
- Riess et al. (2018) A. G. Riess et al., Astrophys. J. 861, 126 (2018), arXiv:1804.10655 [astro-ph.CO] .
- Riess et al. (2019) A. G. Riess, S. Casertano, W. Yuan, L. M. Macri, and D. Scolnic, Astrophys. J. 876, 85 (2019), arXiv:1903.07603 [astro-ph.CO] .
- Aghanim et al. (2018) N. Aghanim et al. (Planck), (2018), arXiv:1807.06209 [astro-ph.CO] .
- Wong et al. (2019) K. C. Wong et al., (2019), arXiv:1907.04869 [astro-ph.CO] .
- Addison et al. (2018) G. E. Addison, D. J. Watts, C. L. Bennett, M. Halpern, G. Hinshaw, and J. L. Weiland, Astrophys. J. 853, 119 (2018), arXiv:1707.06547 [astro-ph.CO] .
- Macaulay et al. (2019) E. Macaulay et al. (DES), Mon. Not. Roy. Astron. Soc. 486, 2184 (2019), arXiv:1811.02376 [astro-ph.CO] .
- Cardona et al. (2017) W. Cardona, M. Kunz, and V. Pettorino, JCAP 1703, 056 (2017), arXiv:1611.06088 [astro-ph.CO] .
- Zhang et al. (2017) B. R. Zhang, M. J. Childress, T. M. Davis, N. V. Karpenka, C. Lidman, B. P. Schmidt, and M. Smith, Mon. Not. Roy. Astron. Soc. 471, 2254 (2017), arXiv:1706.07573 [astro-ph.CO] .
- Feeney et al. (2018) S. M. Feeney, D. J. Mortlock, and N. Dalmasso, Mon. Not. Roy. Astron. Soc. 476, 3861 (2018), arXiv:1707.00007 [astro-ph.CO] .
- Bennett et al. (2014) C. L. Bennett, D. Larson, J. L. Weiland, and G. Hinshaw, Astrophys. J. 794, 135 (2014), arXiv:1406.1718 [astro-ph.CO] .
- Spergel et al. (2015) D. N. Spergel, R. Flauger, and R. Hložek, Phys. Rev. D91, 023518 (2015), arXiv:1312.3313 [astro-ph.CO] .
- Efstathiou (2014) G. Efstathiou, Mon. Not. Roy. Astron. Soc. 440, 1138 (2014), arXiv:1311.3461 [astro-ph.CO] .
- Becker et al. (2015) M. R. Becker, H. Desmond, E. Rozo, P. Marshall, and E. S. Rykoff, (2015), arXiv:1507.07523 [astro-ph.CO] .
- Rigault et al. (2015) M. Rigault et al., Astrophys. J. 802, 20 (2015), arXiv:1412.6501 [astro-ph.CO] .
- Benedict et al. (2007) G. F. Benedict, B. E. McArthur, M. W. Feast, T. G. Barnes, T. E. Harrison, R. J. Patterson, J. W. Menzies, J. L. Bean, and W. L. Freedman, Astron. J. 133, 1810 (2007), [Erratum: Astron. J.133,2980(2007)], arXiv:astro-ph/0612465 [astro-ph] .
- Shanks et al. (2019) T. Shanks, L. Hogarth, and N. Metcalfe, Mon. Not. Roy. Astron. Soc. 484, L64 (2019), arXiv:1810.02595 [astro-ph.CO] .
- Fitzpatrick et al. (2000) E. L. Fitzpatrick, I. Ribas, E. F. Guinan, L. E. DeWarf, F. P. Maloney, and D. Massa, (2000), arXiv:astro-ph/0010526 [astro-ph] .
- Humphreys et al. (2013) E. M. L. Humphreys, M. J. Reid, J. M. Moran, L. J. Greenhill, and A. L. Argon, Astrophys. J. 775, 13 (2013), arXiv:1307.6031 [astro-ph.CO] .
- Wojtak et al. (2014) R. Wojtak, A. Knebe, W. A. Watson, I. T. Iliev, S. Heß, D. Rapetti, G. Yepes, and S. Gottlöber, Mon. Not. Roy. Astron. Soc. 438, 1805 (2014), arXiv:1312.0276 [astro-ph.CO] .
- Kenworthy et al. (2019) W. D. Kenworthy, D. Scolnic, and A. Riess, Astrophys. J. 875, 145 (2019), arXiv:1901.08681 [astro-ph.CO] .
- Lin et al. (2019) M.-X. Lin, M. Raveri, and W. Hu, Phys. Rev. D99, 043514 (2019), arXiv:1810.02333 [astro-ph.CO] .
- Chiang and Slosar (2018) C.-T. Chiang and A. Slosar, (2018), arXiv:1811.03624 [astro-ph.CO] .
- Wyman et al. (2014) M. Wyman, D. H. Rudd, R. A. Vanderveld, and W. Hu, Phys. Rev. Lett. 112, 051302 (2014), arXiv:1307.7715 [astro-ph.CO] .
- Aubourg et al. (2015) E. Aubourg et al., Phys. Rev. D92, 123516 (2015), arXiv:1411.1074 [astro-ph.CO] .
- Hinshaw et al. (2013) G. Hinshaw, D. Larson, E. Komatsu, D. N. Spergel, C. L. Bennett, J. Dunkley, M. R. Nolta, M. Halpern, R. S. Hill, N. Odegard, L. Page, K. M. Smith, J. L. Weiland, B. Gold, N. Jarosik, A. Kogut, M. Limon, S. S. Meyer, G. S. Tucker, E. Wollack, and E. L. Wright, Astrophysical Journal, Supplement 208, 19 (2013), arXiv:1212.5226 [astro-ph.CO] .
- Ade et al. (2016) P. A. R. Ade et al. (Planck), Astron. Astrophys. 594, A13 (2016), arXiv:1502.01589 [astro-ph.CO] .
- Steigman (2012) G. Steigman, Adv. High Energy Phys. 2012, 268321 (2012), arXiv:1208.0032 [hep-ph] .
- Karwal and Kamionkowski (2016) T. Karwal and M. Kamionkowski, Phys. Rev. D94, 103523 (2016), arXiv:1608.01309 [astro-ph.CO] .
- Poulin et al. (2019) V. Poulin, T. L. Smith, T. Karwal, and M. Kamionkowski, Phys. Rev. Lett. 122, 221301 (2019), arXiv:1811.04083 [astro-ph.CO] .
- Kaloper (2019) N. Kaloper, (2019), arXiv:1903.11676 [hep-th] .
- Pourtsidou and Tram (2016) A. Pourtsidou and T. Tram, Phys. Rev. D94, 043518 (2016), arXiv:1604.04222 [astro-ph.CO] .
- Agrawal et al. (2019a) P. Agrawal, G. Obied, and C. Vafa, (2019a), arXiv:1906.08261 [astro-ph.CO] .
- Agrawal et al. (2019b) P. Agrawal, F.-Y. Cyr-Racine, D. Pinner, and L. Randall, (2019b), arXiv:1904.01016 [astro-ph.CO] .
- Berezhiani et al. (2015) Z. Berezhiani, A. D. Dolgov, and I. I. Tkachev, Phys. Rev. D92, 061303 (2015), arXiv:1505.03644 [astro-ph.CO] .
- Bringmann et al. (2018) T. Bringmann, F. Kahlhoefer, K. Schmidt-Hoberg, and P. Walia, Phys. Rev. D98, 023543 (2018), arXiv:1803.03644 [astro-ph.CO] .
- Pandey et al. (2019) K. L. Pandey, T. Karwal, and S. Das, (2019), arXiv:1902.10636 [astro-ph.CO] .
- Vattis et al. (2019) K. Vattis, S. M. Koushiappas, and A. Loeb, Phys. Rev. D99, 121302 (2019), arXiv:1903.06220 [astro-ph.CO] .
- Bernal et al. (2016) J. L. Bernal, L. Verde, and A. G. Riess, JCAP 1610, 019 (2016), arXiv:1607.05617 [astro-ph.CO] .
- Alam et al. (2017) S. Alam et al. (BOSS), Mon. Not. Roy. Astron. Soc. 470, 2617 (2017), arXiv:1607.03155 [astro-ph.CO] .
- Clifton et al. (2012) T. Clifton, P. G. Ferreira, A. Padilla, and C. Skordis, Phys. Rept. 513, 1 (2012), arXiv:1106.2476 [astro-ph.CO] .
- Koyama (2016) K. Koyama, Rept. Prog. Phys. 79, 046902 (2016), arXiv:1504.04623 [astro-ph.CO] .
- Burrage and Sakstein (2018) C. Burrage and J. Sakstein, Living Rev. Rel. 21, 1 (2018), arXiv:1709.09071 [astro-ph.CO] .
- Sakstein (2018a) J. Sakstein, Int. J. Mod. Phys. D27, 1848008 (2018a).
- Heckman et al. (2019) J. J. Heckman, C. Lawrie, L. Lin, J. Sakstein, and G. Zoccarato, (2019), arXiv:1901.10489 [hep-th] .
- Khoury (2010) J. Khoury, (2010), arXiv:1011.5909 [astro-ph.CO] .
- Jain and Khoury (2010) B. Jain and J. Khoury, Annals Phys. 325, 1479 (2010), arXiv:1004.3294 [astro-ph.CO] .
- Joyce et al. (2015) A. Joyce, B. Jain, J. Khoury, and M. Trodden, Phys. Rept. 568, 1 (2015), arXiv:1407.0059 [astro-ph.CO] .
- Burrage and Sakstein (2016) C. Burrage and J. Sakstein, JCAP 1611, 045 (2016), arXiv:1609.01192 [astro-ph.CO] .
- Ishak (2019) M. Ishak, Living Rev. Rel. 22, 1 (2019), arXiv:1806.10122 [astro-ph.CO] .
- Copeland et al. (2006) E. J. Copeland, M. Sami, and S. Tsujikawa, Int. J. Mod. Phys. D15, 1753 (2006), arXiv:hep-th/0603057 [hep-th] .
- Davis et al. (2012) A.-C. Davis, E. A. Lim, J. Sakstein, and D. Shaw, Phys. Rev. D85, 123006 (2012), arXiv:1102.5278 [astro-ph.CO] .
- Jain et al. (2013) B. Jain, V. Vikram, and J. Sakstein, Astrophys. J. 779, 39 (2013), arXiv:1204.6044 [astro-ph.CO] .
- Vikram et al. (2018) V. Vikram, J. Sakstein, C. Davis, and A. Neil, Phys. Rev. D97, 104055 (2018), arXiv:1407.6044 [astro-ph.CO] .
- Koyama and Sakstein (2015) K. Koyama and J. Sakstein, Phys. Rev. D91, 124066 (2015), arXiv:1502.06872 [astro-ph.CO] .
- Sakstein (2015a) J. Sakstein, Phys. Rev. Lett. 115, 201101 (2015a), arXiv:1510.05964 [astro-ph.CO] .
- Sakstein (2015b) J. Sakstein, Phys. Rev. D92, 124045 (2015b), arXiv:1511.01685 [astro-ph.CO] .
- Sakstein et al. (2017a) J. Sakstein, M. Kenna-Allison, and K. Koyama, JCAP 1703, 007 (2017a), arXiv:1611.01062 [gr-qc] .
- Babichev et al. (2016) E. Babichev, K. Koyama, D. Langlois, R. Saito, and J. Sakstein, Class. Quant. Grav. 33, 235014 (2016), arXiv:1606.06627 [gr-qc] .
- Sakstein et al. (2017b) J. Sakstein, E. Babichev, K. Koyama, D. Langlois, and R. Saito, Phys. Rev. D95, 064013 (2017b), arXiv:1612.04263 [gr-qc] .
- Sakstein et al. (2016) J. Sakstein, H. Wilcox, D. Bacon, K. Koyama, and R. C. Nichol, JCAP 1607, 019 (2016), arXiv:1603.06368 [astro-ph.CO] .
- Sakstein et al. (2017c) J. Sakstein, B. Jain, J. S. Heyl, and L. Hui, Astrophys. J. 844, L14 (2017c), arXiv:1704.02425 [astro-ph.CO] .
- Sakstein (2018b) J. Sakstein, Phys. Rev. D97, 064028 (2018b), arXiv:1710.03156 [astro-ph.CO] .
- Adhikari et al. (2018) S. Adhikari, J. Sakstein, B. Jain, N. Dalal, and B. Li, JCAP 1811, 033 (2018), arXiv:1806.04302 [astro-ph.CO] .
- Khoury et al. (2018) J. Khoury, J. Sakstein, and A. R. Solomon, JCAP 1808, 024 (2018), arXiv:1805.05937 [hep-th] .
- Burrage (2019) C. Burrage, in International Workshop on Particle Physics at Neutron Sources 2018 (PPNS 2018) Grenoble, France, May 24-26, 2018 (2019) arXiv:1901.01784 [astro-ph.CO] .
- Brax et al. (2018) P. Brax, C. Burrage, and A.-C. Davis, Int. J. Mod. Phys. D27, 1848009 (2018).
- Lombriser and Peñarrubia (2015) L. Lombriser and J. Peñarrubia, Phys. Rev. D91, 084022 (2015), arXiv:1407.7862 [astro-ph.CO] .
- Burrage et al. (2017) C. Burrage, E. J. Copeland, and P. Millington, Phys. Rev. D95, 064050 (2017), [Erratum: Phys. Rev.D95,no.12,129902(2017)], arXiv:1610.07529 [astro-ph.CO] .
- Desmond et al. (2018a) H. Desmond, P. G. Ferreira, G. Lavaux, and J. Jasche, Phys. Rev. D98, 064015 (2018a), arXiv:1807.01482 [astro-ph.CO] .
- Desmond et al. (2018b) H. Desmond, P. G. Ferreira, G. Lavaux, and J. Jasche, Phys. Rev. D98, 083010 (2018b), arXiv:1807.11742 [astro-ph.CO] .
- Naik et al. (2019) A. P. Naik, E. Puchwein, A.-C. Davis, D. Sijacki, and H. Desmond, (2019), 10.1093/mnras/stz2131, arXiv:1905.13330 [astro-ph.CO] .
- Khoury and Weltman (2004a) J. Khoury and A. Weltman, Phys. Rev. Lett. 93, 171104 (2004a), arXiv:astro-ph/0309300 [astro-ph] .
- Khoury and Weltman (2004b) J. Khoury and A. Weltman, Phys. Rev. D69, 044026 (2004b), arXiv:astro-ph/0309411 [astro-ph] .
- Hinterbichler and Khoury (2010) K. Hinterbichler and J. Khoury, Phys. Rev. Lett. 104, 231301 (2010), arXiv:1001.4525 [hep-th] .
- Brax et al. (2010) P. Brax, C. van de Bruck, A.-C. Davis, and D. Shaw, Phys. Rev. D82, 063519 (2010), arXiv:1005.3735 [astro-ph.CO] .
- Babichev et al. (2009) E. Babichev, C. Deffayet, and R. Ziour, Int. J. Mod. Phys. D18, 2147 (2009), arXiv:0905.2943 [hep-th] .
- Vainshtein (1972) A. I. Vainshtein, Phys. Lett. 39B, 393 (1972).
- Sakstein et al. (2019) J. Sakstein, H. Desmond, and B. Jain, (2019), arXiv:1907.03775 [astro-ph.CO] .
- Berezhiani et al. (2017) L. Berezhiani, J. Khoury, and J. Wang, Phys. Rev. D95, 123530 (2017), arXiv:1612.00453 [hep-th] .
- García-Varela et al. (2013) A. García-Varela, B. Sabogal, and M. Ramírez-Tannus, Mon. Not. Roy. Astron. Soc. 431, 2278 (2013), arXiv:1303.0809 [astro-ph.SR] .
- Storm et al. (2011) J. Storm, W. Gieren, P. Fouqué, T. G. Barnes, I. Soszyński, G. Pietrzyński, N. Nardetto, and D. Queloz, Astronomy and Astrophysics 534, A95 (2011), arXiv:1109.2016 [astro-ph.CO] .
- Persson et al. (2004) S. E. Persson, B. F. Madore, W. Krzemiński, W. L. Freedman, M. Roth, and D. C. Murphy, Astronomical Journal 128, 2239 (2004).
- Gieren et al. (1998) W. P. Gieren, P. Fouque, and M. Gomez, Astrophys. J. 496, 17 (1998), arXiv:astro-ph/9710161 [astro-ph] .
- Pietrzyński et al. (2013) G. Pietrzyński et al., Nature 495, 76 (2013), arXiv:1303.2063 [astro-ph.GA] .
- Riess et al. (2009) A. G. Riess, L. Macri, S. Casertano, M. Sosey, H. Lampeitl, H. C. Ferguson, A. V. Filippenko, S. W. Jha, W. Li, R. Chornock, and D. Sarkar, Astrophys. J. 699, 539 (2009), arXiv:0905.0695 [astro-ph.CO] .
- Riess et al. (2011) A. G. Riess, L. Macri, S. Casertano, H. Lampeitl, H. C. Ferguson, A. V. Filippenko, S. W. Jha, W. Li, and R. Chornock, Astrophys. J. 730, 119 (2011), arXiv:1103.2976 [astro-ph.CO] .
- Brax and Valageas (2014) P. Brax and P. Valageas, Phys. Rev. D90, 023508 (2014), arXiv:1403.5424 [astro-ph.CO] .
- de Rham (2014) C. de Rham, Living Rev. Rel. 17, 7 (2014), arXiv:1401.4173 [hep-th] .
- de Rham et al. (2017a) C. de Rham, J. T. Deskins, A. J. Tolley, and S.-Y. Zhou, Rev. Mod. Phys. 89, 025004 (2017a), arXiv:1606.08462 [astro-ph.CO] .
- de Rham et al. (2017b) C. de Rham, S. Melville, A. J. Tolley, and S.-Y. Zhou, JHEP 09, 072 (2017b), arXiv:1702.08577 [hep-th] .
- Sakstein and Trodden (2018) J. Sakstein and M. Trodden, Phys. Rev. D98, 123512 (2018), arXiv:1809.07724 [hep-th] .
- Cox (1980) J. P. Cox, Theory of stellar pulsation (1980).
- Sakstein (2013) J. Sakstein, Phys. Rev. D88, 124013 (2013), arXiv:1309.0495 [astro-ph.CO] .
- Paxton et al. (2011) B. Paxton, L. Bildsten, A. Dotter, F. Herwig, P. Lesaffre, and F. Timmes, Astrophys. J. Suppl. 192, 3 (2011), arXiv:1009.1622 [astro-ph.SR] .
- Paxton et al. (2013) B. Paxton et al., Astrophys. J. Suppl. 208, 4 (2013), arXiv:1301.0319 [astro-ph.SR] .
- Paxton et al. (2015) B. Paxton et al., Astrophys. J. Suppl. 220, 15 (2015), arXiv:1506.03146 [astro-ph.SR] .
- Paxton et al. (2018) B. Paxton et al., Astrophys. J. Suppl. 234, 34 (2018), arXiv:1710.08424 [astro-ph.SR] .
- Desmond et al. (2018c) H. Desmond, P. G. Ferreira, G. Lavaux, and J. Jasche, Mon. Not. Roy. Astron. Soc. 474, 3152 (2018c), arXiv:1705.02420 [astro-ph.GA] .
- Jasche and Lavaux (2019) J. Jasche and G. Lavaux, Astron. Astrophys. 625, A64 (2019), arXiv:1806.11117 [astro-ph.CO] .
- Lavaux and Jasche (2016) G. Lavaux and J. Jasche, Mon. Not. Roy. Astron. Soc. 455, 3169 (2016), arXiv:1509.05040 [astro-ph.CO] .
- Licquia and Newman (2015) T. C. Licquia and J. A. Newman, Astrophys. J. 806, 96 (2015), arXiv:1407.1078 [astro-ph.GA] .
- Karachentsev et al. (2004) I. D. Karachentsev, V. E. Karachentseva, W. K. Huchtmeier, and D. I. Makarov, The Astronomical Journal 127, 2031 (2004).
- Taylor et al. (2016) C. Taylor, M. Boylan-Kolchin, P. Torrey, M. Vogelsberger, and L. Hernquist, Mon. Not. Roy. Astron. Soc. 461, 3483 (2016), arXiv:1510.06409 [astro-ph.CO] .
- Dehnen et al. (2006) W. Dehnen, D. McLaughlin, and J. Sachania, Mon. Not. Roy. Astron. Soc. 369, 1688 (2006), arXiv:astro-ph/0603825 [astro-ph] .
- Eilers et al. (2019) A.-C. Eilers, D. W. Hogg, H.-W. Rix, and M. K. Ness, Astrophys. J. 871, 120 (2019), arXiv:1810.09466 [astro-ph.GA] .
- Xue et al. (2008) X. X. Xue et al. (SDSS), Astrophys. J. 684, 1143 (2008), arXiv:0801.1232 [astro-ph] .
- Lelli et al. (2019) F. Lelli, S. S. McGaugh, J. M. Schombert, H. Desmond, and H. Katz, Mon. Not. Roy. Astron. Soc. 484, 3267 (2019), arXiv:1901.05966 [astro-ph.GA] .
- Kravtsov et al. (2004) A. V. Kravtsov, A. A. Berlind, R. H. Wechsler, A. A. Klypin, S. Gottloeber, B. Allgood, and J. R. Primack, Astrophys. J. 609, 35 (2004), arXiv:astro-ph/0308519 [astro-ph] .
- Conroy et al. (2006) C. Conroy, R. H. Wechsler, and A. V. Kravtsov, Astrophys. J. 647, 201 (2006), arXiv:astro-ph/0512234 [astro-ph] .
- Behroozi et al. (2010) P. S. Behroozi, C. Conroy, and R. H. Wechsler, Astrophys. J. 717, 379 (2010), arXiv:1001.0015 [astro-ph.CO] .
- Moster et al. (2010) B. P. Moster, R. S. Somerville, C. Maulbetsch, F. C. v. d. Bosch, A. V. Maccio’, T. Naab, and L. Oser, Astrophys. J. 710, 903 (2010), arXiv:0903.4682 [astro-ph.CO] .
- Lehmann et al. (2017) B. V. Lehmann, Y.-Y. Mao, M. R. Becker, S. W. Skillman, and R. H. Wechsler, Astrophys. J. 834, 37 (2017), arXiv:1510.05651 [astro-ph.CO] .
- Skillman et al. (2014) S. W. Skillman, M. S. Warren, M. J. Turk, R. H. Wechsler, D. E. Holz, and P. M. Sutter, (2014), arXiv:1407.2600 [astro-ph.CO] .
- Behroozi et al. (2013) P. S. Behroozi, R. H. Wechsler, and H.-Y. Wu, Astrophys. J. 762, 109 (2013), arXiv:1110.4372 [astro-ph.CO] .
- Shi et al. (2015) D. Shi, B. Li, J. Han, L. Gao, and W. A. Hellwing, Mon. Not. Roy. Astron. Soc. 452, 3179 (2015), arXiv:1503.01109 [astro-ph.CO] .
- Bianchi et al. (2013) D. Bianchi, E. Puchwein, V. Springel, and D. Bianchi, Mon. Not. Roy. Astron. Soc. 436, 2672 (2013), arXiv:1307.5065 [astro-ph.CO] .
- Lombriser (2014) L. Lombriser, Annalen Phys. 526, 259 (2014), arXiv:1403.4268 [astro-ph.CO] .
- Cabré et al. (2012) A. Cabré, V. Vikram, G.-B. Zhao, B. Jain, and K. Koyama, Journal of Cosmology and Astro-Particle Physics 2012, 034 (2012), arXiv:1204.6046 [astro-ph.CO] .
- Zhao et al. (2011a) G.-B. Zhao, B. Li, and K. Koyama, Phys. Rev. D83, 044007 (2011a), arXiv:1011.1257 [astro-ph.CO] .
- Zhao et al. (2011b) G.-B. Zhao, B. Li, and K. Koyama, Phys. Rev. Lett. 107, 071303 (2011b), arXiv:1105.0922 [astro-ph.CO] .
- Hu and Sawicki (2007) W. Hu and I. Sawicki, Phys. Rev. D76, 064004 (2007), arXiv:0705.1158 [astro-ph] .
- Read (2014) J. I. Read, J. Phys. G41, 063101 (2014), arXiv:1404.1938 [astro-ph.GA] .
- de Salas et al. (2019) P. F. de Salas, K. Malhan, K. Freese, K. Hattori, and M. Valluri, arXiv e-prints , arXiv:1906.06133 (2019), arXiv:1906.06133 [astro-ph.GA] .
- Buch et al. (2019) J. Buch, S. C. J. Leung, and J. Fan, JCAP 1904, 026 (2019), arXiv:1808.05603 [astro-ph.GA] .
- Steer et al. (2016) I. Steer et al., Astron. J. 153, 37 (2016), arXiv:1612.09263 [astro-ph.CO] .
- Jang et al. (2018) I. S. Jang, D. Hatt, R. L. Beaton, M. G. Lee, W. L. Freedman, B. F. Madore, T. J. Hoyt, A. J. Monson, J. A. Rich, V. Scowcroft, and M. Seibert, Astrophys. J. 852, 60 (2018), arXiv:1703.10616 [astro-ph.GA] .
- Hatt et al. (2017) D. Hatt, R. L. Beaton, W. L. Freedman, B. F. Madore, I.-S. Jang, T. J. Hoyt, M. G. Lee, A. J. Monson, J. A. Rich, V. Scowcroft, and M. Seibert, Astrophys. J. 845, 146 (2017), arXiv:1703.06468 [astro-ph.CO] .
- Beaton et al. (2018) R. L. Beaton, G. Bono, V. F. Braga, M. Dall’Ora, G. Fiorentino, I. S. Jang, C. E. Martínez-Vázquez, N. Matsunaga, M. Monelli, J. R. Neeley, and M. Salaris, arXiv e-prints , arXiv:1808.09191 (2018), arXiv:1808.09191 [astro-ph.GA] .
- Beaton et al. (2019) R. L. Beaton, M. Seibert, D. Hatt, W. L. Freedman, T. J. Hoyt, I. S. Jang, M. G. Lee, B. F. Madore, A. J. Monson, J. R. Neeley, J. A. Rich, and V. Scowcroft, Astrophys. J. 885, 141 (2019), arXiv:1908.06120 [astro-ph.GA] .
- Freedman et al. (2019) W. L. Freedman et al., (2019), 10.3847/1538-4357/ab2f73, arXiv:1907.05922 [astro-ph.CO] .
- Adelberger et al. (2003) E. G. Adelberger, B. R. Heckel, and A. E. Nelson, Ann. Rev. Nucl. Part. Sci. 53, 77 (2003), arXiv:hep-ph/0307284 [hep-ph] .
- Wang et al. (2012) J. Wang, L. Hui, and J. Khoury, Phys. Rev. Lett. 109, 241301 (2012), arXiv:1208.4612 [astro-ph.CO] .
- Lombriser and Lima (2017) L. Lombriser and N. A. Lima, Phys. Lett. B765, 382 (2017), arXiv:1602.07670 [astro-ph.CO] .
- Desmond et al. (2019) H. Desmond, P. G. Ferreira, G. Lavaux, and J. Jasche, Mon. Not. Roy. Astron. Soc. 483, L64 (2019), arXiv:1802.07206 [astro-ph.CO] .
- Sakstein and Jain (2017) J. Sakstein and B. Jain, Phys. Rev. Lett. 119, 251303 (2017), arXiv:1710.05893 [astro-ph.CO] .
- Follin and Knox (2018) B. Follin and L. Knox, Mon. Not. Roy. Astron. Soc. 477, 4534 (2018), arXiv:1707.01175 [astro-ph.CO] .
- Siffert et al. (2011) B. B. Siffert, A. Limone, E. Borriello, G. Longo, and G. Miele, Mon. Not. Roy. Astron. Soc. 410, 2463 (2011), arXiv:1006.5325 [astro-ph.HE] .
- van der Marel (2006) R. P. van der Marel, in The Local Group as an Astrophysical Laboratory, Vol. 17, edited by M. Livio and T. M. Brown (2006) pp. 47–71, arXiv:astro-ph/0404192 [astro-ph] .
- Marconi et al. (2013) M. Marconi et al., Astrophys. J. 768, L6 (2013), arXiv:1304.0860 [astro-ph.SR] .
- Brax and Davis (2018) P. Brax and A.-C. Davis, Phys. Rev. D98, 063531 (2018), arXiv:1809.09844 [gr-qc] .
- Kuntz et al. (2019) A. Kuntz, F. Piazza, and F. Vernizzi, (2019), arXiv:1902.04941 [gr-qc] .
- Brax et al. (2019) P. Brax, A.-C. Davis, and A. Kuntz, Phys. Rev. D99, 124034 (2019), arXiv:1903.03842 [gr-qc] .
- Huang et al. (2018) C. D. Huang et al., Astrophys. J. 857, 67 (2018), arXiv:1801.02711 [astro-ph.CO] .
- Burrage et al. (2016) C. Burrage, E. J. Copeland, and P. Millington, Phys. Rev. Lett. 117, 211102 (2016), arXiv:1604.06051 [gr-qc] .
- Brax et al. (2013a) P. Brax, A.-C. Davis, and J. Sakstein, Phys. Lett. B719, 210 (2013a), arXiv:1212.4392 [hep-th] .
- Brax et al. (2013b) P. Brax, A.-C. Davis, and J. Sakstein, JCAP 1310, 007 (2013b), arXiv:1302.3080 [astro-ph.CO] .
- Burrage et al. (2015) C. Burrage, E. J. Copeland, and J. Stevenson, Phys. Rev. D91, 065030 (2015), arXiv:1412.6373 [hep-th] .
- Bloomfield et al. (2015) J. K. Bloomfield, C. Burrage, and A.-C. Davis, Phys. Rev. D91, 083510 (2015), arXiv:1408.4759 [gr-qc] .
- Falck et al. (2014) B. Falck, K. Koyama, G.-b. Zhao, and B. Li, JCAP 1407, 058 (2014), arXiv:1404.2206 [astro-ph.CO] .
- Shao et al. (2019) S. Shao, B. Li, M. Cautun, H. Wang, and J. Wang, (2019), arXiv:1907.02081 [astro-ph.CO] .
- Ngeow and Kanbur (2005) C.-C. Ngeow and S. Kanbur, Mon. Not. Roy. Astron. Soc. 360, 1033 (2005), arXiv:astro-ph/0504207 [astro-ph] .
- Kodric et al. (2015) M. Kodric, A. Riffeser, S. Seitz, J. Snigula, U. Hopp, C.-H. Lee, C. Goessl, J. Koppenhoefer, R. Bender, and W. Gieren, Astrophys. J. 799, 144 (2015), arXiv:1405.5218 [astro-ph.GA] .
- Garcia-Berro et al. (1999) E. Garcia-Berro, E. Gaztanaga, J. Isern, O. Benvenuto, and L. Althaus, (1999), arXiv:astro-ph/9907440 [astro-ph] .
- Riazuelo and Uzan (2002) A. Riazuelo and J.-P. Uzan, Phys. Rev. D66, 023525 (2002), arXiv:astro-ph/0107386 [astro-ph] .
- Wright and Li (2018) B. S. Wright and B. Li, Phys. Rev. D97, 083505 (2018), arXiv:1710.07018 [astro-ph.CO] .
- Brax et al. (2004) P. Brax, C. van de Bruck, A.-C. Davis, J. Khoury, and A. Weltman, Phys. Rev. D70, 123518 (2004), arXiv:astro-ph/0408415 [astro-ph] .
Appendix A Gravitational properties of Cepheid hosts and effects on
Tables 2 and 3 list the galaxy and halo properties of the R16 sample respectively, determined with the methods of Sec. III.1. We use these as proxies for the degree of screening. Table 4 shows the effects of the models on , and for the maximum allowed at by the Cepheid vs TRGB distance test of Sec. IV.2 (Fig. 5), separately for each model and assuming the same unscreened fraction of galaxies in the R16 and TRGB samples.
| Name | RA/Dec (J2000 °) | /Mpc | /Mpc | ||||||
|---|---|---|---|---|---|---|---|---|---|
| MW | — | 0 | 0 | — | — | -20.60 | 0.50 | 169 | 50 |
| N4258 | 184.74 / 47.30 | 7.54 | 0.20 | — | — | -21.90 | 0.07 | 442 | 5 |
| M101 | 210.80 / 54.35 | 6.71 | 0.14 | -19.39 | 0.13 | -21.30 | 0.20 | 194 | 5 |
| N1015 | 39.55 / -1.32 | 31.58 | 1.18 | -19.05 | 0.15 | -20.89 | 0.24 | 188 | 10 |
| N1309 | 50.53 / -15.40 | 31.96 | 0.81 | -19.33 | 0.13 | -20.80 | 0.20 | 161 | 6 |
| N1365 | 53.40 / -36.14 | 18.26 | 0.48 | -19.39 | 0.14 | -23.00 | 0.20 | 404 | 5 |
| N1448 | 56.13 / -44.64 | 18.29 | 0.38 | -19.11 | 0.13 | -21.99 | 0.23 | 414 | 7 |
| N2442 | 144.10 / -69.53 | 20.05 | 0.49 | -19.24 | 0.15 | -21.90 | 0.20 | 514 | 21 |
| N3021 | 147.74 / 33.55 | 31.59 | 1.31 | -19.54 | 0.15 | -21.20 | 0.20 | 291 | 8 |
| N3370 | 161.77 / 17.27 | 25.97 | 0.59 | -19.16 | 0.13 | -21.20 | 0.20 | 287 | 12 |
| N3447 | 163.36 / 16.78 | 24.08 | 0.48 | -19.21 | 0.13 | -17.90 | 0.20 | 116 | 32 |
| N3972 | 178.94 / 55.32 | 20.77 | 0.67 | -19.10 | 0.14 | -20.68 | 0.18 | 266 | 11 |
| N3982 | 179.12 / 55.13 | 22.25 | 0.71 | -19.51 | 0.13 | -21.14 | 0.10 | 232 | 7 |
| N4038 | 180.47 / -18.87 | 18.11 | 0.93 | -19.06 | 0.16 | -21.84 | 0.19 | 294 | 8 |
| N4424 | 186.80 / 9.42 | 16.44 | 2.21 | -19.53 | 0.31 | -19.20 | 0.20 | 95 | 5 |
| N4536 | 188.61 / 2.19 | 15.18 | 0.37 | -19.29 | 0.14 | -22.97 | 0.20 | 353 | 6 |
| N4639 | 190.72 / 13.26 | 20.25 | 0.66 | -19.11 | 0.14 | -21.32 | 0.07 | 303 | 7 |
| N5584 | 215.60 / -0.39 | 22.76 | 0.48 | -19.09 | 0.12 | -21.00 | 0.20 | 215 | 5 |
| N5917 | 230.39 / -7.38 | 28.35 | 1.33 | -19.26 | 0.15 | -18.70 | 0.20 | 237 | 6 |
| N7250 | 334.57 / 40.56 | 19.94 | 0.72 | -19.20 | 0.14 | -19.60 | 0.20 | 203 | 10 |
| U9391 | 218.65 / 59.34 | 38.35 | 1.11 | -19.45 | 0.13 | -18.50 | 0.20 | 140 | 15 |
| Name | ||||||||
|---|---|---|---|---|---|---|---|---|
| MW | 2.37 | 0.12 | 1.07 | 0.27 | 2.24 | 0.12 | 11.94 | 0.37 |
| N4258 | 2.75 | 0.13 | 0.93 | 0.2 | 2.45 | 0.13 | 13.01 | 0.39 |
| M101 | 2.61 | 0.14 | 0.99 | 0.22 | 2.31 | 0.14 | 12.59 | 0.43 |
| N1015 | 2.54 | 0.13 | 1.01 | 0.23 | 2.24 | 0.13 | 12.39 | 0.38 |
| N1309 | 2.51 | 0.13 | 1.03 | 0.23 | 2.21 | 0.13 | 12.31 | 0.39 |
| N1365 | 3.02 | 0.15 | 0.83 | 0.16 | 2.72 | 0.15 | 13.83 | 0.44 |
| N1448 | 2.76 | 0.14 | 0.93 | 0.20 | 2.46 | 0.14 | 13.04 | 0.43 |
| N2442 | 2.75 | 0.14 | 0.93 | 0.19 | 2.45 | 0.14 | 13.00 | 0.42 |
| N3021 | 2.59 | 0.13 | 1.00 | 0.23 | 2.29 | 0.13 | 12.55 | 0.39 |
| N3370 | 2.59 | 0.13 | 1.00 | 0.22 | 2.29 | 0.13 | 12.52 | 0.39 |
| N3447 | 2.25 | 0.13 | 1.10 | 0.28 | 1.95 | 0.13 | 11.52 | 0.38 |
| N3972 | 2.51 | 0.11 | 1.01 | 0.23 | 2.21 | 0.11 | 12.30 | 0.34 |
| N3982 | 2.59 | 0.12 | 0.99 | 0.23 | 2.29 | 0.12 | 12.53 | 0.35 |
| N4038 | 2.72 | 0.15 | 0.97 | 0.19 | 2.42 | 0.15 | 12.93 | 0.44 |
| N4424 | 2.34 | 0.13 | 1.07 | 0.26 | 2.04 | 0.13 | 11.79 | 0.38 |
| N4536 | 3.00 | 0.16 | 0.86 | 0.17 | 2.70 | 0.16 | 13.77 | 0.48 |
| N4639 | 2.61 | 0.12 | 1.00 | 0.22 | 2.31 | 0.12 | 12.60 | 0.37 |
| N5584 | 2.56 | 0.12 | 1.00 | 0.24 | 2.26 | 0.12 | 12.43 | 0.37 |
| N5917 | 2.30 | 0.13 | 1.08 | 0.29 | 2.00 | 0.13 | 11.66 | 0.38 |
| N7250 | 2.38 | 0.12 | 1.06 | 0.26 | 2.08 | 0.12 | 11.91 | 0.35 |
| U9391 | 2.29 | 0.12 | 1.09 | 0.28 | 1.99 | 0.12 | 11.62 | 0.37 |
| Proxy | Unscr frac | Screening properties | / km s-1 Mpc-1 | / km s-1 Mpc-1 | |||||||
|---|---|---|---|---|---|---|---|---|---|---|---|
| — | — | 0 | 74.0 | 1.4 | 4.4 | ||||||
| 0.85 | 0.09 | 72.4 | 1.4 | 3.3 | |||||||
| 0.08 | 0.22 | 73.4 | 1.5 | 3.9 | |||||||
| 0.30 | 0.14 | 72.8 | 1.5 | 3.5 | |||||||
| 0.31 |
|
|
|
|
| ||||||
| 0.31 |
|
|
|
|
| ||||||
| 0.35 |
|
|
|
|
| ||||||
| 0.39 |
|
|
|
|
| ||||||
| 0.30 |
|
|
|
|
| ||||||
| 0.26 |
|
|
|
|
| ||||||
| 0.12 |
|
|
|
|
| ||||||
| 0.20 |
|
|
|
|
| ||||||
| 0.37 |
|
|
|
|
| ||||||
| 0.45 |
|
|
|
|
| ||||||
| E. U. | 1 | 0.05 | 71.5 | 1.4 | 2.8 |
Appendix B Unscreening supernovae
B.1 Fifth force effects on SNe
Under a fifth force, the Chandrasekhar mass of white dwarfs, the progenitors of SNe, is reduced, resulting in less fuel available for the thermonuclear explosion. The simplest model for the SN luminosity is Garcia-Berro et al. 1999; Riazuelo and Uzan 2002, although this neglects the variation in the mass of Ni56, the primary isotope responsible for the luminosity, as well as the standardisation of with the width of the light curve. Including both of these effects in a full semi-analytic model reverses the trend of the - relation Wright and Li 2018. We model this as
| (19) |
which implies a fifth force induced change of
| (20) |
for the effective Newton’s constant of the SN in question. We set from a linear fit to Wright and Li 2018 fig. 7 (left). This modification is however not present when SNe are screened (as expected in chameleon and similar models, since the potential is at least an order of magnitude higher in white dwarfs than Cepheids), which may be modelled by setting .
B.2 SN effects on
Including the above effects as well as the Cepheid distance modification of Eq. (7), the value implied by a given galaxy is modified to
| (21) | ||||
so that the total including all galaxies is given by
| (22) |
which is the equivalent of Eq. (12) including SNe unscreening.
Because a fifth force acts to reduce SN magnitude, a decrease in the inferred comes about when the calibration SNe are more screened on average than the cosmological SNe, with Eqs. (21)–(22) formally requiring that the former are fully screened and the latter fully unscreened. However, as described in Sec. III we do not model the cosmological SNe explicitly but rather adopt the magnitude–redshift relation already fitted in R16. Hence we cannot explicitly model differences in screening between the two samples, justifying our assumption in the main text that in the absence of further information the calibration and cosmological samples are likely to feel the fifth force on average in the same way, resulting in no further change to (effectively ). For the model, this could be further justified by noting that the average density of halos is roughly constant over cosmic time.
To explore the potential impact of the SN luminosity shift on we also consider two models in which the calibration and cosmological SNe are differently screened. The first uses the proxy and assumes that the cosmological SNe are fully screened while the calibration SNe are unscreened, which effectively corresponds to in Eq. (22). This is less likely a priori than the fiducial case, but increases and gives an indication of the relative importance of the Cepheid and SN effects. We assume in this case that a SN is as unscreened on average as the Cepheids in the galaxy that hosts it. Since the precise locations of the SNe within their host galaxies are unknown, we use the average across the galaxies’ Cepheids as a proxy for : for Cepheids in galaxy . The result is shown in the row of Table 4, where we see that this effect is subdominant to the shift in Cepheid distance and hence that the tension may still be ameliorated with .
The second scenario with nonzero that we consider assumes that all SNe feel the full fifth force, and that screening occurs at low redshift . In this case all Cepheids and the calibration sample of SNe are screened, while the cosmological SNe are unscreened (effectively , ). We dub this model early unscreening (E. U.) and show the result in the final row of Table 4. would be required for to reach the Planck value in this scenario.
Early unscreening is harder to realise theoretically than the other models because screening mechanisms are designed to activate at high density, implying that screening tends to be more efficient at higher redshift. One possibility is to engineer the cosmological dynamics such that the threshold for screening decreases at earlier times. A transition redshift of , which roughly separates the calibration and cosmological SNe, could be achieved in a chameleon-like model if the cosmological field, which sets the screening threshold, is pinned to a large value at early times but begins to roll and track the minimum of the effective potential around the transition redshift so that screening only occurs later on. Such a model would likely require the force mediator to couple preferentially to carbon and oxygen, since a significant coupling to hydrogen and helium would require the field to track its minimum throughout cosmic history. If this is not the case then the masses of these elements would have changed significantly over cosmic history Brax et al. 2004, and the distance to the surface of last scattering would also be altered.