=\AtBeginShipoutBox\AtBeginShipoutBox
Star formation in low-redshift cluster dwarf galaxies2020Star formation in low-redshift cluster dwarf galaxies–References
Abstract
Evolution of galaxies in dense environments can be affected by close encounters with neighbouring galaxies and interactions with the intracluster medium. Dwarf galaxies (dGs) are important as their low mass makes them more susceptible to these effects than giant systems. Combined luminosity functions (LFs) in the - and -band of 15 galaxy clusters were constructed using archival data from the Canada-France-Hawaii Telescope. LFs were measured as a function of cluster-centric radius from stacked cluster data. Marginal evidence was found for an increase in the faint-end slope of the -band LF relative to the -band with increasing cluster-centric radius. The dwarf-to-giant ratio (DGR) was found to increase toward the cluster outskirts, with the -band DGR increasing faster with cluster-centric radius compared to the -band. The dG blue fraction was found to be times larger than the giant galaxy blue fraction over all cluster-centric distance ( level). The central concentration () was used as a proxy to distinguish nucleated versus non-nucleated dGs. The ratio of high- to low- dGs was found to be times greater in the inner cluster region compared to the outskirts ( level). The faint-end slope of the -band LF for the cluster outskirts () is steeper than the SDSS field LF, while the -band LF is marginally steeper at the level. Decrease in the faint-end slope of the - and -band cluster LFs towards the cluster centre is consistent with quenching of star formation via ram pressure stripping and galaxy-galaxy interactions.
Keywords:
galaxies: clusters: general – galaxies: dwarf – galaxies: star formation1 Introduction
Galaxies reside in a wide range of environments, from voids to the centre of massive clusters. Galaxies in clusters differ both morphologically (Dressler 1980; Dressler et al. 1997, e.g.) and in their star formation history compared with field galaxies (Quadri et al. 2012; Darvish et al. 2018, e.g.). The majority of galaxies in present day clusters are passively evolving, with approximately 20 per cent showing evidence of some star formation (Poggianti et al. 2006, e.g.). Based on a sample of 32 low-redshift galaxy clusters () selected from the WINGS (Cava et al. 2009) and OmegaWINGS surveys (Gullieuszik et al. 2015), Paccagnella et al. 2017 found that of cluster galaxies within 1.2 virial radii appear to be post-starburst (Paccagnella et al. 2019, see also).
A typical galaxy cluster contains a passive population of elliptical/S0 galaxies that form a red-sequence ridge-line in the colour-magnitude plane (López-Cruz et al. 2004, e.g.). Blue cloud galaxies occupy the region blueward of the red-sequence, while the colour space between the red-sequence and the blue cloud contains green valley galaxies (Wyder et al. 2007). These galaxies may be in the process of being quenched and moving from the blue cloud into the red-sequence region (Bremer et al. 2018; Belfiore et al. 2018). Conversely, some red-sequence galaxies may have recently had their star formation reignited and are transitioning back to the blue cloud (Coenda et al. 2018; Darvish et al. 2018).
Several mechanisms have been proposed to account for differences between field and cluster galaxies. Ram pressure from the intracluster medium (ICM) acting on galaxies as they move through a cluster, is expected to compress or even completely remove the ISM from individual galaxies (Gunn & Gott 1972; Quilis et al. 2000; Tonnesen et al. 2007). Alternatively, interactions between large neighbouring galaxies (Moore et al. 1996; Moore et al. 1998, galaxy harassment;) could morphologically transform disk galaxies into spheroidals. Galaxy starvation or strangulation (Larson et al. 1980), where inflowing star-forming gas is truncated, will quench star formation once the gas supply is exhausted (Boselli & Gavazzi 2006; Maier et al. 2019, e.g.).
Dwarf galaxies are particularly important for studying environmental effects as their low mass makes them more susceptible to external influences than massive galaxies. Morphologically, Sandage & Binggeli 1984 classified dwarf ellipticals as having a flatter surface brightness profile than giant elliptical galaxies. More recently, S0 galaxies have been classified in parallel with spiral galaxies (Cappellari et al. 2011; Kormendy & Bender 2012). Cappellari et al. 2011 place dwarf ellipticals (which they refer to as dwarf spheroidals) at the end of the S0 sequence, which mirror dwarf irregular galaxies at the end of the spiral sequence.
In the local universe, there are signs of star formation in early-type cluster dwarf galaxies (Caldwell & Rose 1998; Lisker et al. 2006; de Rijcke et al. 2010; Urich et al. 2017, e.g.). For example, Hamraz et al. 2019 used HST ACS photometry of Virgo, Fornax, and Coma clusters to estimate the fraction of early-type dwarf galaxies containing young stellar populations; for the Virgo cluster, for Fornax, and for the Coma cluster.
Barkhouse et al. 2007 combined the luminosity functions (LFs) of 57 low-redshift clusters and found that the faint-end of the LF is sensitive to distance from the cluster centre. The slope of the faint-end is important as it contains information about the relative number of dwarf galaxies in the cluster. Beijersbergen et al. 2002 measured deep LFs for various cluster-centric regions of the Coma cluster. In the outer region of the cluster they found that the faint-end of the -band LF has a steeper slope relative to the -band. One possible explanation for the difference in slope in the cluster outskirts is the presence of a population of star-forming dwarf galaxies.
The spectroscopic measurement of the LF of A85 from Agulli et al. 2016 showed no statistically significant steepening of the faint-end slope for red galaxies from the core to the outskirts of the cluster. The contribution of the faint red galaxy component was found to dominate more at the outer regions of the cluster compared to the central area. The blue, star forming galaxies were found to make up a small fraction of the cluster population at small cluster-centric distances, but are roughly equal in number to red galaxies at the cluster outskirts. For A2151, a spiral-rich cluster, Agulli et al. 2017 found that the faint-end of the spectroscopic LF is independent of cluster-centric distance from the core to the outskirts of the cluster. This study also found a deficit of red dwarf galaxies.
We present Canada-France-Hawaii Telescope (CFHT) - and -band measurements of LFs, blue fractions, dwarf-to-giant ratios (DGRs), and a comparison of the central concentration of individual dwarf galaxies for 15 Abell clusters as a function of cluster-centric radius. Observations and data reduction are described in Section 2, and LFs are presented in Section 3. DGRs and blue fractions are given in Section 4. In Section 5 we describe the morphological properties of dwarf galaxies using the central concentration statistic. Our discussion and conclusions are given in Section 6.
The cosmological parameters of , , and are used throughout this paper.
2 Data Reduction
Data for this study consists of archival observations from the 3.6 metre CFHT imaged with the MegaPrime/MegaCam CCD camera. All clusters have - and -band data available with adequate exposure times to allow sampling of the dwarf galaxy population for our chosen clusters. The adapted redshift range () ensures that cluster dwarf galaxies are spatially sampled out to the virial radius within the one square degree field-of-view of the telescope+detector. A summary of cluster observations is given in Table 1, while a detailed overview of the data reduction process can be found in Rude 2015.
| Cluster | RAa | Deca | Exposure () | Exposure () | Mag Limit () | Mag Limit () | |
|---|---|---|---|---|---|---|---|
| (deg) | (deg) | (s) | (s) | ||||
| A76 | 9.9832 | 6.8486 | 0.041 | 240 | 1200 | 22.7 | 23.9 |
| A98N | 11.6031 | 20.6218 | 0.104 | 2160 | 2160 | 22.5 | 23.8 |
| A98S | 11.6221 | 20.4680 | 0.104 | 2160 | 2160 | 22.5 | 23.8 |
| A350 | 36.2721 | -9.8366 | 0.159 | 2000 | 3000 | 24.3 | 25.2 |
| A351 | 36.3331 | -8.7218 | 0.111 | 2000 | 4200 | 24.3 | 25.2 |
| A362 | 37.9215 | -4.8827 | 0.184 | 2500 | 3000 | 24.3 | 25.2 |
| A655 | 126.3712 | 47.1337 | 0.127 | 2940 | 3320 | 23.8 | 24.7 |
| A795 | 141.0222 | 14.1727 | 0.136 | 2880 | 700 | 23.0 | 24.2 |
| A1920 | 216.8524 | 55.7502 | 0.131 | 4000 | 6000 | 24.3 | 25.2 |
| A1940 | 218.8686 | 55.1312 | 0.140 | 2000 | 3000 | 24.2 | 25.1 |
| A2100 | 234.0773 | 37.6438 | 0.153 | 1600 | 1600 | 24.2 | 24.9 |
| A2107 | 234.9127 | 21.7827 | 0.041 | 600 | 3600 | 23.0 | 24.1 |
| A2147 | 240.5709 | 15.9747 | 0.035 | 600 | 3060 | 23.2 | 24.3 |
| A2199 | 247.1594 | 39.5513 | 0.030 | 1600 | 1600 | 23.9 | 25.0 |
| A2688 | 0.0318 | 15.8342 | 0.151 | 2160 | 2160 | 22.4 | 23.7 |
- a
J2000.0
Data from the CFHT archive were pre-processed via bias-subtraction and flat-fielding. Total exposure times listed in Table 1 are the sum of integration times of individual images. To create a final calibrated image, individual exposures were median combined using the software packages Source Extractor (Bertin & Arnouts 1996), Scamp (Bertin 2006), and SWarp (Bertin et al. 2002). Once final images were produced, the Picture Processing Package (Yee 1991, PPP;) was used to create an object catalogue with measured magnitudes for each cluster image. Object classification was performed using PPP’s built-in object classifier (). Each object was classified by comparing the flux ratio of its inner and outer regions with that of reference stars (Yee 1991).
To minimise filter-selection bias, object detection was performed independently in both the - and -band (Beijersbergen et al. 2002, for a similar procedure see), and the resultant catalogues visually inspected for bogus detections and missed objects. Since a main goal of this study is to look for the effect on star formation as dwarf galaxies fall into the cluster environment, it is important to construct - and -band LFs so that dwarf galaxies detected in the -band but not in the -band are included in the -band LF. Given that for each cluster our -band images are mag deeper than our -band data (see Table 1), our object detection procedure will not have an adverse impact on the construction of our cluster LFs.
Once object detection and cleaning was complete, catalogues were merged together to form a master catalogue. The -band zero points were calibrated using SDSS PSF magnitudes of stars. For the -band, this method resulted in a magnitude offset between SDSS galaxies and our sample. Therefore, the -band was calibrated by comparing CMODEL galaxy magnitudes. The magnitude limit for each image was chosen to be 0.8 mag brighter than the turnover in galaxy counts versus apparent magnitude, or when mag (whichever is brighter), to ensure 100 per cent completeness (see Table 1).
3 Luminosity Functions
LFs were constructed for each cluster by first fitting a straight line to the cluster red-sequence using linear least squares. This fit was generally carried out using galaxies within a radius of 1 Mpc from the cluster centre. In cases where the red-sequence was difficult to discern, a smaller radial cut was used.
A background-corrected rectified colour histogram was computed for each galaxy cluster. The colour of each galaxy was offset to remove the slope of the red-sequence. The dispersion of the red-sequence was determined by fitting a Gaussian function to the colour histogram. The background of each cluster was measured from an area Mpc from the cluster centre using the outskirts of the cluster image. For the lowest redshift clusters, a composite background was made from the backgrounds of the remaining clusters in our sample.
Once the red-sequence was measured, the richness parameter (Rykoff et al. 2012) was calculated using the colour and -band magnitude of each galaxy. This measurement requires an estimate of , which was determined using (from Barkhouse et al. (2007) converted to the SDSS -band), and an evolution and k-correction, which was calculated using GALAXEV (Bruzual & Charlot 2003). Following Rykoff et al. 2012, the richness measurement was computed using a counting radius of 0.9 Mpc, with a correction applied for chip gaps.
For clusters with a measured velocity dispersion (), was determined from (Carlberg et al. 1997). Using the BCES method of Akritas & Bershady 1996, a linear fit between and in logarithmic space yields . This relationship was used to estimate for those clusters without a published (see Fig. 1). The values for and for the cluster sample are tabulated in Table 2.
| Cluster | Slope | Y-Intercept | Reference | ||||
|---|---|---|---|---|---|---|---|
| () | (Mpc) | ||||||
| A76 | 0.074 | Huchra et al. (2010) | |||||
| A98N | 0.093 | a | |||||
| A98S | 0.089 | a | |||||
| A350 | 0.033 | a | |||||
| A351 | 0.080 | Popesso et al. (2007) | |||||
| A362 | 0.102 | a | |||||
| A655 | 0.084 | Popesso et al. (2007) | |||||
| A795 | 0.083 | Rines et al. (2013) | |||||
| A1920 | 0.078 | Tovmassian & Andernach (2012) | |||||
| A1940 | 0.070 | Struble & Rood (1999) | |||||
| A2100 | 0.072 | a | |||||
| A2107 | 0.051 | Oegerle & Hill (2001) | |||||
| A2147 | 0.077 | Barmby & Huchra (1998) | |||||
| A2199 | 0.105 | Oegerle & Hill (2001) | |||||
| A2688 | 0.106 | a |
- a
is calculated using the relationship between and given in Section 3.

A k-correction was applied to each galaxy based on colour following Chilingarian et al. 2010 and Chilingarian & Zolotukhin 2012. All galaxies redward of the red-sequence were excluded. The presence of distant background clusters in the field-of-view of our target clusters will tend to skew the LF, especially at the faint-end where the background cluster galaxy counts will add directly to the LF. To minimise this effect, we exclude galaxies that have a colour redward of the red-sequence for each cluster. Due to the low redshift of our cluster sample, we expect foreground contamination from lower redshift clusters to be minimal. The adopted colour selections were applied equally to both the cluster and associated background fields.
For the composite LF, individual LFs for each cluster were measured and then combined following the procedure in Schechter 1976. The uncertainty for the th magnitude bin of the background-corrected LF was calculated using , where is the number of background-subtracted cluster galaxies, and is the number of expected background galaxies in the cluster. The factor of 1.69 is used to account for the 30 per cent field-to-field variation in the background counts (Barkhouse et al. 2007).
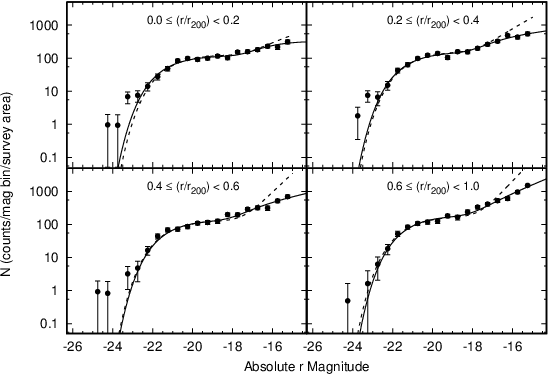
The cluster sample was divided into four annuli based on : , , , and . The LFs were fit using a double Schechter function following the procedure outlined in Barkhouse et al. 2007. The double Schechter function is given by
| (1) |
where . Since there are degeneracies when fitting a double Schechter function, was determined by fitting a single Schechter function to the bright-end with the faint-end slope fixed at .
Non-linear least squares fit results for the -band LFs are shown in Fig. 2 (solid lines), while the fit parameters are given in Table 3. We find a trend that gets brighter by 0.98 mag with increasing cluster-centric radius (significant at the level). In addition, the faint-end slope is 1.7 times steeper in the annulus compared to the region, significant at the level. This may indicate that the dwarf galaxy population is being disrupted in the inner cluster region.
For comparison, the Schechter function fits from Barkhouse et al. 2007 are shown in Fig. 2 (dashed lines). The LF parameters were converted to our adopted cosmology, and a correction was applied to convert Cousins to Sloan (Fukugita et al. 1995). The fits from Barkhouse et al. were normalised to the CFHT data by fitting a scale factor to the bright-end of the LF.
The faint-end LF slopes from Barkhouse et al. are steeper than our values. This discrepancy may be due to differences in cluster samples and background corrections. The sample median redshift for Barkhouse et al. is , while the median redshift for our study is . The two cluster samples are similar in terms of richness when comparing values using the same distance scale.
| Radial Bin | No. of Clusters | |||||
|---|---|---|---|---|---|---|
| 0.80 | 1.39 | 15 | ||||
| 1.35 | 2.05 | 15 | ||||
| 3.41 | 3.58 | 15 | ||||
| 2.17 | 3.74 | 13 | ||||
| 3.73 | 3.37 | 13 |
The -band LFs for the four cluster-centric radial bins are shown in Fig. 3 (solid lines), and the results of the LF fits are given in Table 4. The parameters of the second Schechter function are not well constrained. Due to the relatively bright cutoff of the -band LF used in fitting the parameters, the value of is held fixed as the faint-end slope is the primary parameter of interest. Barkhouse et al. found that the geometric mean of for a sample of 57 Abell clusters, thus the value of was fixed at . The integral of the resulting fit is required to match the total number of galaxies in the magnitude interval being measured.
The -band double Schechter function fits (dashed lines) are compared to the -band after applying a 2.26 magnitude shift (Fig. 3), which is the typical colour of a red-sequence galaxy from our sample at . There is a weak trend in which the faint-end of the -band LF becomes steeper than the -band with increasing cluster-centric radius. Large uncertainties in the fits of the -band faint-end slope prevent us from making any definitive statement regarding the physical significance of such an effect. However, we note that Beijersbergen et al. 2002 found that the -band faint-end slope is steeper than the -band in the outskirts of the Coma cluster. Beijersbergen et al. attributed this result as possibly due to an enhancement of star formation. This would cause faint dwarf galaxies to become brighter in the -band, but be relatively unchanged in the -band, thus yielding an increase in the faint-end slope of the -band LF relative to the -band.


In addition to constructing LFs for the four radial annuli, we also measured the - and -band LF for a cluster-centric distance interval of . These “full” LFs are depicted in Fig. 4 (solid lines) and the fit parameters are tabulated in Table 3 for the -band and Table 4 for the -band. We find that the faint-end slope of the full -band LF is slightly steeper than the -band LF (different at the level).
Comparing our LFs with other studies can be problematic given differences in cluster sample, background correction, filter bandpass, cluster-centric radius coverage, magnitude depth, photometric vs. spectroscopic LFs, etc. To minimise these effects we compared our LF for A2199 with the spectroscopic LF of A2199 from Rines & Geller 2008 by selecting galaxies using the same criteria; cluster-centric radius Mpc, , and excluding the BCG in the LF fit. Fitting a single Schechter function to the -band LF of A2199, we find and . In comparison, Rines & Geller 2008 found and . Due to the agreement between our photometric LF and the spectroscopic LF of A2199, we have confidence that our background correction technique used for constructing LFs is valid.
We compare our full - and -band LFs () with the spectroscopic LF of A85 (, using our distance scale) from Agulli et al. 2016. The faint-end slope of the LF for red galaxies from Agulli et al. yields , while our -band LF has . The difference may be due to sampling out to a greater cluster-centric radius in the Agulli et al. study, where red dwarf galaxies become more dominant compared to the inner cluster region. For blue galaxies Agulli et al. finds , which compares well to our -band LF with . For the spectroscopic LF of A2151 from Agulli et al. 2017, the faint-end slope was found to be for the cluster-centric radius (using our adopted cosmology). This slope is flatter than our -band slope of for the full LF, and can be explained by a deficit of red dwarf galaxies in A2151 as reported by Agulli et al.
Comparing our results with the photometric LF of Coma from Beijersbergen et al. 2002, we find good agreement with the faint-end slope for our full -band LF () and that of Beijersbergen et al. ( for the cluster-centric annulus , using our distance scale). For the -band, Beijersbergen et al. finds for the annulus , while for our full -band LF we have . Since the -band is expected to be more sensitive to recent star formation than the -band (Zhou et al. 2017), we elect to compare our full -band LF with the photometric UV LF from Cortese et al. 2003 for a composite sample of three low-redshift clusters (Virgo, Coma, and A1367). The faint-end slope of the Cortese et al. sample was determined to be , which is in good agreement with our -band LF faint-end slope ().
An additional correction was also applied to study projection effects on the LFs. Assuming a cluster is spherically symmetric, the outer region of the cluster will be projected in front and behind the inner region of the cluster (Beijersbergen et al. 2002; Barkhouse et al. 2007). This effect can be corrected for statistically by subtracting the contribution of the cluster outskirts from the inner cluster region. The resulting deprojected LFs are shown in Figs. 5 and 6. In both cases, the resulting LFs are noticeably shallower at the faint-end than the projected LFs. In order to compare the two deprojected LFs, each LF was fit with a single Schechter function as neither LF shows an upturn of the faint-end slope. The two fits shown in Fig 7 are consistent with each other, which indicates no enhanced star formation in the central region of the clusters.


| Radial Bin | No. of Clusters | |||||
|---|---|---|---|---|---|---|
| 1.82 | 1.63 | 15 | ||||
| 0.83 | 0.77 | 15 | ||||
| 1.17 | 1.41 | 15 | ||||
| 1.52 | 1.96 | 13 | ||||
| 1.30 | 1.10 | 13 |
4 Dwarf-to-Giant Ratio and Blue Fraction
The DGR is used to search for evidence of star formation in a non-parametric way. For the -band, giant galaxies are defined to have , and dwarfs have . Using an offset of 2.26 mag (Section 3), giants in the -band have and dwarfs have . Since observations of Abell 2688 are not deep enough in the -band to sample the dwarf regime, this cluster has been excluded from these measurements. The Abell 2688 background field, however, was used in the estimation of background counts for the lowest redshift clusters. To be consistent with previous measurements, the uncertainty in (galaxy count) is given by (i.e. assuming Poisson statistics). When subtracting galaxy background counts from the cluster galaxy counts, uncertainties are added in quadrature.
The DGR as a function of is shown in Fig. 8 (bottom panel). As expected from the LFs, the -band DGR is marginally larger than the -band in the inner cluster region (16 per cent difference), with both increasing with cluster-centric radius. In the outer region, the difference between the - and -band DGR increases to 28 per cent, consistent with a slight enhancement of star-forming dwarf galaxies. Both - and -band DGRs display a similar trend with cluster-centric radius, being relatively constant in the inner-most region and increasing in the cluster outskirts. This may be a result of dwarf galaxy disruption due to gravitational tidal interactions and the quenching of star formation due to ram-pressure effects since the decline in the DGR is observed in both and filters (Safarzadeh & Scannapieco 2017).
To determine what gives rise to the change in the DGR with cluster-centric radius, we plot separately in Fig. 8 the radial density profile of dwarfs and giants for the -band (middle panel) and -band (top panel). For both panels, the radial density decrease in dwarfs with increasing cluster-centric radius is less than for the giant galaxies. Thus the increase in the DGR toward the cluster outskirts (bottom panel) is due to a larger decrease in the density of giant galaxies compared to dwarf systems.

One factor that may reduce the DGR in the -band relative to the -band is star formation in more luminous dwarf galaxies. A galaxy classified as a dwarf in the -band may be considered a giant in the -band. We explore this effect by plotting in Fig. 9 the ratio of -band to -band detected galaxies. The inner region of the cluster sample contains a similar number of giants detected in both bands, while the outer region has 25 per cent more giants detected in the -band. When comparing dwarfs, the -band has 60 per cent more dwarfs than the -band in the outer region.

To study changes in the dwarf galaxy population as a function of cluster-centric radius, histograms of colour are constructed for the four radial bins used previously. The error for each bin of the histogram is computed using , where and are the uncorrected cluster counts and the expected number of background counts in the th bin, respectively. Dwarf galaxies are selected to be within . The results are shown in Fig. 10.

Comparing the four panels in Fig. 10, the relative size of the blue galaxy population grows relative to the red population with increasing cluster-centric radius. This coincides with the relative increase of the -band relative to the -band DGR. The colour of giant galaxies () for the region does not contain a large population of blue galaxies (Fig. 11).

Galaxies are considered to be part of the blue population if they are blueward of the red-sequence. The blue fraction is given by , where is the number of background-corrected blue galaxies, and is the number of background-corrected red galaxies. The uncertainty in is determined by , where the sum is over all bins blueward of the colour cut. The uncertainty in the number of red galaxies is calculated in a similar fashion.
The resulting dwarf and giant galaxy blue fractions for the four radial bins are depicted in Fig. 12. The blue fraction is greater for the dwarf population compared to giant galaxies by a factor of over all measured cluster-centric distance (significant at level). Both dwarf and giant galaxies undergo an increase in with increasing cluster-centric radius.

5 Morphology
Galaxies within of the red-sequence were characterised according to their -band central concentration. The central concentration parameter () is a ratio of the flux measured using an inner and outer radius of a galaxy. It is determined by the intensity weighted second-order moments and defined as (Abraham et al. 1994; Abraham et al. 1996)
| (2) |
where is the intensity of a pixel in position (, ), () is the inner normalised elliptical radius, and is the outer elliptical radius normalised to 1. The inner radius isolates the flux within the cores of galaxies, and =0.3 has been found empirically to produce the best results (Abraham et al. 1994).


Measurements of the FWHM for stars in each cluster image were used to define a minimum isophotal area for classification. Galaxies having a diameter less than FWHM are considered too small for accurate morphological classification.
The central concentration values for dwarf galaxies () from all 15 clusters were measured. The dwarf galaxies were separated into two, approximately equal samples: low central concentration () and high central concentration ().
Fig. 13 shows the ratio of high- versus low- dwarf galaxies as a function of cluster-centric radius (bottom panel), and the radial density distribution of low- and high- dwarf galaxies (top panel). Uncertainties are calculated assuming Poisson statistics, and are added in quadrature. The central concentration ratio for the inner-most radial bin is 2.1 times greater than the outer-most annuli, significant at the 2.8 level. The radial density profiles indicate that the density of high- dwarf galaxies decreases more rapidly than the low- galaxies with increasing cluster-centric radius.
For this study we associate high- dwarf galaxies with nucleated dwarfs and low- dwarfs with non-nucleated galaxies (van den Bergh 1986, e.g.). Gravitational tidal perturbations in cluster centres are expected to have the greatest effect on non-nucleated, loosely bound low- galaxies compared to more centrally concentrated, high- nucleated systems (Conselice et al. 2001; Eigenthaler & Zeilinger 2010). Thus we expect that the ratio of high- to low- dwarf galaxies would increase towards the cluster centre, as evident in Fig. 13.
Lisker et al. 2007 and Ordenes-Briceño et al. 2018 mapped out the distribution of nucleated and non-nucleated dwarf galaxies in the Virgo and Fornax clusters, respectively. These studies showed that the ratio of nucleated to non-nucleated dwarfs increases toward the cluster centre. These results are consistent with the change in the ratio of high- to low- dwarf galaxies depicted in Fig. 13 for our composite sample of 15 galaxy clusters.
6 Discussion and Conclusions
The faint-end of LFs measured for galaxies in the low-density field environment differs from LFs measured from the outskirts of the cluster region (). Comparison between the LF from the outermost region of our composite cluster sample and the SDSS field LF from Blanton et al. 2005 is shown in Figs. 14 (-band) and 15 (-band). The field LF is based on SDSS DR2 and has been normalised to match the bright-end of the CFHT LF. We use the “raw” field LF from Blanton et al. since it most-closely matches how our galaxies are selected, in contrast to the “corrected” or “total” SDSS field LF. In Figs. 14 and 15 we also compare our cluster LF to the field LF from Montero-Dorta & Prada 2009. Our -band cluster LF is steeper () than the SDSS field LF from Blanton et al. (). For the -band, our cluster LF faint-end slope () is marginally steeper than the Blanton et al. SDSS field LF () at the level.
The similarity of the faint-end slope of the cluster -band LF compared to the SDSS field LF indicates that there is no significant enhancement of star formation as dwarf galaxies fall into the cluster environment from the field. The shallower -band faint-end slope of the field LF compared to the cluster -band LF may imply that star formation in dwarfs is being quenched, ultimately transforming blue, star-forming dwarf galaxies into red, passive systems.
The change in the -band faint-end slope with cluster-centric radius may imply that the survival rate of dwarf galaxies is highest in the outskirts of clusters compared to the inner cluster region. This is expected as dwarf galaxies are likely to be destroyed by gravitational tidal effects and ram pressure stripping in denser environments (Martel et al. 2012; Safarzadeh & Scannapieco 2017; Zinger et al. 2018). Consistent with these results, Thompson & Gregory 1993 found that less centrally concentrated dwarf galaxies (dSph) are absent in the centre of the Coma cluster. Our measurement of an increasing ratio of high- to low- dwarf galaxies with decreasing cluster-centric radius also supports this view.
The -band DGR versus cluster-centric radius for the CFHT clusters increases for . The DGR selected from a sample of 57 low-redshift Abell clusters (Barkhouse et al. 2009) shows a steady increase from the inner to the outer region. Differences in the DGR may indicate systematic differences between estimations of between Barkhouse et al. 2009 and our sample. The richness method used to estimate was different ( vs ), as was the sample of clusters used to generate the relationship between richness and . Both cases, however, indicate a suppression of dwarf galaxies in the inner region of low-redshift clusters. Even if there are systematic differences between the two samples, comparisons within the CFHT data is valid as is calculated in the same way for all CFHT clusters. Additionally, Barkhouse et al. used the -band for their blue filter. The two filters ( and ) may sample different stellar populations and thus the -band may indicate star formation on a different timescale (Larson & Tinsley 1978).
The measured blue fractions of the two studies also differ. While our results show a steady increase in the dwarf blue fraction with increasing radius, Barkhouse et al. found an increase in the dwarf blue fraction at small radii, but a levelling off for . If star formation in infalling dwarf galaxies is being quenched in the outskirts of clusters, it would not show up as quickly in the -band.
The relative location of star formation in a cluster can only be determined if the quenching of star formation occurs over a short time period. Galaxy starvation is effective on timescales of years, where as ram pressure could remove the gas within a disk in years (Quilis et al. 2000), though some simulations show it could take much longer (Tonnesen et al. 2007). The change in the blue fraction and LFs with respect to cluster-centric radii implies quenching timescales years.
Acknowledgements
We thank the anonymous referee for comments that improved this manuscript. We thank Haylee Archer and Madeline Shaft for assistance with the visual inspection of detected objects. CMR and WAB thank the University of North Dakota for financial support through a ND EPSCoR Doctoral Dissertation Assistantship and a Faculty Research Seed Money award. MRS and WAB acknowledge financial support from the Theodore Dunham, Jr. Grant of the Fund for Astrophysical Research. This research has made use of the VizieR catalogue access tool, CD’S, Strasbourg, France. This research made use of the K-corrections Calculator service available at http://kcor.sai.msu.ru/, and GNU Parallel (Tange 2018). Based on observations obtained with MegaPrime/MegaCam, a joint project of CFHT and CEA/DAPNIA, at the Canada-France-Hawaii Telescope (CFHT) which is operated by the National Research Council (NRC) of Canada, the Institut National des Sciences de l’Univers of the Centre National de la Recherche Scientifique of France, and the University of Hawaii.
References
- Abraham et al. (1994) Abraham R. G., Valdes F., Yee H. K. C., van den Bergh S., 1994, ApJ, 432, 75
- Abraham et al. (1996) Abraham R. G., Tanvir N. R., Santiago B. X., Ellis R. S., Glazebrook K., van den Bergh S., 1996, MNRAS, 279, L47
- Agulli et al. (2016) Agulli I., Aguerri J. A. L., Sánchez-Janssen R., Dalla Vecchia C., Diaferio A., Barrena R., Dominguez Palmero L., Yu H., 2016, MNRAS, 458, 1590
- Agulli et al. (2017) Agulli I., Aguerri J. A. L., Diaferio A., Dominguez Palmero L., Sánchez-Janssen R., 2017, MNRAS, 467, 4410
- Akritas & Bershady (1996) Akritas M. G., Bershady M. A., 1996, ApJ, 470. 706
- Barkhouse et al. (2007) Barkhouse W. A., Yee H. K. C., López-Cruz O., 2007, ApJ, 671, 1471
- Barkhouse et al. (2009) Barkhouse W. A., Yee H. K. C., López-Cruz O., 2009, ApJ, 703, 2024
- Barmby & Huchra (1999) Barnby P., Huchra J. P., 1998, AJ, 115, 6
- Beijersbergen et al. (2002) Beijersbergen M., Hoekstra H., van Dokkum P. G., van der Hulst T., 2002, MNRAS, 329, 385
- Belfiore et al. (2018) Belfiore F. et al., 2018, MNRAS, 477, 3014
- Bertin (2006) Bertin E., 2006, in Gabriel C., Arviset C., Ponz D., Enrique S., eds, ASP Conf. Ser. Vol. 351, Astronomical Data Analysis Software and Systems XV. Astron. Soc. Pac., San Francisco, p. 112
- Bertin & Arnouts (1996) Bertin E., Arnouts S., 1996, A&AS, 117, 393
- Bertin et al. (2002) Bertin E., Mellier Y., Radovich M., Missonnier G., Didelon P., Morin B., 2002, in Bohlender D. A., Durand D., Handley T. H., eds, ASP Conf. Ser. Vol. 281, Astronomical Data Analysis Software and Systems XI. Astron. Soc. Pac., San Francisco, p. 228
- Blanton et al. (2005) Blanton M. R., Lupton R. H., Schlegel D. J., Strauss M. A., Brinkmann J., Fukugita M., Loveday J., 2005, ApJ, 631, 208
- Boselli & Gavazzi (2006) Boselli A., Gavazzi G., 2006, PASP, 118, 517
- Bremer et al. (2018) Bremer M. N. et al., 2018, MNRAS, 476, 12
- Bruzual & Charlot (2003) Bruzual G., Charlot S., 2003, MNRAS, 344, 1000
- Caldwell & Rose (1998) Caldwell N., Rose J. A., 1998, AJ, 115, 1423
- Cappellari et al. (2011) Cappellari M. et al., 2011, MNRAS, 416, 1680
- Carlberg et al. (1997) Carlberg R. G., Yee H. K. C., Ellingson E., 1997, ApJ, 478, 462
- Cava et al. (2009) Cava A., et al., 2009, A&A, 495, 707
- Chilingarian & Zolotukhin (2012) Chilingarian I. V., Zolotukhin I. Y., 2012, MNRAS, 419, 1727
- Chilingarian et al. (2010) Chilingarian I. V., Melchior A. L., Zolotukhin I. Y., 2010, MNRAS, 405, 1409
- Coenda et al. (2018) Coenda V., Martínez H. J., Muriel H., 2018, MNRAS, 473, 5617
- Conselice et al. (2001) Conselice C. J., Gallagher J. S., III, Wyse R. F. G., 2001, AJ, 559, 791
- Cortese et al. (2003) Cortese L., Gavazzi, G., Boselli A., Iglesias-Paramo J., Donas J., Milliard B., 2003, A&A, 410, L25
- Darvish et al. (2018) Darvish B., Martin C., Goncalves T. S., Mobasher B., Scoville N. Z., Sobral D., 2018, ApJ, 853, 155
- de Rijcke et al. (2010) de Rijcke S., van Hese E., Buyle P., 2010, ApJ, 724, L171
- Dressler (1980) Dressler A., 1980, ApJ, 236, 351
- Dressler et al. (1997) Dressler A. et al., 1997, ApJ, 490, 577
- Eigenthaler & Zeilinger (2010) Eigenthaler P., Zeilinger W. W., 2010, A&A, 511, 1
- Fukugita et al. (1995) Fukugita M., Shimasaku K., Ichikawa T., 1995, PASP, 107, 945
- Gullieuszik et al. (2015) Gullieuszik M. et al., 2015, A&A, 581, A41
- Gunn & Gott (1972) Gunn J. E., Gott J. R., III, 1972, ApJ, 176, 1
- Hamraz et al. (2019) Hamraz E., Peletier R. F., Khosroshahi H. G., Valentijn E. A., den Brok M., Venhola A., 2019, A&A, 625, A94
- Huchra et al. (2010) Huchra J., Chen J., McNamara B., Mader J., 2010, https://www.cfa.harvard.edu/ dfabricant/huchra/clusters/table.html
- Kormendy & Bender (2012) Kormendy J., Bender R., 2012, ApJS, 198, 2
- Larson & Tinsley (1978) Larson R. B., Tinsley B. M., 1978, ApJ, 219, 46
- Larson et al. (1980) Larson R. B., Tinsley B. M., Caldwell C. N., 1980, ApJ, 237, 692
- Lisker et al. (2006) Lisker T., Glatt K., Westera P., Grebel E. K., 2006, AJ, 132, 2432
- Lisker et al. (2007) Lisker T., Grebel E. K., Glatt K., 2007, ApJ, 660, 1186
- López-Cruz et al. (2004) López-Cruz O., Barkhouse W. A., Yee H. K. C., 2004, ApJ, 614, 679
- Maier et al. (2019) Maier C., Hayashi M., Ziegler B. L., Kodama T., 2019, A&A, 626, 14
- Martel et al. (2012) Martel H., Barai P., Brito W., 2012, ApJ, 757, 48
- Montero-Dorta & Prada (2009) Montero-Dorta A. D., Prada F., 2009, MNRAS, 399, 1106
- Moore et al. (1996) Moore B., Katz N., Lake G., Dressler A., Oemler A., 1996, Nature, 379, 613
- Moore et al. (1998) Moore B., Lake G., Katz N., 1998, ApJ, 495, 139
- Oegerle & Hill (2001) Oegerle W. R., Hill J. M., 2001, AJ, 122, 2858
- Ordenes-Briceño et al. (2018) Ordenes-Briceño Y. et al., 2018, ApJ, 859, 218
- Paccagnella et al. (2017) Paccagnella A. et al., 2017, ApJ, 838, 148
- Paccagnella et al. (2019) Paccagnella A., Vulcani B., Poggianti B. M., Moretti A., Fritz J., Gullieuszik M., Fasano G., 2019, MNRAS, 482, 881
- Poggianti et al. (2006) Poggianti B. M. et al., 2006, ApJ, 642, 188
- Popesso et al. (2007) Popesso P., Biviano A., Böhringer H., Romaniello M., 2007, A&A, 461, 397
- Quadri et al. (2012) Quadri R. F., Williams R. J., Franx M., Hildebrandt H., 2012, ApJ, 744, 88
- Quilis et al. (2000) Quilis V., Moore B., Bower R., 2000, Science, 288, 1617
- Rines & Geller (2008) Rines K., Geller M. J., 2008, AJ, 135, 1837
- Rines et al. (2013) Rines K., Geller M. J., Diaferio A., Kurtz M. J., 2013, ApJ, 767, 15
- Rude (2015) Rude C., 2015, PhD thesis, Department of Physics and Astrophysics, University of North Dakota
- Rykoff et al. (2012) Rykoff E. S. et al., 2012, ApJ, 746, 178
- Safarzadeh & Scannapieco (2017) Safarzadeh M., Scannapieco E., 2017, ApJ, 850, 99
- Sandage & Binggeli (1984) Sandage A., Binggeli B., 1984, AJ, 89, 919
- Schechter (1976) Schechter P., 1976, ApJ, 203, 297
- Struble & Rood (1999) Struble M. F., Rood H. J., 1999, ApJS, 125, 35
- Tange (2018) Tange O., 2018, GNU Parallel 2018, Lulu.com, https://doi.org/10.5281/zenodo.1146014
- Thompson & Gregory (1993) Thompson L. A., Gregory S. A., 1993, AJ, 106, 2197
- Tonnesen et al. (2007) Tonnesen S., Bryan G. L., van Gorkom J. H., 2007, ApJ, 671, 1434
- Tovmassian & Andernach (2012) Tovmassian H. M., Andernach H., 2012, MNRAS, 427, 2047
- Urich et al. (2017) Urich L. et al., 2017, A&A, 606, 135
- van den Bergh (1986) van den Bergh S., 1986, AJ, 91, 271
- Wyder et al. (2007) Wyder T. K. et al., 2007, ApJS, 173, 293
- Yee (1991) Yee H. K. C., 1991, PASP, 103, 396
- Zinger et al. (2018) Zinger E., Dekel A., Kravtsov A. V., Nagai D., 2018, MNRAS, 475, 3654
- Zhou et al. (2017) Zhou Z. et al., 2017, ApJ, 835, 70