SN 2017gmr: An energetic Type II-P supernova with asymmetriesJournal: ApJFacilities: ARIES:ST, ARIES:DFOT, CTIO:PROMPT, Las Cumbres Observatory (FLOYDS, Sinistro), Gemini:Gillett (GNIRS), IRTF (SpeX), Magellan:Baade (FIRE), Magellan:Clay (MIKE), ING:Newton (IDS), NTT (EFOSC2, SOFI), MMT (BCS), Keck:I (HIRES), Beijing:2.16m (BFOSC), NOT (ALFOSC), SOAR (Goodman), Asiago:Copernico (AFOSC), Asiago:Galileo (B&C), VLT:Antu (FORS2), HCT (HFOSC), HET(LRS2), SO:Super-LOTIS, Bok (B&C), Liverpool:2m (IO:O), REM astropy (Astropy Collaboration et al. 2013; The Astropy Collaboration et al. 2018), lcogtsnpipe (Valenti et al. 2016), superbol (Nicholl 2018)
Abstract
We present high-cadence ultraviolet (UV), optical, and near-infrared (NIR) data on the luminous Type II-P supernova SN 2017gmr from hours after discovery through the first 180 days. SN 2017gmr does not show signs of narrow, high-ionization emission lines in the early optical spectra, yet the optical lightcurve evolution suggests that an extra energy source from circumstellar medium (CSM) interaction must be present for at least 2 days after explosion. Modeling of the early lightcurve indicates a 500R☉ progenitor radius, consistent with a rather compact red supergiant, and late-time luminosities indicate up to 0.130 0.026 M☉ of 56Ni are present, if the lightcurve is solely powered by radioactive decay, although the 56Ni mass may be lower if CSM interaction contributes to the post-plateau luminosity. Prominent multi-peaked emission lines of H and [O I] emerge after day 154, as a result of either an asymmetric explosion or asymmetries in the CSM. The lack of narrow lines within the first two days of explosion in the likely presence of CSM interaction may be an example of close, dense, asymmetric CSM that is quickly enveloped by the spherical supernova ejecta.
Keywords:
(stars:) supernovae: individual (SN 2017gmr)I Introduction
Core-collapse supernovae (CCSNe) mark the death of stars more massive than 8 M⊙. Those stars that end their lives with portions of their hydrogen envelope remaining are classified as Type II events (see Arcavi 2017; Gal-Yam 2017; Branch & Wheeler 2017, for detailed reviews). Historically these events have been classified as Type II-P or Type II-L based on their lightcurve shapes. Type II-P (“P” for plateau) show a plateau phase of near constant luminosity in the lightcurve for 2–3 months after maximum light due to the long diffusion and recombination timescales of the hydrogen envelope, while Type II-L (“L” is for linear) shown an almost linear decline with no or short plateau phases. Recent work has suggested that this bi-modal classification is misleading, and in fact Type II SNe form a continuous class (Anderson et al. 2014; Valenti et al. 2016; Galbany et al. 2016). Once the recombination phase ends, a sharp drop in luminosity occurs over a relatively short timescale, until the SN settles into the nebular phase where the lightcurve is powered primarily by radioactive decay.
Pre-explosion Hubble Space Telescope (HST) imaging of Type II-P events point to red supergiant (RSG) stars as the most common progenitors (Van Dyk et al. 2003; Smartt et al. 2009; Smartt et al. 2015). RSGs do not form a homogeneous group, and variations in metallicity, initial mass, and mass-loss histories lead to diversity among the resultant SNe. Adopted mass-loss rates for RSGs generally range from 10-6 to 10-4 M☉ yr-1, with average wind velocities of 10 km s-1 (Mauron & Josselin 2011; Goldman et al. 2017; Beasor & Davies 2018). A recent study of early-time, high-cadence lightcurves in Förster et al. 2018 finds evidence for mass loss rates greater than 10-4 M☉ in the majority of their RSG sample. It is important to remember that these rates are for single star models, and since 75 of massive stars in binaries have separations that can lead to interaction (Kiminki & Kobulnicky 2012; Sana et al. 2012; de Mink et al. 2014; Moe & Di Stefano 2017), mass-loss rates and densities could vary if a companion is present.
In 8–9 of CCSNe the circumstellar medium (CSM) surrounding the progenitor is photoionized or shock heated, creating narrow ( 100 km s-1) hydrogen emission lines in their spectra (Smith et al. 2011a). The narrow lines lend themselves to the name Type IIn, where the “n” stands for narrow (Schlegel 1990). The progenitors of these IIn are likely special cases of evolved massive stars with pre-supernova outbursts, and could include RSGs, yellow hypergiants (YHGs), or luminous blue variables (LBVs) (Gal-Yam et al. 2007; Gal-Yam & Leonard 2009; Smith 2014). The SNe IIn 1998S (Shivvers et al. 2015; Mauerhan & Smith 2012) and PTF11iqb (Smith et al. 2015) are examples of objects that likely had RSG progenitors, and may have been classified as a normal Type II if they had not been observed so soon after explosion.
If a SN is observed early enough, before the SN ejecta overtake the surrounding material, narrow lines from slow CSM can be detected in otherwise normal SNe (Niemela et al. 1985; Benetti et al. 1994; Leonard et al. 2000; Quimby et al. 2007). If present, these early and brief spectral features can be used to infer properties about the progenitor star such as mass-loss history and composition (Gal-Yam et al. 2014; Groh et al. 2014; Davies & Dessart 2019). Additionally, if the CSM is dense enough, shock interaction with the SN ejecta can occur, converting the kinetic energy of the fast ejecta to radiative energy, thus increasing the luminosity of the SN. All of these features disappear within a week of explosion, eliminating them from the traditional class of Type IIn SNe. To date, only a hand-full of objects have shown these early high ionization narrow emission lines including SN 2013cu (Gal-Yam et al. 2014), SN 1998S (Shivvers et al. 2015), PTF11iqb (Smith et al. 2015), SN 2013fs (Yaron et al. 2017), and SN 2016bkv (Hosseinzadeh et al. 2018). Others have shown a featureless, blue continuum with no lines (Khazov et al. 2016). As we discuss below, SN 2017gmr was observed within 1.5 days of explosion, and showed no signs of narrow emission other than H in early spectroscopy.
SN 2017gmr was discovered at an RA(2000) 02h35m30s.15, Dec(2000) during the course of the DLT40 one-day cadence SN search (Tartaglia et al. 2018, for a description of the survey, see) in the northeastern portion of NGC 988 (Figure 1) on 2017 September 4.25 UT (Valenti et al. 2017, MJD 58000.266;); it was given the designation DLT17cq by the DLT40 team, but we use the IAU naming convention and refer to it as SN 2017gmr throughout this work. The discovery magnitude was =15.12 (16.3, given the distance modulus we adopt below), and DLT40 observations taken two days prior to discovery (MJD 57998.230) show no source at the position of the transient down to r19.4 mag (12.1), indicating the SN was caught very close to the time of explosion. In Section IV below we model the early-time light curves to constrain the explosion time and settle on MJD 57999.09 (2017 September 3.08) as the epoch of explosion, and adopt this value throughout the paper.

Spectroscopic observations conducted on 2017 September 6.19 allowed classification of this object as a possible core collapse SN (Pursimo et al. 2017); it was confirmed as a Type II with broad Balmer lines in emission and moderate reddening about 1 week after explosion, on 2017 September 10.2 (Elias-Rosa et al. 2017). Adopting a redshift of z=0.00504 (Koribalski et al. 2004), an = 73.5 km s-1 Mpc-1 (Riess et al. 2018), and the Virgo infall velocity for the host NGC 988 given by NASA/IPAC Extragalactic Database (NED), = 1438 8 km s-1, we obtain a = 31.46 0.15 mag, or a distance of 19.6 1.4 Mpc. NGC 988 is located in the same group as NGC 1084, the host galaxy of SN 2012ec, whose distance modulus was determined to be = 31.36 0.15 mag in Rodríguez et al. 2019, bolstering our confidence in the assumed distance. If we instead use the 3K CMB velocity = 1288 16 km s-1, or the Local Group velocity = 1532 5 km s-1, this changes the distance to 17.5 1.2 Mpc or 20.8 1.5 respectively. The Virgo infall values are more consistent with our host galaxy line measurements, and fall nicely within other cosmological distance measurements so we will use that value throughout the paper.
The paper is structured as follows: in Section II observations and data reduction are outlined, the reddening estimation is presented in Section III, in Section IV we discuss the optical and IR photometric evolution, Section V details the spectroscopic evolution of the object, in Section VI we lay out the implications of the observational data, and finally the results are summarized in Section VII.
II OBSERVATIONS
A comprehensive optical and near-infrared (NIR) dataset has been collected on SN 2017gmr, with several major supernova collaborations contributing data. These include the Las Cumbres Observatory’s Global Supernova Project (Szalai et al. 2019, e.g.), the NOT (Nordic Optical Telescope) Un-biased Transient Survey11 1 http://csp2.lco.cl/not/ (NUTS), the Public ESO Spectroscopic Survey for Transient Objects (Smartt et al. 2015, ePESSTO;), and the Texas Supernova Spectroscopic Survey (TS3). Below we briefly list the instruments/telescopes used in obtaining data for SN 2017gmr but for ease of reading an accounting of reduction procedures is included in the Appendix.
Continued photometric monitoring of SN 2017gmr was done by the DLT40 survey’s two discovery telescopes, the PROMPT5 0.4-m telescope at Cerro Tololo International Observatory and the PROMPT-MO 0.4-m telescope at Meckering Observatory in Australia, operated by the Skynet telescope network (Reichart et al. 2005). Additionally, an intense photometric campaign by the Las Cumbres Observatory telescope network (Brown et al. 2013), under the auspices of the Global Supernova Project, was begun immediately after discovery, in the bands. Photometric data points were also taken at: 1) the 0.6-m Schmidt telescope at Konkoly Observatory in the bands; 2) the 0.6-m Super-LOTIS telescope at Kitt Peak in the bands; 3) the 2.0-m Liverpool Telescope and the Optical Wide Field camera (IO:O) in the bands; 4) the 2.56-m NOT Alhambra Faint Object Spectrograph and Camera (ALFOSC) in the bands; 5) the Asiago Schmidt 67/92-cm telescope in the bands; 6) the 1.04-m Sampurnanand Telescope (ST) at Manora Peak, Nainital in bands (Sagar 1999); (7) the 1.30-m Devasthal Fast Optical Telescope (DFOT) at Devasthal, Nainital in bands (Sagar et al. 2012); (8) the 2.01-m Himalayan Chandra Telescope (HCT) at Indian Astronomical Observatory (IAO) in Hanle, India (Prabhu & Anupama 2010) in the bands; and (9) the 60-cm REM telescope in . Neil Gehrels Swift Observatory (Gehrels et al. 2004, Swift) UV and optical imaging was obtained of the early portion of the light curve. Furthermore, near-infrared (NIR) , , and images were taken with NOTCam on the 2.56-m NOT telescope and the REM 60-cm telescope.
Many optical spectra were taken with the robotic FLOYDS spectrographs on the 2-m Faulkes Telescope North and South (Brown et al. 2013, FTN and FTS;). Other telescopes/instruments used were: 1) the Goodman spectrograph (Clemens et al. 2004) on the 4.1-m SOAR telescope; 2) the Intermediate Dispersion Spectrograph (IDS) on the 2.54-m Isaac Newton Telescope (INT); 3) the Inamori-Magellan Areal Camera & Spectrograph (Dressler et al. 2011, IMACS;) on the 6.5-m Magellan Baade telescope; 4) the ALFOSC spectrograph on NOT; 5) the ESO Faint Object Spectrograph and Camera 2 (EFOSC2) on the 3.58-m New Technology Telescope (NTT), 6) the Beijing Faint Object Spectrograph and Camera (BFOSC) on the Xinglong 2.16m telescope; 7) the Asiago Faint Object Spectrograph and Camera (AFOSC) on the Asiago 1.82-m telescope; 8) the FOcal Reducer and low dispersion Spectrograph 2 (Appenzeller et al. 1998, FORS2;) on the 8.2-m Very Large Telescope (VLT); 9) the Himalaya Faint Object Spectrograph and Camera (HFOSC) on HCT; 10) the Boller & Chivens (B&C) Spectrograph mounted on the Asiago 1.22-m telescope; 11) the Low Resolution Spectrograph (Chonis et al. 2016, LRS2;) on the effective 10-m Hobby-Eberly Telescope (HET); and 12) the Boller & Chivens (B&C) Spectrograph mounted on the 2.3-m Bok telescope on Kitt Peak. Further, a moderate-resolution spectrum was obtained with the Blue Channel (BC) spectrograph on the 6.5-m MMT. High-resolution echelle spectra were taken with the HIgh-Resolution Echelle Spectrograph (Vogt et al. 1994, HIRES;) on Keck and the Magellan Inamori Kyocera Echelle instrument (Bernstein et al. 2003, MIKE;) on the Magellan Clay telescope. NIR spectra were taken with the Gemini Near-Infrared Spectrograph (GNIRS) at Gemini North Observatory (Elias et al. 2006), the Folded-port InfraRed Echellette (Simcoe et al. 2013, FIRE;) on Magellan Baade, SpeX (Rayner et al. 2003) on the NASA Infrared Telescope Facility (IRTF), and the Son OF ISAAC (SOFI) spectrograph mounted on the NTT (Moorwood et al. 1998).


III Reddening Estimation
The Milky Way line-of-sight reddening for NGC 988 is mag (Schlafly & Finkbeiner 2011). Elias-Rosa et al. 2017 noted strong host Na ID absorption with an equivalent width (EW) of 1.45 Å on day 6, resulting in an estimation of a total using the relation presented in Turatto 2003. From the high-resolution Keck HIRES spectrum taken 6 hours after discovery (Figure 2, top) we measure EWs of the individual Na ID lines of 0.75 and 0.62 Å similar to the combined value found by Elias-Rosa et al. 2017. Unfortunately, the relationship between Na ID EW and dust extinction presented in Poznanski et al. 2012 saturates around 0.2 Å requiring alternative methods for the reddening estimation of SN 2017gmr.
From the same early high-resolution spectrum we also detect the 5780 Å diffuse interstellar band (DIB) absorption feature ((Figure 2, bottom), which can be used to estimate the extinction (Phillips et al. 2013). We obtain an EW of 0.22 Å which corresponds to mag, or an mag using an = 3.1 and the reddening law of CCM (Cardelli et al. 1989). Note that the uncertainty from this relationship is limited to 50, which only constrains the extinction to between 0.6-1.7 mag.
We also compare the color of SN 2017gmr during the plateau phase to other Type II SNe with published reddening estimates and adjust the accordingly until we have a similar fit (similarly to that done by Tartaglia et al. 2018). Comparison with SNe 2004et (Sahu et al. 2006), 2012A (Tomasella et al. 2013), 2013ab (Bose et al. 2015a), 2013ej (Bose et al. 2015b), and 2014cx (Huang et al. 2016), shown in Figure 3, constrain the reddening to = 0.30 0.1 mag.

As another constraint we have compared our unreddened spectra with optical spectra of SN 2004et, a prototypical Type II-P, from similar epochs and applied reddening corrections until the spectra had a matching continuum slope. SN 2004et has a measured mag (Sahu et al. 2006), and comparisons on both day 7 and day 84 yield a total mag in SN 2017gmr. As this value is consistent with the other two estimates we settle on a value of mag as our final reddening estimation, with the caveat that there may be somewhat large uncertainties. This is the standard value that will be used throughout the paper.
IV Photometric Evolution
IV.1 Optical Lightcurve
The full optical lightcurve can be seen in Figure 4, and the -band lightcurve compared to other Type II SNe is shown in Figure 5. For reference, the -band discovery magnitude is shown as an open hexagon while the dotted line connects the pre-explosion upper-limit -band magnitude two days prior in Figure 5. Overall the shape is that of a typical Type II supernova with an extended plateau, albeit on the brighter end with a maximum = -18.3 mag. The maximum occurs at 6 days after explosion for the and bands, 8 days for and , and closer to 10 days for and . This is consistent with the average rise times seen for the majority of Type II SNe (González-Gaitán et al. 2015; Rubin et al. 2016; Förster et al. 2018).
The lightcurves then remain at a relatively constant magnitude for the next 75 days until the fall off the plateau begins around day 85, with decline rates of 0.027, 0.011, and 0.003 mag day-1 in , , and respectively. Using the method described in Valenti et al. 2016, we obtain the point at half of the fall at MJD 58093.5 0.4, or 95 days after our estimated explosion date. Between day 85 and 105 the V-band lightcurve drops by 1.5 mag. This moderate post-plateau drop is on the lower end but consistent with other II-P SNe, particularly higher luminosity events (Valenti et al. 2014).

The plateau length of SN 2017gmr is on the shorter side for comparable objects and has an average = 17.8 mag (Figure 5), a value noticeably brighter than the norm (but similar to SN 2004et). According to Anderson et al. 2014, Faran et al. 2014, and Galbany et al. 2016, more luminous Type II-P SNe tend to exhibit shorter plateau durations, which coincides with the overall picture of SN 2017gmr. SN 2017gmr, SN 2013fs, SN 2004et, and SN 2008if all show similar luminosities and evolution over the first few days (Figure 5 inset), but then evolve to drastically different lightcurve shapes. While SN 2017gmr and SN 2004et change very little over the first 3 months, SN 2013fs and SN 2008if show evolution more akin to Type IIL SNe, with a larger drop in luminosity over the first 75 days.
IV.2 The early U-bump

One rather intriguing feature seen in the early lightcurve of SN 2017gmr is the bump in luminosity that occurs a couple of days post-explosion, particularly in the bluest bands. In Figure 6 we show the ground-based and observations along with the Swift UV. From the and data we see a sharp rise over the first 2 days, then a drop of roughly 0.2 mag and 0.1 mag in and respectively, then a slow rise over the next few days back to the peak value. Unfortunately, no Swift data exists prior to day 2 so the lightcurve behavior in the UV bands is unknown over the same time period. It is also possible that we are seeing undulations in the and lightcurves due to inhomeganities in the CSM, particularly in some cases where the magnitude changes are larger than the uncertainties.
Models recently produced by Moriya et al. 2018 do show this small bump in luminosity in the and bands with certain mass-loss and density configurations (see also Morozova et al. 2018). The key to creating this early bump is to have moderately dense CSM close to the progenitor. The Type II-P SN 2016X showed a similar bump in the Swift lightcurve over the first few days after explosion, although it did not seem to be present in the optical bands (Huang et al. 2018a). Their explanation for the initial lightcurve peak was a shock breakout cooling effect, but as we discuss in Section IV.8, we cannot fit this bump with standard shock-cooling models.
IV.3 Late Time Lightcurve
As we show in Figure 5, the radioactive tail of SN 2017gmr does not show the exponential decline of 56Co decay of 0.98 mag 100 d-1 (Woosley et al. 1989). While the -band declines around 0.9 mag 100 d-1, and decline by 1.5 and 1.4 mag 100 d-1, respectively. By our last photometric observations around day 175, the -band lightcurve is about 0.5 mag fainter than expected. The same behavior is seen in the bolometric lightcurve, as we discuss below. The deviation from predicted 56Co decay can be explained by incomplete gamma ray trapping, a decrease in the energy input from shock interaction, as dust production in the ejecta, or some combination of the three.
Incomplete gamma-ray trapping has been documented in other Type II-P SNe. Anderson et al. 2014 found that the more luminous the SN, the greater the deviation from the expected decay rate and attributed it to low ejecta mass. Highly energetic explosions can also have large expansion velocities, which in turn leads to weaker trapping. Alternatively, if the distribution of 56Ni is very asymmetric or mixed in the ejecta, the escape probability could be greater. If CSM interaction is occurring it can also contribute to the luminosity at late times and would not follow the predicted rate of 56Co decay. We will discuss these possible scenarios further in Section VI.

IV.4 Infrared Lightcurve
Multiple epochs of NIR data were obtained over the first 160 days of evolution. The NIR luminosity rose over the first 30-40 days after explosion (Figure 7). This was followed by a few weeks of nearly constant luminosity, then starting around day 75 a steady decline begins in all filters and continues until our last observed epoch. We have plotted the NIR lightcurves of SN 2004et from Maguire et al. 2010 as a comparison, and it indicates that the NIR plateau is much shorter for SN 2017gmr than SN 2004et, and that likely the late-time NIR luminosity is greater for SN 2017gmr as well.
IV.5 Color Evolution
The color evolution of SN 2017gmr and a comparison to other SNe are shown in Figure 3. As in other Type II SNe, the color is initially blue and evolves rapidly towards the red as the large envelope of the RSG progenitor expands and cools, until it reaches the recombination phase and the rate slows (de Jaeger et al. 2018a). This continues over the duration of the optically thick plateau phase until a peak value of mag. After day 100, once the exponential decline phase begins, the color gradually becomes bluer again.
IV.6 Bolometric Lightcurve
The abundance of photometric data has allowed us to straightforwardly create a quasi-bolometric lightcurve using the routine superbol (Nicholl 2018). Following the description in Nicholl et al. 2016, the reddening and redshift corrected photometry in each band was interpolated with the -band as reference, then converted to a spectral luminosity (Lλ). The bolometric luminosity was then computed from the integration of the SED for each epoch.
In Figure 8 we show the bolometric lightcurve produced from the observations (red), and those obtained with blackbody corrections (black), as well as the bolometric temperature () and bolometric radius () shown in the bottom of Figure 8. The red lightcurve is pseudo-bolometric, and is constructed by integrating under the filters from UV to IR. -UV coverage does not extend past 9d, so a first-order polynomial is fit to the data and extended out to later epochs. As the contribution to the total bolometric luminosity falls quickly after the first few weeks this does not add much uncertainty. The data have been corrected for an mag and adopting the distance modulus = 31.46 mag.
As we mention above, the late-time lightcurve falls faster than expected for a fully-trapped 56Co decay, with Lbol roughly 5 1041 ergs s-1 fainter that predicted on day 165. Integrating over the entire bolometric lightcurve gives a total radiated energy of 3.5 1049 ergs in the first 175 days.


IV.7 A Search for pre-SN Outbursts
With the advent of high cadence transient searches in the last decade, several instances of pre-SN outbursts have been observed directly in the months to years before explosion (Fraser et al. 2013; Mauerhan et al. 2013; Ofek et al. 2013; Ofek et al. 2014; Elias-Rosa et al. 2016; Tartaglia et al. 2016; Reguitti et al. 2019, e.g.), although overall detectable outbursts are rare (Bilinski et al. 2015; Strotjohann et al. 2015). These outbursts are generally associated with SNe that have substantial circumstellar material as evidenced by their SN IIn-like behavior. However, many standard Type II-P/L SNe also show evidence for CSM material either as narrow emission lines in their early time spectra (Khazov et al. 2016, e.g.) or early peaks in their light curves (Morozova et al. 2017). This CSM could have been deposited in the years or decades prior to explosion, and could have been accompanied by faint pre-SN outbursts, as has recently been suggested in the gravity wave driven scenario of Shiode & Quataert 2014; Fuller 2017, or in unsteady nuclear burning events or binary interaction (Smith & Arnett 2014).
The field of NGC 988 was observed by the DLT40 survey 56 times between January 2015 and September 2017, just prior to the explosion of SN 2017gmr. During much of this time period the DLT40 survey was coming online, with some prolonged down periods. No precursor outbursts were observed down to a typical limiting magnitude of 19–19.5 mag (12 Mr12.5). We can therefore rule out bright eruptions like SN imposters or LBV eruptions with roughly = 14 mag lasting several months, but not fainter or short-lived outbursts. This includes those LBV eruptions that have been found to have magnitudes of only = 10 or 11 mag (Smith et al. 2011b).

IV.8 Early Lightcurve Modeling
Due to the well-sampled photometric data over the first few days after explosion in SN 2017gmr, we are able to model the early time lightcurves using the prescriptions outlined in Sapir & Waxman 2017. To do this we employed the code presented in Hosseinzadeh 2019 and described in Hosseinzadeh et al. 2018, which uses a MCMC routine to fit the lightcurve in each photometric band and outputs posterior probability distributions for physical parameters, such as the time of explosion, the temperature, luminosity, and radius one day after explosion, and the time at which the envelope becomes transparent. Data was only fit up to day 4 to still lie within the validity range described by Rubin & Gal-Yam 2017. The best fits to our data are shown in Figure 9.
One day after explosion the modeled temperature is 25.9 0.1 103 K (kK) with a radius of 489 22 R☉ (3.4 1013 cm) and a luminosity of 2.9 0.03 1043 erg s-1. The estimated progenitor radius is on the small end for a RSG which theoretically can range in size from 100 – 1500 R☉ (Levesque 2017), but is commensurate with observations of some Galactic RSGs (Montargès et al. 2018; Wittkowski et al. 2017, for example). From these fits we also derive an explosion date of MJD 57999.09 0.01 d. This value is further bolstered by our first observation obtained on MJD 58000.27, or just over a day after the estimated explosion date, and our last non-detection on MJD 57998.22. This is also consistent with the UV photometry obtained 2.5 days after discovery which does not show a rise to peak that is seen in other bands (Figure 6).

V Spectroscopic Evolution


V.1 Optical Spectra
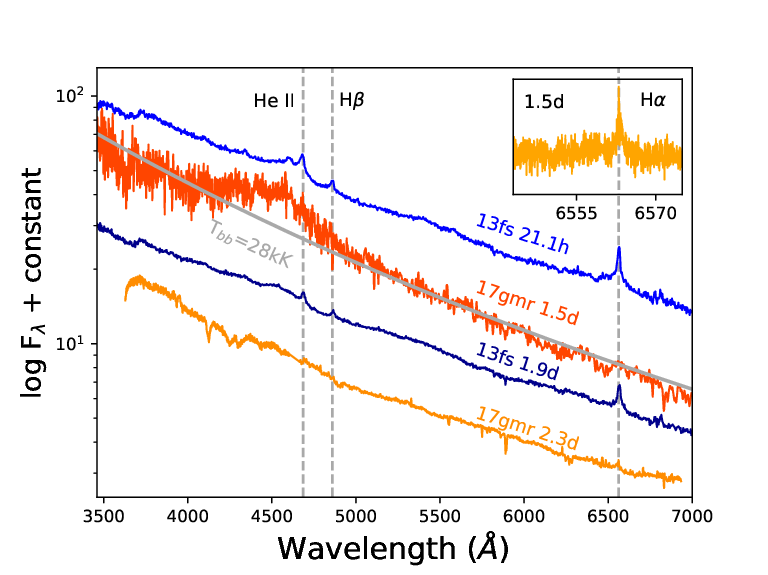
The early spectra, shown in Figure 10, are typical for a young II-P supernova, displaying a blue, mostly featureless continuum. Only strong interstellar NaID absorption lines, and a broad emission feature around 4600 Å (likely He II 4686) are seen. Neither the low-resolution FLOYDS spectrum or the high-resolution Keck spectrum, taken within hours of discovery, show signs of narrow high-ionization lines, other than narrow 55 km s-1 H seen in the Keck HIRES echelle spectrum (inset 10). This is different from other early-detected CCSNe which can show features of highly ionized nitrogen and carbon along with He and H. This is discussed further in Section VI.3.
As the photosphere begins to cool, the continuum becomes redder and broad Balmer emission lines begin to appear with P-Cygni absorption features. When H becomes pronounced a week after explosion the peak appears blueshifted, centered at 5000 km s-1. This is a common occurrence in Type II-P SNe where the opaque hydrogen envelope preferentially obscures the redshifted, receding side of the line (Dessart & Hillier 2005a; Anderson et al. 2014). As the recombination front moves through the envelope, the red side becomes visible again and the emission line peak becomes more symmetric.
Around a month after explosion, the SN is well into the plateau phase and the Ca II IR triplet centered around 8600 Å emerges, along with a forest of metal lines blueward of 5000 Å (Figure 11). In particular, lines of Fe II, including Fe II 4924, 5018, and 5169 can be seen.
By the end of the plateau phase other broad lines such as Ba II 6142, [Sc II] 5527, 5658, and 6246 (blended with [O I]), and [O I] 6300,6364 appear in the nebular spectra (Figure 12). Redward of H, strong [Ca II] 7291,7324 is seen, flanked on either side by He I 7065, Fe II 7155 and O I 7774. What appears to be K I 7665,7699 is also detectable and distinct from O I by day 120. The emergence of the He I 7065 line starting around day 90 suggests the presence of a strong ionization source. Also of note is the strengthening of the Ca II IR triplet, which has become almost as strong as H by day 165.

V.2 IR Spectra
Figure 13 shows the NIR spectral evolution from 2–149 days. Overall the spectra show a decrease in flux with increase in wavelength, typical of young CCSNe. The spectra from the first week are featureless (minus atmospheric absorption), but by day 13 some Pa emission begins to emerge. Over the next month Pa , and Br appear as the continuum flux decreases. Both He I 1.083 and Pa are present, although slightly blended. As the SN drops from the plateau phase after 100 days, additional lines of O I, Si I, He I, and other weak hydrogen series are seen. The CO overtone between 2.3–2.5 m is not present in our last two spectra as has been seen for other Type II SNe (Yuan et al. 2016; Rho et al. 2018; Sarangi et al. 2018; Tinyanont et al. 2019). This may help rule out dust formation, at least in the first 150 days.

V.3 Distance Measurements
To help constrain the distance to SN 2017gmr we have used the Expanding Photosphere Method (Kirshner & Kwan 1974, EPM), which relies on the relation between the photometric angular radius and the spectroscopic physical radius of the homologously expanding SN ejecta. Assuming that the outflow is radiating as a diluted blackbody, the observed SN magnitudes are fitted to a blackbody function multiplied by dilution factors, to derive the color temperature and the angular radius. Dilution factors based on atmosphere modeling of Type II SNe were adopted from Dessart & Hillier 2005b. Further, to eliminate the effect of filter response function ingrained in the observed broadband magnitudes, the response function is convolved with the blackbody model flux. The convolved function can be expressed in terms of the color temperature and the coefficient values taken from Hamuy et al. 2001. Following the same procedure undertaken in Dastidar et al. 2018, expansion velocities were calculated using the He I 5876 and Fe II 5169 lines over the first 50 days of evolution.
The distance is derived from a linear fit to the data in the form of:
| (1) |
where the slope is the distance, and the y-intercept the date of explosion. This fit is shown in Figure 14. From this method we obtain an EPM distance of 18.6 2.2 Mpc, a value consistent with the 19.1 Mpc used throughout the paper. It also indicates an explosion epoch of MJD 57999.0 1.9 days, which agrees well with the constrained explosion date discussed above.
We have also measured the distance using the Standard Candle Method (SCM), which was first proposed by Hamuy & Pinto 2002 and later expanded on by other authors. SCM uses photometric magnitudes and expansion velocities at 50 days. For SN 2017gmr these values are: = 14.57 0.04, = 13.86 0.02, =13.56 0.03, and = 5600 km s-1. From these values we get SCM distances (in Mpc) of 16.10 (Hamuy 2005), 16.88 (Takáts & Vinkó 2006), 24.70 (Nugent et al. 2006), 14.38 (Poznanski et al. 2009), 10.24 (de Jaeger et al. 2017), and 13.31 (Gall et al. 2018). Except for Nugent et al. 2006, all other SCM distances are systematically lower than the EPM and kinematic distances. The same was found for SN 2017eaw and SN 2004et in Szalai et al. 2019, and could be due to CSM-interaction or asymmetries. The SCM method relies on a correlation between the magnitude and expansion velocity at day 50, which could break down under these conditions.
VI Discussion
VI.1 56Ni Mass
To estimate the 56Ni mass we employ various methods from the literature, in particular those of Hamuy 2003a, Jerkstrand et al. 2012, and Pejcha & Prieto 2015. These methods all rely on bolometric luminosities in the radioactive tail phase, so we use the constructed bolometric lightcurve discussed above (Figure 8). This results in measured 56Ni masses of 0.130 0.026 M☉, 0.124 0.026 M☉, and 0.090 0.030 M☉ respectively for the three techniques. In the Pejcha & Prieto 2015 calculation, we extrapolated the bolometric luminosity to day 200, and obtain an = 1.85 0.9 1041 erg s-1.
Other than SN 1992H, for which the actual 56Ni mass could be as low as 0.06 M☉ depending on the distance used, and SN 1992am (Hamuy 2003b), this is one of the highest 56Ni masses reported for normal Type II SNe (Anderson 2019), higher if there is incomplete gamma photon trapping or if the SN is at a further distance than 19.6 Mpc, lower if there is CSM interaction or if the SN is closer. According to Müller et al. 2017, less than 5 of Type II-P SNe have 56Ni masses as large as 0.12 M☉. For comparison, other “normal” Type II-P SNe such as SNe 1999em, 2003gd, and 2004dj each have 56Ni masses 0.02 M☉, or a full order of magnitude lower than estimated here (Elmhamdi et al. 2003b; Hendry et al. 2005; Vinkó et al. 2006).
We can also estimate the 56Ni mass using a steepness factor , where , a measure of the transition between the plateau and radioactive tail phases (Elmhamdi et al. 2003a). Generally an anticorrelation exists, where the steeper the transition, the lower the 56Ni mass. Following Equation 7 in Singh et al. 2018 we measure a steepness factor mag d-1 , which corresponds to an estimated 56Ni mass of 0.055 M☉. This is significantly smaller than the value obtained using the late-time bolometric luminosity, and more consistent with other normal Type II-P SNe. This inconsistency could be due to the degree of mixed 56Ni in the ejecta, since the same amount of 56Ni will create a steeper decline if it is centrally located rather than mixed. The mixed 56Ni will actually increase the radiative diffusion timescale, causing the transition to appear shallower.


VI.2 Extremely fast ejecta
In Figure 15 we show the evolution of the line velocities of both H and Fe II 5169 (shown as a function of radius over time). H falls from 15000 km s-1 near explosion to a relatively stable value of 7000 - 8000 km s-1 during the radioactive tail. Fe II 5169, a more reliable measurement of photospheric velocity than H, settles to a late-time velocity of 3500 km s-1. These expansion velocities are higher than average for Type II SNe, and for Type II-P SNe in particular. In Figure 16 we show the comparison of SN 2017gmr optical spectra at various epochs with the well-studied SN 1999em and SN 2004et. At all epochs the line velocities of SN 2017gmr are faster than those of the other two.
From Gutiérrez et al. 2017a, the mean velocities on day 53 for a sample of 122 Type II SNe ((measured from the absorption minimum) are 6365 km s-1 and 3537 km s-1 for H and Fe II 5169, respectively. In comparison, SN 2017gmr has velocities on day 53 of 9330 km s-1 and 5240 km s-1 for H and Fe II 5169. By day 115, the difference in the Fe II 5169 velocities has decreased, 2451 km s-1 average versus 3520 km s-1 for SN 2017gmr, but H remains almost 2000 km s-1 faster than the mean value of 5805 km s-1.
The faster line velocities seem to correlate well with the high inferred 56Ni mass and maximum luminosity of SN 2017gmr. Gutiérrez et al. 2017b found a correlation between expansion velocities and 56Ni mass that indicated that more energetic explosions (resulting in faster expansion velocities) created higher 56Ni mass. When combined with previous conclusions of Hamuy & Pinto 2002, Hamuy 2003a and Pejcha & Prieto 2015, this suggests that the more energetic the explosion, the higher the luminosity, expansion velocity, and 56Ni production. This may suggest that SN 2017gmr had an unusually energetic explosion, although low ejecta mass can also allow for high ejecta velocities.
There are other ways to create faster line velocities. If CSM interaction is occurring it can excite H and other lines at larger radii (and therefore higher velocities). This means that lines which would have otherwise already recombined in the outer, faster parts of the ejecta will be reionized and give the appearance of faster ejecta at later times. Faster expansion velocities can also arise from asymmetries in the explosion. Dessart & Hillier 2011 found that asphericities in the ejecta of an axially symmetric explosion can change the location of the P-Cygni minimum with inclination as much as 30 in the photospheric phase. We explore the possibility of an asymmetric explosion in Section VI.4.
VI.3 Early Narrow Features?
Narrow lines seen within the first few days of explosion can be useful to infer composition, velocity, and density of the CSM surrounding the SN progenitor (Gal-Yam et al. 2014). One of the most well known objects displaying this phenomenon, SN 2013fs, showed narrow ( 100 km s-1) lines of oxygen, helium, and nitrogen within the first few hours of explosion (Yaron et al. 2017; Bullivant et al. 2018). These high excitation lines disappeared over the next two days, and eventually the spectra resembled that of a normal Type II SN. Similar behavior has been seen in SN 1983K (Niemela et al. 1985), SN 2006bp (Quimby et al. 2007), SN 2013cu (Gal-Yam et al. 2014), SN 1998S (Shivvers et al. 2015), PTF11iqb (Smith et al. 2015), SN 2016bkv (Hosseinzadeh et al. 2018), and SN 2014G (Terreran et al. 2016). Khazov et al. 2016 found 14% to 18% of their sample of SNe II showed signs of early narrow lines, which they conclude is a lower limit for the SNe II population as a whole.
These narrow lines were interpreted as the flash ionization of a WR-like wind for SN 2013cu (Gal-Yam et al. 2014). Later interpretation suggested that it instead possibly the ionization of the cool dense wind from an LBV/YHG progenitor (Groh et al. 2014) which is more consistent with a type IIb SN progenitor. Furthermore, Smith et al. 2015 found that PTF11iqb had a RSG progenitor and the early narrow lines were likely the result of shock ionization from CSM interaction. A similar conclusion about the progenitor of SN 1998S was also reached in Shivvers et al. 2015 and Mauerhan & Smith 2012. In other words, WR-like wind features (particularly of hydrogen rich WNH type) can be seen in early spectra if there are enough high energy photons to fully ionize the progenitor’s cool dense wind.
SN 2017gmr was observed spectroscopically within hours after discovery, and likely within 1.5 days of shock breakout, yet the only narrow emission line seen was that of H (Figure 17), and only with the higher resolution instruments. The Keck HIRES spectrum on day 1.5 (inset of Figure 17) shows a narrow H emission with a Gaussian FWHM velocity of 55 km s-1. This is suggestive of a RSG wind (see Smith 2014). The spectral resolution of this data is 7 km s-1, so the velocity of the ionized material is fully resolved. For reference, SN 1998S was observed with the same instrument 1.86 days after discovery and had a narrow component velocity of 40 km s-1 (Shivvers et al. 2015, albeit with lines other than H also present). The day 2.3 HET spectrum also seems to show a narrow but weak H feature with a moderately higher intermediate-width FWHM velocity of 1000 km s-1. The broadening of the line may be due to electron scattering in the CSM, and the narrow feature may be embedded within, but it has likely faded by this epoch. This feature is completely gone in the HET spectrum 3 days later; in its place is a broad, blueshifted H emission with an expansion velocity of 15000 km s-1.
One other noticeable feature in the very early spectra is the broad emission around 4600 Å (see Figure 17). A similar broad bump was seen in SN 2006bp (Quimby et al. 2007) and SN 2013fs (Bullivant et al. 2018) and was attributed to blueshifted He II 4686 formed from the SN ejecta beneath a CSM shell. These two objects did also show narrow He II 4686 emission on the red edge of the broad 15000 km s-1 line, which is absent in SN 2017gmr.
The lack of narrow high-ionization lines in the early spectra would seem to suggest that if nearby CSM was present, its density was too low to yield detectable emission. Alternatively, it could imply that the photons were not energetic enough to doubly ionize He in the CSM, even if SN 2017gmr likely had a very energetic explosion. If the CSM density was adequately high, this too could prevent narrow lines from forming, as it would self-absorb all of the high energy photons. Another option would be that the narrow, high-ionization lines were present before our first spectrum at 1.5 days, but were produced from asymmetric CSM which was quickly enveloped by the spherically expanding SN ejecta (Smith et al. 2015). We will discuss this possibility further in the next section.
Another luminous Type II, SN 2016esw, was also caught within a day of explosion and showed no signs of high-ionization emission lines (de Jaeger et al. 2018b). The authors conclude that the progenitor of SN 2016esw was likely surrounded by low-density CSM some distance away from the surface of the star that eventually showed signs of interaction 2-3 weeks after explosion. Similarly, the type II-P SN 2017eaw did not show early flash signatures (Van Dyk et al. 2019), except for possibly the 160 km s-1 H line seen by Rui et al. 2019 on day 2.5. Unlike SN 2016esw though, neither SN 2017eaw nor SN 2017gmr showed obvious signs of CSM interaction in the shape of the H emission line the first few weeks after explosion.
VI.4 Circumstellar Interaction or Asymmetric Explosion?


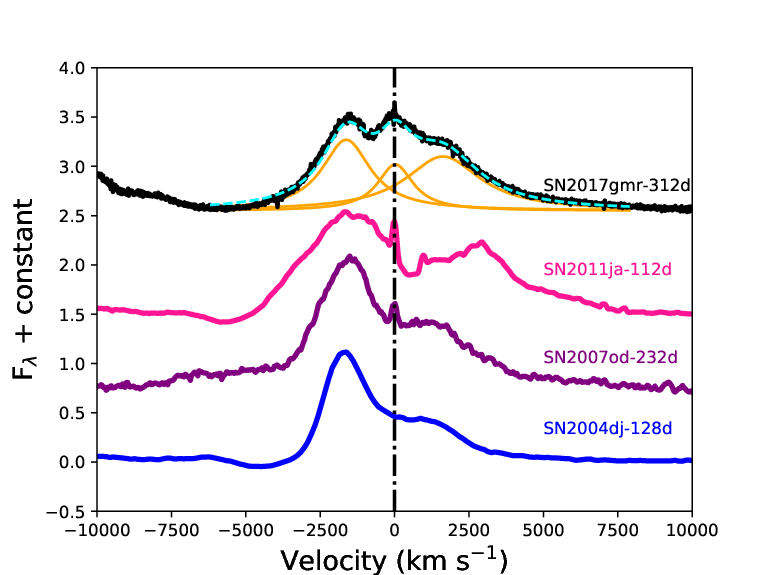
When the SN reappeared from behind the Sun in 2018 July we obtained one high-resolution echelle spectrum with MIKE on Magellan/Clay on day 312. The late-time analysis on SN 2017gmr is beyond the scope of this paper, and will be discussed in depth in an upcoming paper, but due to the implications for the early time evolution we are including the H and [O I] lines here. In Figure 18 we show in red the day 312 spectrum compared to the other moderate-resolution MMT spectra. Instead of a single broad line, H clearly shows three intermediate width peaks. The same is seen in the [O I] doublet, albeit the right peak of the 6300 Å line is stronger than the red peak of H due to the overlap of the blue peak from the 6364 Å line of the doublet. Signs of this asymmetry can even be seen in the day 154 spectrum.
In Figure 19 we show that the multi-peaked H can be fit with three Lorentzians, one centered at 0 km s-1 (6563 Å) and blue and red peaks at roughly 1700 km s-1 ( 35 Å). The same velocities are seen in [O I], for both the 6300 and 6363 lines, but the doublet nature of the line makes it appear distinctly different. The red peak of 6300 would fall at 6335 Å while the blue peak of 6364 would fall around 6330 Å making the red peak of 6300 seem as bright as the blue peak, and swamping the emission at the center of the line.
First presented in Mazzali et al. 2005, double-peaked emission lines in SN spectra are often interpreted as ejecta interacting with asymmetric CSM, most commonly in a disc or torus (Hoffman et al. 2008; Maeda et al. 2008; Taubenberger et al. 2009; Mauerhan et al. 2014; Smith et al. 2015; Andrews et al. 2017). In this scenario, the underlying broad component traces emission from the free expansion of the SN ejecta, while the intermediate components are formed in the post-shock region between the forward and reverse shocks created as the ejecta crashes into the CSM. When the fast moving SN ejecta collides with the slow moving CSM, depending on the density of surrounding material, the CSM can be accelerated from speeds of 10 - 100 km s-1 up to thousands of km s-1. The red and blue peaks therefore are the result of the ejecta accelerating the CSM material radially outward from the explosion. In the case of SN 2017gmr the CSM was likely accelerated from a normal RSG wind speed of 55 km s-1 to the observed intermediate feature speed of 1700 km s-1. Examples of other Type II SNe at somewhat similar phases as SN 2017gmr showing multi-peaked H are shown in Figure 19.
The fact that we do not see narrow emission lines does not necessarily discount the possibility of SN 2017gmr being a partially CSM-interaction powered event. CSM interaction can be inferred based on the intermediate-width line shapes and velocities. As explained in Smith et al. 2015, Smith 2017, and Andrews & Smith 2018, a disc-like geometry in the CSM may allow the CSM interaction to be hidden below the photosphere after the disc is enveloped by the fast SN ejecta. If the region of CSM interaction is happening below the ejecta photosphere, and the CSM is sufficiently dense, it can be hidden for long periods of time because the sustained CSM interaction luminosity itself keeps the surrounding SN ejecta ionized and optically thick. This could help explain the extended high-luminosity of SN 2017gmr. All that is required is that the disc or torus of material has a limited radial extent (i.e. 100 AU) so that it can be overrun early by the SN photosphere. Only when the photosphere recedes internal to the CSM location (which has been pushed outward to 1700 km s-1 due to the Doppler acceleration) will the intermediate-width lines be revealed.
If we assume that high-ionization lines were observable prior to our 1.5 day spectrum we can use the expansion velocity of H (15000 km s-1) to infer that the outer edge of the CSM must be closer than 1.8 1014 cm (or 2500 R☉). This is roughly the same radius infered for SN 2013cu (Gal-Yam et al. 2014) and PTF11iqb (Smith et al. 2015).
The other possibility is that the multiple peaks seen in the hydrogen lines could come from asymmetries in 56Ni in the ejecta. This was the scenario presented for SN 2004dj (Chugai et al. 2005, shown in Figure 19), SN 2010jp (Smith et al. 2012b) and SN 2016X (Huang et al. 2018b; Bose et al. 2019). In a forthcoming paper Nagao et al. (2019) find there is strong polarization in SN 2017gmr indicative of an aspherical explosion. Non-uniformity of 56Ni could cause uneven ionization and excitation in the ejecta, and produce multi-peaked emission lines. SN 2004dj showed strong H asymmetry immediately after the plateau phase ended, during the epoch of increased polarization (Leonard et al. 2006). As we show in Figure 18, distinct multiple peaks are not present until sometime between 154-312 days, or a significant time period after the end of the plateau. Also of note is that there is a component at rest velocity at late times in SN 2017gmr which would have to come from some spherically distributed radioactive material.
In general it is difficult to disentangle the two mechanisms. The low polarization at early times is explained by Nagao et al. (2019) by the hydrogen envelope hiding a highly asymmetric helium core which is only observable when the optical depth decreases. We suggest it could also be explained partially (or in full) by the spherical symmetry of the hydrogen envelope erasing the polarization signatures of deeply embedded asymmetric CSM interaction. The deviation from 56Co decay in the late-time lightcurve can be due to incomplete photon trapping caused by a non-spherical ejecta, or it could be due to a decrease in the shock interaction. Whatever the mechanism, the emission line shapes emerging during the nebular phase indicate a deviation from spherical symmetry, whether it be from asymmetric stellar ejecta or shock interaction with a disc or torus of CSM.
VI.5 Dust Formation?
As we briefly mention above, the lightcurves shown in Figure 4 show that there is a clear discrepancy between the observed late-time luminosity and what is expected due to 56Co decay. The fast decline could indicate the halting of shock interaction as a primary energy source, or that there is incomplete trapping of gamma rays as we discuss in Section VI.1. It could also be due in all, or part, to dust formation in the ejecta.
Along with a decrease in optical luminosity from the growth of dust grains, we can also expect to see a blue shifted asymmetry in the optical emission lines since dust in the ejecta would attenuate the receding red side of the SN more than the blue. First detected in SN 1987A (Lucy et al. 1989), evidence for dust formation has been seen in many CCSNe including SN 2003gd (Sugerman et al. 2006), SN 2004et (Kotak et al. 2009), SN 2005ip (Smith et al. 2009; Fox et al. 2010; Stritzinger et al. 2012; Bevan et al. 2019), SN 2006jd (Stritzinger et al. 2012), SN 2007od (Andrews et al. 2010; Inserra et al. 2011), SN 2010jl (Smith et al. 2012a; Gall et al. 2014) and one of the clearest cases SN 2006jc (Smith et al. 2008; Mattila et al. 2008). In conjunction with the emission line asymmetry and a decrease in the optical light curve, a corresponding increase in the IR luminosity is often observed as new dust grains form in the ejecta.
It is unlikely that dust has formed in SN 2017gmr by 150d for a few reasons. First, a blackbody fit to the optical and NIR spectroscopy and photometry around day 150 indicates a Tbb = 6800 K, a temperature much too high for grain condensation. Secondly, the bolometric lightcurve also shows a deviation from expected 56Co decay. If dust formation was occurring the lightcurves in individual bands will change, but the total bolometric lightcurve would be unchanged. Finally, as we mention above, the NIR spectroscopy during the early nebular phase fail to reveal the first overtone of CO (Fig. 13). Normally the detection of CO heralds the formation of dust (Gerardy et al. 2000; Sarangi & Cherchneff 2013). Therefore the blue-peaked hydrogen emission profiles and the fast decline in Lbol is likely due to other physical characteristics of the SN such as asymmetries and CSM interaction, not dust formation. This does not discount the possibility that in later epochs we may begin to see signatures of dust condensation in the ejecta.
VII Conclusions
SN 2017gmr is one of the more luminous Type II-P SNe discovered to date, with one of the largest measured 56Ni masses for a II-P event. Not only does it peak at MV = 18.3 mag, but by 150 days after explosion it has declined less than 3 mag in the -band. If the late-time luminosity is powered solely by radioactive decay, then the mass of 56Ni is 0.130 0.026 M☉, quite massive for a Type II-P SN. The line velocities are abnormally fast for a Type II-P event, which could be due to an extremely energetic explosion, asymmetries in the ejecta, or CSM interaction reionizing the faster, outer parts of the ejecta. The inferred progenitor radius is 500 R☉, on the lower end for a RSG, but within normally expected values.
CSM interaction is an efficient way to convert SN ejecta kinetic energy into radiative luminosity. The high luminosity of SN 2017gmr at late times and the bump in the early-time and lightcurves could both be the result of an added energy contribution from CSM interaction. The fact that no narrow lines are seen at early times could be due to the spherical ejecta quickly overtaking the asymmetric CSM, and the lack of narrow lines at late times only indicates that the SN shock has moved completely through the close-in CSM. In other words, all the slow moving CSM has been swept up by the shock. Low polarization during the plateau phase (Nagao et al. 2019) could also be explained by mostly spherical ejecta enveloping a dense, close-in asymmetric CSM. Since these CSM interaction photons are thermalized deep inside the opaque SN ejecta envelope, their polarization signature from asymmetric CSM would be erased. Asymmetric explosions producing jets or blobs of 56Ni could also create the asymmetric emission lines and the high line velocities.
SN 2017gmr was caught very young, and the collection of high-cadence multiwavelength data began immediately. This has allowed us the ability to not only explore the early behavior of Type II SNe, but the years of mass loss prior to explosion. More instances of early data are needed to understand both this mass loss, and the diversity among SNe in these early time properties. Either SN 2017gmr is an unusually energetic Type II-P SN explosions, or it has the assistance of CSM interaction and asymmetries to make it appear so. Continued observations of SN 2017gmr are ongoing and are necessary to help disentangle the various energy inputs and the overall geometry of this unique event.
References
- Anand et al. (2018) Anand, G. S., Rizzi, L., & Tully, R. B. 2018, AJ, 156, 105
- Anderson (2019) Anderson, J. P. 2019, arXiv e-prints, arXiv:1906.00761
- Anderson et al. (2014) Anderson, J. P., González-Gaitán, S., Hamuy, M., et al. 2014, ApJ, 786, 67
- Andrews & Smith (2018) Andrews, J. E., & Smith, N. 2018, MNRAS, 477, 74
- Andrews et al. (2017) Andrews, J. E., Smith, N., McCully, C., et al. 2017, MNRAS, 471, 4047
- Andrews et al. (2010) Andrews, J. E., Gallagher, J. S., Clayton, G. C., et al. 2010, ApJ, 715, 541
- Andrews et al. (2016) Andrews, J. E., Krafton, K. M., Clayton, G. C., et al. 2016, MNRAS, 457, 3241
- Appenzeller et al. (1998) Appenzeller, I., Fricke, K., Fürtig, W., et al. 1998, The Messenger, 94, 1
- Arcavi (2017) Arcavi, I. 2017, Hydrogen-Rich Core-Collapse Supernovae, ed. A. W. Alsabti & P. Murdin, 239
- Astropy Collaboration et al. (2013) Astropy Collaboration, Robitaille, T. P., Tollerud, E. J., et al. 2013, A&A, 558, A33
- Beasor & Davies (2018) Beasor, E. R., & Davies, B. 2018, MNRAS, 475, 55
- Benetti et al. (1994) Benetti, S., Patat, F., Turatto, M., et al. 1994, A&A, 285
- Bernstein et al. (2003) Bernstein, R., Shectman, S. A., Gunnels, S. M., Mochnacki, S., & Athey, A. E. 2003, in Proc. SPIE, Vol. 4841, Instrument Design and Performance for Optical/Infrared Ground-based Telescopes, ed. M. Iye & A. F. M. Moorwood, 1694–1704
- Bevan et al. (2019) Bevan, A., Wesson, R., Barlow, M. J., et al. 2019, MNRAS, 485, 5192
- Bilinski et al. (2015) Bilinski, C., Smith, N., Li, W., et al. 2015, MNRAS, 450, 246
- Bose et al. (2015a) Bose, S., Valenti, S., Misra, K., et al. 2015a, MNRAS, 450, 2373
- Bose et al. (2015b) Bose, S., Sutaria, F., Kumar, B., et al. 2015b, ApJ, 806, 160
- Bose et al. (2019) Bose, S., Dong, S., Elias-Rosa, N., et al. 2019, ApJ, 873, L3
- Branch & Wheeler (2017) Branch, D., & Wheeler, J. C. 2017, Supernova Explosions, doi:10.1007/978-3-662-55054-0
- Breeveld et al. (2011) Breeveld, A. A., Landsman, W., Holland, S. T., et al. 2011, in American Institute of Physics Conference Series, Vol. 1358, American Institute of Physics Conference Series, ed. J. E. McEnery, J. L. Racusin, & N. Gehrels, 373–376
- Brown et al. (2014) Brown, P. J., Breeveld, A. A., Holland, S., Kuin, P., & Pritchard, T. 2014, Ap&SS, 354, 89
- Brown et al. (2009) Brown, P. J., Holland, S. T., Immler, S., et al. 2009, AJ, 137, 4517
- Brown et al. (2013) Brown, T. M., Baliber, N., Bianco, F. B., et al. 2013, PASP, 125, 1031. https://doi.org/10.1086%2F673168
- Bullivant et al. (2018) Bullivant, C., Smith, N., Williams, G. G., et al. 2018, MNRAS, 476, 1497
- Cardelli et al. (1989) Cardelli, J. A., Clayton, G. C., & Mathis, J. S. 1989, ApJ, 345, 245
- Chonis et al. (2016) Chonis, T. S., Hill, G. J., Lee, H., et al. 2016, in Society of Photo-Optical Instrumentation Engineers (SPIE) Conference Series, Vol. 9908, Ground-based and Airborne Instrumentation for Astronomy VI, 99084C
- Chugai et al. (2005) Chugai, N. N., Fabrika, S. N., Sholukhova, O. N., et al. 2005, Astronomy Letters, 31, 792
- Clemens et al. (2004) Clemens, J. C., Crain, J. A., & Anderson, R. 2004, in Society of Photo-Optical Instrumentation Engineers (SPIE) Conference Series, Vol. 5492, Ground-based Instrumentation for Astronomy, ed. A. F. M. Moorwood & M. Iye, 331–340
- Cushing et al. (2004) Cushing, M. C., Vacca, W. D., & Rayner, J. T. 2004, PASP, 116, 362
- Dastidar et al. (2018) Dastidar, R., Misra, K., Hosseinzadeh, G., et al. 2018, MNRAS, 479, 2421
- Dastidar et al. (2019) Dastidar, R., Misra, K., Singh, M., et al. 2019, MNRAS, 486, 2850
- Davies & Dessart (2019) Davies, B., & Dessart, L. 2019, MNRAS, 483, 887
- de Jaeger et al. (2017) de Jaeger, T., González-Gaitán, S., Hamuy, M., et al. 2017, ApJ, 835, 166
- de Jaeger et al. (2018a) de Jaeger, T., Anderson, J. P., Galbany, L., et al. 2018a, MNRAS, 476, 4592
- de Jaeger et al. (2018b) de Jaeger, T., Galbany, L., Gutiérrez, C. P., et al. 2018b, MNRAS, 478, 3776
- de Mink et al. (2014) de Mink, S. E., Sana, H., Langer, N., Izzard, R. G., & Schneider, F. R. N. 2014, ApJ, 782, 7
- Dessart & Hillier (2005a) Dessart, L., & Hillier, D. J. 2005a, A&A, 437, 667
- Dessart & Hillier (2005b) —. 2005b, A&A, 439, 671
- Dessart & Hillier (2011) —. 2011, MNRAS, 415, 3497
- Dressler et al. (2011) Dressler, A., Bigelow, B., Hare, T., et al. 2011, PASP, 123, 288
- Elias et al. (2006) Elias, J. H., Joyce, R. R., Liang, M., et al. 2006, in Proc. SPIE, Vol. 6269, Society of Photo-Optical Instrumentation Engineers (SPIE) Conference Series, 62694C
- Elias-Rosa et al. (2016) Elias-Rosa, N., Pastorello, A., Benetti, S., et al. 2016, MNRAS, 463, 3894
- Elias-Rosa et al. (2017) Elias-Rosa, N., Pursimo, T., Korhonen, H., et al. 2017, The Astronomer’s Telegram, 10746
- Elmhamdi et al. (2003a) Elmhamdi, A., Chugai, N. N., & Danziger, I. J. 2003a, A&A, 404, 1077
- Elmhamdi et al. (2003b) Elmhamdi, A., Danziger, I. J., Chugai, N., et al. 2003b, MNRAS, 338, 939
- Faran et al. (2014) Faran, T., Poznanski, D., Filippenko, A. V., et al. 2014, MNRAS, 442, 844
- Filippenko (1982) Filippenko, A. V. 1982, PASP, 94, 715
- Förster et al. (2018) Förster, F., Moriya, T. J., Maureira, J. C., et al. 2018, Nature Astronomy, 2, arXiv:1809.06379
- Fox et al. (2010) Fox, O. D., Chevalier, R. A., Dwek, E., et al. 2010, ApJ, 725, 1768
- Fraser et al. (2013) Fraser, M., Magee, M., Kotak, R., et al. 2013, ApJ, 779, L8
- Fuller (2017) Fuller, J. 2017, MNRAS, 470, 1642
- Gal-Yam (2017) Gal-Yam, A. 2017, Observational and Physical Classification of Supernovae, ed. A. W. Alsabti & P. Murdin, 195
- Gal-Yam & Leonard (2009) Gal-Yam, A., & Leonard, D. C. 2009, Nature, 458, 865
- Gal-Yam et al. (2007) Gal-Yam, A., Leonard, D. C., Fox, D. B., et al. 2007, ApJ, 656, 372
- Gal-Yam et al. (2014) Gal-Yam, A., Arcavi, I., Ofek, E. O., et al. 2014, Nature, 509, 471
- Galbany et al. (2016) Galbany, L., Hamuy, M., Phillips, M. M., et al. 2016, AJ, 151, 33
- Gall et al. (2014) Gall, C., Hjorth, J., Watson, D., et al. 2014, Nature, 511, 326
- Gall et al. (2018) Gall, E. E. E., Kotak, R., Leibundgut, B., et al. 2018, A&A, 611, A25
- Gehrels et al. (2004) Gehrels, N., Chincarini, G., Giommi, P., et al. 2004, ApJ, 611, 1005
- Gerardy et al. (2000) Gerardy, C. L., Fesen, R. A., Höflich, P., & Wheeler, J. C. 2000, AJ, 119, 2968
- Goldman et al. (2017) Goldman, S. R., van Loon, J. T., Zijlstra, A. A., et al. 2017, MNRAS, 465, 403
- González-Gaitán et al. (2015) González-Gaitán, S., Tominaga, N., Molina, J., et al. 2015, MNRAS, 451, 2212
- Groh et al. (2014) Groh, J. H., Meynet, G., Ekström, S., & Georgy, C. 2014, A&A, 564, A30
- Gutiérrez et al. (2017a) Gutiérrez, C. P., Anderson, J. P., Hamuy, M., et al. 2017a, ApJ, 850, 89
- Gutiérrez et al. (2017b) —. 2017b, ApJ, 850, 90
- Hamuy (2003a) Hamuy, M. 2003a, ApJ, 582, 905
- Hamuy (2003b) —. 2003b, ApJ, 582, 905
- Hamuy (2005) Hamuy, M. 2005, in IAU Colloq. 192: Cosmic Explosions, On the 10th Anniversary of SN1993J, ed. J.-M. Marcaide & K. W. Weiler, 535
- Hamuy & Pinto (2002) Hamuy, M., & Pinto, P. A. 2002, ApJ, 566, L63
- Hamuy et al. (2001) Hamuy, M., Pinto, P. A., Maza, J., et al. 2001, ApJ, 558, 615
- Hendry et al. (2005) Hendry, M. A., Smartt, S. J., Maund, J. R., et al. 2005, MNRAS, 359, 906
- Hoffman et al. (2008) Hoffman, J. L., Leonard, D. C., Chornock, R., et al. 2008, ApJ, 688, 1186
- Hosseinzadeh (2019) Hosseinzadeh, G. 2019, Light Curve Fitting, , , doi:10.5281/zenodo.2639464. https://doi.org/10.5281/zenodo.2639464
- Hosseinzadeh et al. (2018) Hosseinzadeh, G., Valenti, S., McCully, C., et al. 2018, ApJ, 861, 63
- Hsiao et al. (2019) Hsiao, E. Y., Phillips, M. M., Marion, G. H., et al. 2019, PASP, 131, 014002
- Huang et al. (2016) Huang, F., Wang, X., Zampieri, L., et al. 2016, ApJ, 832, 139
- Huang et al. (2018a) Huang, F., Wang, X.-F., Hosseinzadeh, G., et al. 2018a, MNRAS, 475, 3959
- Huang et al. (2018b) —. 2018b, MNRAS, 475, 3959
- Inserra et al. (2011) Inserra, C., Turatto, M., Pastorello, A., et al. 2011, MNRAS, 417, 261
- Jerkstrand et al. (2012) Jerkstrand, A., Fransson, C., Maguire, K., et al. 2012, A&A, 546, A28
- Khazov et al. (2016) Khazov, D., Yaron, O., Gal-Yam, A., et al. 2016, ApJ, 818, 3
- Kilpatrick et al. (2016) Kilpatrick, C. D., Andrews, J. E., Smith, N., et al. 2016, MNRAS, 463, 1088
- Kiminki & Kobulnicky (2012) Kiminki, D. C., & Kobulnicky, H. A. 2012, ApJ, 751, 4
- Kirshner & Kwan (1974) Kirshner, R. P., & Kwan, J. 1974, ApJ, 193, 27
- Koribalski et al. (2004) Koribalski, B. S., Staveley-Smith, L., Kilborn, V. A., et al. 2004, AJ, 128, 16
- Kotak et al. (2009) Kotak, R., Meikle, W. P. S., Farrah, D., et al. 2009, ApJ, 704, 306
- Leonard et al. (2000) Leonard, D. C., Filippenko, A. V., Barth, A. J., & Matheson, T. 2000, ApJ, 536, 239
- Leonard et al. (2002) Leonard, D. C., Filippenko, A. V., Gates, E. L., et al. 2002, PASP, 114, 35
- Leonard et al. (2006) Leonard, D. C., Filippenko, A. V., Ganeshalingam, M., et al. 2006, Nature, 440, 505
- Levesque (2017) Levesque, E. M. 2017, Astrophysics of Red Supergiants, doi:10.1088/978-0-7503-1329-2
- Lucy et al. (1989) Lucy, L. B., Danziger, I. J., Gouiffes, C., & Bouchet, P. 1989, in Lecture Notes in Physics, Berlin Springer Verlag, Vol. 350, IAU Colloq. 120: Structure and Dynamics of the Interstellar Medium, ed. G. Tenorio-Tagle, M. Moles, & J. Melnick, 164
- Maeda et al. (2008) Maeda, K., Kawabata, K., Mazzali, P. A., et al. 2008, Science, 319, 1220
- Maguire et al. (2010) Maguire, K., Di Carlo, E., Smartt, S. J., et al. 2010, MNRAS, 404, 981
- Mattila et al. (2008) Mattila, S., Meikle, W. P. S., Lundqvist, P., et al. 2008, MNRAS, 389, 141
- Mauerhan & Smith (2012) Mauerhan, J., & Smith, N. 2012, MNRAS, 424, 2659
- Mauerhan et al. (2014) Mauerhan, J., Williams, G. G., Smith, N., et al. 2014, MNRAS, 442, 1166
- Mauerhan et al. (2013) Mauerhan, J. C., Smith, N., Filippenko, A. V., et al. 2013, MNRAS, 430, 1801
- Mauron & Josselin (2011) Mauron, N., & Josselin, E. 2011, A&A, 526, A156
- Mazzali et al. (2005) Mazzali, P. A., Kawabata, K. S., Maeda, K., et al. 2005, Science, 308, 1284
- Moe & Di Stefano (2017) Moe, M., & Di Stefano, R. 2017, ApJS, 230, 15
- Montargès et al. (2018) Montargès, M., Norris, R., Chiavassa, A., et al. 2018, A&A, 614, A12
- Moorwood et al. (1998) Moorwood, A., Cuby, J. G., Biereichel, P., et al. 1998, The Messenger, 94, 7
- Moriya et al. (2018) Moriya, T. J., Förster, F., Yoon, S.-C., Gräfener, G., & Blinnikov, S. I. 2018, MNRAS, 476, 2840
- Morozova et al. (2017) Morozova, V., Piro, A. L., & Valenti, S. 2017, ApJ, 838, 28
- Morozova et al. (2018) —. 2018, ApJ, 858, 15
- Müller et al. (2017) Müller, T., Prieto, J. L., Pejcha, O., & Clocchiatti, A. 2017, ApJ, 841, 127
- Nicholl (2018) Nicholl, M. 2018, Research Notes of the AAS, 2, 230. http://stacks.iop.org/2515-5172/2/i=4/a=230
- Nicholl et al. (2016) Nicholl, M., Berger, E., Smartt, S. J., et al. 2016, ApJ, 826, 39
- Niemela et al. (1985) Niemela, V. S., Ruiz, M. T., & Phillips, M. M. 1985, ApJ, 289, 52
- Nugent et al. (2006) Nugent, P., Sullivan, M., Ellis, R., et al. 2006, ApJ, 645, 841
- Ofek et al. (2013) Ofek, E. O., Sullivan, M., Cenko, S. B., et al. 2013, Nature, 494, 65
- Ofek et al. (2014) Ofek, E. O., Sullivan, M., Shaviv, N. J., et al. 2014, ApJ, 789, 104
- Pejcha & Prieto (2015) Pejcha, O., & Prieto, J. L. 2015, ApJ, 799, 215
- Phillips et al. (2013) Phillips, M. M., Simon, J. D., Morrell, N., et al. 2013, ApJ, 779, 38
- Poznanski et al. (2012) Poznanski, D., Prochaska, J. X., & Bloom, J. S. 2012, MNRAS, 426, 1465
- Poznanski et al. (2009) Poznanski, D., Butler, N., Filippenko, A. V., et al. 2009, ApJ, 694, 1067
- Prabhu & Anupama (2010) Prabhu, T. P., & Anupama, G. C. 2010, in Astronomical Society of India Conference Series, Vol. 1, Astronomical Society of India Conference Series
- Pursimo et al. (2017) Pursimo, T., Elias-Rosa, N., Dennefeld, M., et al. 2017, The Astronomer’s Telegram, 10717
- Quimby et al. (2007) Quimby, R. M., Wheeler, J. C., Höflich, P., et al. 2007, ApJ, 666, 1093
- Rayner et al. (2003) Rayner, J. T., Toomey, D. W., Onaka, P. M., et al. 2003, PASP, 115, 362
- Reguitti et al. (2019) Reguitti, A., Pastorello, A., Pignata, G., et al. 2019, MNRAS, 482, 2750
- Reichart et al. (2005) Reichart, D., Nysewander, M., Moran, J., et al. 2005, Nuovo Cimento C Geophysics Space Physics C, 28, 767
- Rho et al. (2018) Rho, J., Geballe, T. R., Banerjee, D. P. K., et al. 2018, ApJ, 864, L20
- Riess et al. (2018) Riess, A. G., Casertano, S., Yuan, W., et al. 2018, ApJ, 861, 126
- Rodríguez et al. (2019) Rodríguez, Ó., Pignata, G., Hamuy, M., et al. 2019, MNRAS, 483, 5459
- Rubin & Gal-Yam (2017) Rubin, A., & Gal-Yam, A. 2017, ApJ, 848, 8
- Rubin et al. (2016) Rubin, A., Gal-Yam, A., De Cia, A., et al. 2016, ApJ, 820, 33
- Rui et al. (2019) Rui, L., Wang, X., Mo, J., et al. 2019, MNRAS, 485, 1990
- Sagar (1999) Sagar, R. 1999, Current Science, 77, 643
- Sagar et al. (2012) Sagar, R., Kumar, B., Omar, A., & Joshi, Y. C. 2012, in Astronomical Society of India Conference Series, Vol. 4, Astronomical Society of India Conference Series, 173
- Sahu et al. (2006) Sahu, D. K., Anupama, G. C., Srividya, S., & Muneer, S. 2006, MNRAS, 372, 1315
- Sana et al. (2012) Sana, H., de Mink, S. E., de Koter, A., et al. 2012, Science, 337, 444
- Sand et al. (2016) Sand, D. J., Hsiao, E. Y., Banerjee, D. P. K., et al. 2016, ApJ, 822, L16
- Sapir & Waxman (2017) Sapir, N., & Waxman, E. 2017, ApJ, 838, 130
- Sarangi & Cherchneff (2013) Sarangi, A., & Cherchneff, I. 2013, ApJ, 776, 107
- Sarangi et al. (2018) Sarangi, A., Matsuura, M., & Micelotta, E. R. 2018, Space Sci. Rev., 214, 63
- Schlafly & Finkbeiner (2011) Schlafly, E. F., & Finkbeiner, D. P. 2011, ApJ, 737, 103
- Schlegel (1990) Schlegel, E. M. 1990, MNRAS, 244, 269
- SDSS Collaboration et al. (2016) SDSS Collaboration, Albareti, F. D., Allende Prieto, C., et al. 2016, arXiv:1608.02013
- Shiode & Quataert (2014) Shiode, J. H., & Quataert, E. 2014, ApJ, 780, 96
- Shivvers et al. (2015) Shivvers, I., Groh, J. H., Mauerhan, J. C., et al. 2015, ApJ, 806, 213
- Simcoe et al. (2013) Simcoe, R. A., Burgasser, A. J., Schechter, P. L., et al. 2013, PASP, 125, 270
- Singh et al. (2018) Singh, A., Srivastav, S., Kumar, B., Anupama, G. C., & Sahu, D. K. 2018, MNRAS, 480, 2475
- Smartt et al. (2009) Smartt, S. J., Eldridge, J. J., Crockett, R. M., & Maund, J. R. 2009, MNRAS, 395, 1409
- Smartt et al. (2015) Smartt, S. J., Valenti, S., Fraser, M., et al. 2015, A&A, 579, A40
- Smith (2014) Smith, N. 2014, ARA&A, 52, 487
- Smith (2017) —. 2017, Interacting Supernovae: Types IIn and Ibn, ed. A. W. Alsabti & P. Murdin, 403
- Smith & Arnett (2014) Smith, N., & Arnett, W. D. 2014, ApJ, 785, 82
- Smith et al. (2008) Smith, N., Foley, R. J., & Filippenko, A. V. 2008, ApJ, 680, 568
- Smith et al. (2011a) Smith, N., Li, W., Filippenko, A. V., & Chornock, R. 2011a, MNRAS, 412, 1522
- Smith et al. (2011b) Smith, N., Li, W., Silverman, J. M., Ganeshalingam, M., & Filippenko, A. V. 2011b, MNRAS, 415, 773
- Smith et al. (2012a) Smith, N., Silverman, J. M., Filippenko, A. V., et al. 2012a, AJ, 143, 17
- Smith et al. (2009) Smith, N., Silverman, J. M., Chornock, R., et al. 2009, ApJ, 695, 1334
- Smith et al. (2012b) Smith, N., Cenko, S. B., Butler, N., et al. 2012b, MNRAS, 420, 1135
- Smith et al. (2015) Smith, N., Mauerhan, J. C., Cenko, S. B., et al. 2015, MNRAS, 449, 1876
- Stetson (1987) Stetson, P. B. 1987, PASP, 99, 191
- Stetson (2000) —. 2000, PASP, 112, 925
- Stritzinger et al. (2012) Stritzinger, M., Taddia, F., Fransson, C., et al. 2012, ApJ, 756, 173
- Strotjohann et al. (2015) Strotjohann, N. L., Ofek, E. O., Gal-Yam, A., et al. 2015, ApJ, 811, 117
- Sugerman et al. (2006) Sugerman, B. E. K., Ercolano, B., Barlow, M. J., et al. 2006, Science, 313, 196
- Szalai et al. (2019) Szalai, T., Vinkó, J., Könyves-Tóth, R., et al. 2019, ApJ, 876, 19
- Takáts & Vinkó (2006) Takáts, K., & Vinkó, J. 2006, MNRAS, 372, 1735
- Tartaglia et al. (2016) Tartaglia, L., Pastorello, A., Sullivan, M., et al. 2016, MNRAS, 459, 1039
- Tartaglia et al. (2018) Tartaglia, L., Sand, D. J., Valenti, S., et al. 2018, ApJ, 853, 62
- Taubenberger et al. (2009) Taubenberger, S., Valenti, S., Benetti, S., et al. 2009, MNRAS, 397, 677
- Terreran et al. (2016) Terreran, G., Jerkstrand, A., Benetti, S., et al. 2016, MNRAS, 462, 137
- The Astropy Collaboration et al. (2018) The Astropy Collaboration, Price-Whelan, A. M., Sipőcz, B. M., et al. 2018, ArXiv e-prints, arXiv:1801.02634
- Tinyanont et al. (2019) Tinyanont, S., Kasliwal, M. M., Krafton, K., et al. 2019, ApJ, 873, 127
- Tomasella et al. (2013) Tomasella, L., Cappellaro, E., Fraser, M., et al. 2013, MNRAS, 434, 1636
- Turatto (2003) Turatto, M. 2003, in Lecture Notes in Physics, Berlin Springer Verlag, Vol. 598, Supernovae and Gamma-Ray Bursters, ed. K. Weiler, 21–36
- Vacca et al. (2003) Vacca, W. D., Cushing, M. C., & Rayner, J. T. 2003, PASP, 115, 389
- Valenti et al. (2017) Valenti, S., Tartaglia, L., Sand, D., et al. 2017, The Astronomer’s Telegram, 10706
- Valenti et al. (2014) Valenti, S., Sand, D., Pastorello, A., et al. 2014, MNRAS, 438, L101
- Valenti et al. (2016) Valenti, S., Howell, D. A., Stritzinger, M. D., et al. 2016, MNRAS, 459, 3939
- Van Dyk et al. (2003) Van Dyk, S. D., Li, W., & Filippenko, A. V. 2003, PASP, 115, 1
- Van Dyk et al. (2019) Van Dyk, S. D., Zheng, W., Maund, J. R., et al. 2019, ApJ, 875, 136
- Vinkó et al. (2006) Vinkó, J., Takáts, K., Sárneczky, K., et al. 2006, MNRAS, 369, 1780
- Vinkó et al. (2012) Vinkó, J., Sárneczky, K., Takáts, K., et al. 2012, A&A, 546, A12
- Vogt et al. (1994) Vogt, S. S., Allen, S. L., Bigelow, B. C., et al. 1994, in Proc. SPIE, Vol. 2198, Instrumentation in Astronomy VIII, ed. D. L. Crawford & E. R. Craine, 362
- Williams et al. (2008) Williams, G. G., Milne, P. A., Park, H. S., et al. 2008, in American Institute of Physics Conference Series, Vol. 1000, American Institute of Physics Conference Series, ed. M. Galassi, D. Palmer, & E. Fenimore, 535–538
- Wittkowski et al. (2017) Wittkowski, M., Arroyo-Torres, B., Marcaide, J. M., et al. 2017, A&A, 597, A9
- Woosley et al. (1989) Woosley, S. E., Pinto, P. A., & Hartmann, D. 1989, ApJ, 346, 395
- Yaron & Gal-Yam (2012) Yaron, O., & Gal-Yam, A. 2012, PASP, 124, 668
- Yaron et al. (2017) Yaron, O., Perley, D. A., Gal-Yam, A., et al. 2017, Nature Physics, 13, 510
- Yuan et al. (2016) Yuan, F., Jerkstrand, A., Valenti, S., et al. 2016, MNRAS, 461, 2003
Appendix A Photometry
A.1 UV and Optical
Photometric data for SN 2017gmr was obtained from a variety of telescopes (see Section II), resulting in an extremely high cadence optical light curve (Figure 4), as well as an early time Swift UV+optical light curve (Figure 6). We briefly describe the instrumentation and data reduction techniques here, although if a telescope+instrument combination is not specifically mentioned, the data was reduced in a ‘standard’ way, including: image detrending (bias subtraction and flat fielding), cosmic ray removal, PSF or aperture photometry, along with flux calibration performed against standard catalogs (e.g. Landolt standard stars or the SDSS). The full ground-based optical data set is presented in Table 1, while the Swift data is presented in Table 2.
| MJD | Phase | Magnitude | Error | Telescope |
|---|---|---|---|---|
| 58000.276 | +1.19 | 14.44 | 0.05 | LCO-1m |
| 58000.280 | +1.19 | 14.37 | 0.04 | LCO-1m |
| 58000.358 | +1.27 | 14.11 | 0.02 | LCO-1m |
| 58000.362 | +1.27 | 14.11 | 0.02 | LCO-1m |
| 58000.631 | +1.54 | 13.90 | 0.03 | LCO-1m |
| 58000.635 | +1.54 | 13.90 | 0.03 | LCO-1m |
| 58000.984 | +1.89 | 13.87 | 0.05 | LCO-1m |
| 58000.987 | +1.89 | 13.94 | 0.03 | LCO-1m |
| 58001.115 | +2.03 | 13.89 | 0.03 | LCO-1m |
| 58001.119 | +2.03 | 13.91 | 0.03 | LCO-1m |
Note. — Phases are reported with respect to an assumed explosion epoch of MJD 57999.09. Table 1 is published in its entirety in the machine-readable format. A portion is shown here for guidance regarding its form and content.
| MJD | Phase | Magnitude | Error |
|---|---|---|---|
| 58001.626 | +2.5 | 13.80 | 0.07 |
| 58002.767 | +3.7 | 14.05 | 0.07 |
| 58003.565 | +4.5 | 14.26 | 0.20 |
| 58008.442 | +9.3 | 15.26 | 0.08 |
| 58001.606 | +2.5 | 13.97 | 0.15 |
| 58002.771 | +3.7 | 14.20 | 0.06 |
| 58003.569 | +4.5 | 14.40 | 0.06 |
| 58008.313 | +9.2 | 15.03 | 0.07 |
| 58001.622 | +2.5 | 13.60 | 0.07 |
| 58002.764 | +3.7 | 13.71 | 0.08 |
| 58003.562 | +4.5 | 13.78 | 0.07 |
| 58008.441 | +9.3 | 14.27 | 0.20 |
| 58001.623 | +2.5 | 13.58 | 0.05 |
| 58002.766 | +3.7 | 13.60 | 0.05 |
| 58003.563 | +4.5 | 13.62 | 0.05 |
| 58008.442 | +9.3 | 13.70 | 0.05 |
| 58001.624 | +2.5 | 14.81 | 0.30 |
| 58002.766 | +3.7 | 14.70 | 0.14 |
| 58003.563 | +4.5 | 14.65 | 0.12 |
| 58008.442 | +9.3 | 14.62 | 0.10 |
| 58001.596 | +2.5 | 14.52 | 0.08 |
| 58002.769 | +3.7 | 14.43 | 0.07 |
| 58003.567 | +4.5 | 14.51 | 0.07 |
| 58008.312 | +9.2 | 14.25 | 0.17 |
Note. — Phases are reported with respect to an assumed explosion epoch of MJD 57999.09.
First, continued monitoring of SN 2017gmr was done by the DLT40 survey’s two discovery telescopes, the PROMPT5 0.4-m telescope at Cerro Tololo Inter-American Observatory and the PROMPT-MO 0.4-m telescope at Meckering Observatory in Australia, operated by the Skynet telescope network (Reichart et al. 2005). The PROMPT5 telescope has no filter (‘Open’) while the PROMPT-MO telescope has a broadband ‘Clear’ filter, both of which we calibrate to the Sloan Digital Sky Survey band (see Tartaglia et al. 2018, for further reduction details).
Las Cumbres Observatory -band data were obtained with the Sinistro cameras on the 1-m telescopes, through the Global Supernova Project. Using lcogtsnpipe (Valenti et al. 2016), a PyRAF-based photometric reduction pipeline, PSF fitting was performed. -band data were calibrated to Vega magnitudes (Stetson 2000) using standard fields observed on the same night by the same telescope. Finally, -band data were calibrated to AB magnitudes using the Sloan Digital Sky Survey (SDSS Collaboration et al. 2016, SDSS,). Because the Las Cumbres data is the most comprehensive, and there are differences across the instrument/filter pairs, all other datasets were shifted by small amounts to match the Las Cumbres magnitudes in Figure 4. These values ranged between 0.05 and 0.15 magnitudes. The non-shifted values are all included in Table 1.
Optical photometry in the bands was obtained at the 60/90cm Schmidt-telescopes at Konkoly Observatory; see Vinkó et al. 2012 for a description of the instrumentation and data reduction techniques. Further, photometry was obtained with the Super-LOTIS (Williams et al. 2008, Livermore Optical Transient Imaging System;) 0.6 m telescope at Kitt Peak National Observatory; these data were reduced in a manner similar to that described in Kilpatrick et al. 2016 and PSF photometry using standard IRAF procedures was then done on the resultant images.
Data in the bands were taken with the IO:O imager on the Liverpool telescope, and were reduced using the standard IO:O pipeline; aperture photometry was performed using custom python scripts and pyraf. The data were shifted 0.17 mag in to match the Las Cumbres data. Data from the 1.30-m DFOT and 2.01 HCT telescopes were reduced as described in Dastidar et al. 2019 performing PSF fitting photometry using DAOPHOT II (Stetson 1987). Instrumental magnitudes were converted to standard magnitudes using a set of local standard stars, and observations of either Landolt standard or SDSS fields.
The Swift UVOT analysis uses the pipeline of the Swift Optical/Ultraviolet Supernova Archive22 2 http://swift.gsfc.nasa.gov/docs/swift/sne/swift_sn.html (SOUSA; Brown et al. 2014). The method is based on that of Brown et al. 2009, including subtraction of the host galaxy count rates, and uses the revised UV zeropoints and time-dependent sensitivity from Breeveld et al. 2011. For SN 2017gmr we do not have template images to subtract the underlying galaxy flux. In this case, however, the largest contributor to the background is scattered/reflected light from the nearby bright star evident in Figure 1. The reported UVOT magnitudes use a background position which to the eye approximated the brightness of the galaxy and halo at the SN position. The errors have been conservatively increased to match the range of magnitudes measured with a variety of halo-free and bright halo regions. The full Swift data set is presented in Table 2 and is plotted in Figure 6.
A.2 Near Infrared
Raw NIR data from NOTCam was reduced using the NOTCam Quicklook reduction package and PSF photometry was then performed using standard IRAF procedures. The REM telescope is equipped with an optical and an IR camera, which observes simultaneously the same field, thanks to a dichroic placed before the telescope focal plane. IR images were corrected for dark current and flat fielded, and subsequently median stacked to obtain a background frame for each filter. The background-subtracted images were geometrically aligned and then stacked to obtain a final image for each filter, and the background in the locations of SN 2017gmr was modeled with a low order polynomial surface and subtracted. The flux of the SN and the local sequence was measured through PSF fitting. For both instruments, photometric calibration was done using 2MASS stars in the field. The resulting dataset can be found in Table 3.
| MJD | |||
| NOT | |||
| 58005.5 | 13.84 0.05 | 13.77 0.07 | 13.94 0.12 |
| 58025.3 | 13.13 0.05 | 12.91 0.07 | 12.70 0.12 |
| 58042.5 | 13.08 0.05 | 12.84 0.07 | 12.86 0.12 |
| 58121.1 | 14.43 0.05 | 14.18 0.07 | 14.19 0.12 |
| 58140.5 | 14.72 0.05 | 14.63 0.07 | 14.67 0.12 |
| 58165.8 | 15.27 0.05 | 15.19 0.07 | 15.23 0.12 |
| REM | |||
| 58012.26 | 13.23 0.03 | 13.09 0.03 | 12.88 0.06 |
| 58017.32 | 13.23 0.03 | 13.05 0.03 | 12.87 0.06 |
| 58021.31 | 13.26 0.03 | 12.96 0.03 | 12.84 0.03 |
| 58022.31 | 14.21 0.03 | 12.97 0.03 | 12.77 0.22 |
| 58027.25 | 13.03 0.04 | 12.81 0.04 | – |
| 58073.12 | 13.09 0.04 | 12.79 0.05 | – |
| 58083.06 | 13.23 0.03 | 12.98 0.04 | – |
| 58093.07 | 13.59 0.03 | 13.35 0.04 | – |
| 58109.21 | 14.28 0.04 | 14.05 0.05 | – |
Appendix B Spectroscopy
B.1 Optical Spectroscopy
A high cadence spectral sequence of SN 2017gmr was taken with low, medium and high -resolution instrumentation throughout the rise, plateau, and fall from plateau of the supernova. A log of these observations can be found in Table 4. These spectra were reduced using standard techniques, including bias subtraction, flat fielding, cosmic ray rejection, local sky subtraction and extraction of one-dimensional spectra. Most observations had the slit aligned along the parallactic angle to minimize differential light losses. Flux calibration was done with standard star observations, and most spectra were rescaled to match the photometric light curve at a given epoch. We discuss some details of the spectroscopic reductions below, but if a particular telescope+instrument combination is not mentioned, it was reduced in a standard way as described above.
Las Cumbres optical spectra were taken with the FLOYDS spectrographs mounted on the 2m Faulkes Telescope North and South at Haleakala, USA and Siding Spring, Australia, respectively, through the Global Supernova Project. A 2 slit was placed on the target at the parallactic angle. One-dimensional spectra were extracted, reduced, and calibrated following standard procedures using the FLOYDS pipeline (Valenti et al. 2014).HIRES spectra were reduced using the MAuna Kea Echelle Extraction (MAKEE) data reduction package33 3 http://spider.ipac.caltech.edu/staff/tab/makee/ (written by T. Barlow). MIKE spectra were reduced using the latest version of the MIKE pipeline44 4 http://code.obs.carnegiescience.edu/mike/ (written by D. Kelson).
B.2 NIR Spectroscopy
A sequence of NIR spectra of SN 2017gmr were also taken, and are logged in Table 5. All NIR spectra were taken using a classical ABBA technique, dithering the object along the slit in order to facilitate good sky subtraction. Further, the slit was oriented along the parallactic angle to minimize slit losses due to atmospheric differential refraction (Filippenko 1982). In all cases, an A0V star was observed either before or after the science observations in order to correct for telluric absorption and flux calibrate the data, following the prescriptions of Vacca et al. 2003.
Gemini/GNIRS data was taken in cross-dispersed mode with the 0.675 slit, yielding continuous wavelength coverage from 0.8 to 2.5 m and an 1000. These data were reduced with the XDGNIRS pipeline provided by Gemini Observatory, as described in Sand et al. 2016; Hsiao et al. 2019.
IRTF spectra were taken in SXD mode and the 0.5 arcsec slit, yielding wavelength coverage from 0.8–2.4 m and 1200. These data were reduced using the publicly available Spextool software package (Cushing et al. 2004), as described in Hsiao et al. 2019.
Two NIR spectra were taken with the Son OF ISAAC (SOFI) spectrograph mounted on the NTT telescope (Moorwood et al. 1998), using both the Blue and Red grisms, giving a broad wavelength coverage of 0.9–2.4 m. The SOFI spectra were taken as part of the ePESSTO program, and were reduced as described in Smartt et al. 2015.
Finally, a single FIRE spectrum was taken using the high throughput prism mode with a 0.6 arcsec slit, giving continuous wavelength coverage from 0.8–2.5 m and a resolution of 500 in the band. The spectrum was reduced with the purpose-built firehose pipeline (Simcoe et al. 2013) as described in detail in Hsiao et al. 2019.
| UT Date | MJD | Phase | Telescope+ | R | Exposure Time |
|---|---|---|---|---|---|
| (y-m-d) | (days) | Instrument | / | (s) | |
| 2017-09-04 | 58000.57 | 1.5 | FTS+FLOYDS | 500 | 2700 |
| 2017-09-04 | 58000.59 | 1.5 | Keck+HIRES | 50000 | 3900 |
| 2017-09-05 | 58001.34 | 2.2 | SOAR+Goodman | 500 | 900 |
| 2017-09-05 | 58001.43 | 2.3 | HET+LRS2B | 1100 | 1000 |
| 2017-09-05 | 58001.62 | 2.5 | FTS+FLOYDS | 500 | 2700 |
| 2017-09-06 | 58002.19 | 3.1 | INT+IDS | 300 | 2900 |
| 2017-09-08 | 58004.19 | 5.1 | INT+IDS | 300 | 1200 |
| 2017-09-08 | 58004.35 | 5.3 | Mag+IMACS | 4000 | 300 |
| 2017-09-08 | 58004.44 | 5.4 | HET+LRS2B | 1100 | 1000 |
| 2017-09-08 | 58004.55 | 5.5 | HCT+HFOSC | 350 | 21200 |
| 2017-09-08 | 58004.56 | 5.5 | FTS+FLOYDS | 500 | 2700 |
| 2017-09-10 | 58006.19 | 7.1 | NOT+ALFOSC | 300 | 900 |
| 2017-09-10 | 58006.76 | 7.7 | FTS+FLOYDS | 500 | 2700 |
| 2017-09-11 | 58007.31 | 8.2 | NTT+EFOSC2 | 200 | 600 |
| 2017-09-11 | 58007.41 | 8.3 | HET+LRS2B | 1100 | 1000 |
| 2017-09-12 | 58008.50 | 9.4 | FTN+FLOYDS | 500 | 2700 |
| 2017-09-12 | 58008.50 | 9.4 | Bok+BC | 700 | 3120 |
| 2017-09-15 | 58011.47 | 12.4 | FTN+FLOYDS | 500 | 2700 |
| 2017-09-16 | 58012.13 | 13.0 | NOT+ALFOSC | 300 | 2300 |
| 2017-09-16 | 58012.69 | 13.6 | FTS+FLOYDS | 500 | 2700 |
| 2017-09-18 | 58014.53 | 15.4 | FTN+FLOYDS | 500 | 2700 |
| 2017-09-19 | 58015.78 | 16.7 | BAO+BFOSC | 500 | 2400 |
| 2017-09-22 | 58018.06 | 19.0 | NOT+ALFOSC | 300 | 2300 |
| 2017-09-22 | 58018.69 | 19.6 | BAO+BFOSC | 500 | 2400 |
| 2017-09-25 | 58021.42 | 22.3 | FTN+FLOYDS | 500 | 2700 |
| 2017-09-26 | 58022.78 | 23.7 | BAO+BFOSC | 500 | 2400 |
| 2017-09-27 | 58024.00 | 24.9 | NOT+ALFOSC | 300 | 2300 |
| 2017-09-29 | 58025.40 | 26.4 | Bok+BC | 700 | 3600 |
| 2017-10-03 | 58029.53 | 30.4 | FTN+FLOYDS | 500 | 2700 |
| 2017-10-05 | 58031.06 | 32.0 | NOT+ALFOSC | 300 | 600 |
| 2017-10-11 | 58037.13 | 38.0 | NOT+ALFOSC | 300 | 600 |
| 2017-10-11 | 58037.40 | 38.3 | Bok+BC | 700 | 3240 |
| 2017-10-17 | 58043.01 | 43.9 | Asiago182+AFOSC | 300 | 21200 |
| 2017-10-17 | 58043.25 | 44.2 | VLT+FORS2 | 500 | 274+343 |
| 2017-10-18 | 58044.74 | 45.7 | HCT+HFOSC | 350 | 21200 |
| 2017-10-18 | 58044.99 | 45.9 | Asiago122+BC | 700 | 31800 |
| 2017-10-21 | 58047.26 | 48.2 | NTT+EFOSC2 | 200 | 900 |
| 2017-10-22 | 58048.54 | 49.5 | FTS+FLOYDS | 500 | 2700 |
| 2017-10-24 | 58050.10 | 51.0 | VLT+FORS2 | 500 | 2299 |
| 2017-10-27 | 58053.52 | 54.4 | FTS+FLOYDS | 500 | 2700 |
| 2017-10-27 | 58053.70 | 54.6 | MMT+BCH | 3900 | 3300 |
| 2017-10-28 | 58054.37 | 55.3 | Bok+BC | 700 | 3240 |
| 2017-10-29 | 58055.28 | 56.3 | HET+LRS2B | 1100 | 1000 |
| 2017-11-01 | 58058.45 | 59.4 | FTS+FLOYDS | 500 | 2700 |
| 2017-11-02 | 58059.80 | 60.7 | HCT+HFOSC | 350 | 21800 |
| 2017-11-03 | 58060.66 | 61.6 | HCT+HFOSC | 350 | 21800 |
| 2017-11-05 | 58062.79 | 63.7 | HCT+HFOSC | 350 | 21200 |
| 2017-11-06 | 58063.48 | 64.4 | FTN+FLOYDS | 500 | 2700 |
| 2017-11-06 | 58063.79 | 64.7 | HCT+HFOSC | 350 | 21200 |
| 2017-11-10 | 58067.09 | 68.0 | NOT+ALFOSC | 300 | 2300 |
| 2017-11-10 | 58067.24 | 68.2 | VLT+FORS2 | 500 | 329 |
| 2017-11-10 | 58067.79 | 68.7 | HCT+HFOSC | 350 | 21200 |
| 2017-11-13 | 58070.63 | 71.5 | BAO+BFOSC | 500 | 3000 |
| 2017-11-19 | 58076.39 | 77.3 | FTN+FLOYDS | 500 | 1800 |
| 2017-11-19 | 58076.73 | 77.6 | HCT+HFOSC | 350 | 21800 |
| 2017-11-20 | 58077.31 | 78.2 | MMT+BCH | 3900 | 3300 |
| 2017-11-23 | 58080.72 | 81.6 | HCT+HFOSC | 350 | 21200 |
| 2017-11-26 | 58083.95 | 84.9 | Asiago122+BC | 700 | 41800 |
| 2017-11-29 | 58086.57 | 87.5 | HCT+HFOSC | 350 | 21200 |
| 2017-12-02 | 58089.60 | 90.5 | HCT+HFOSC | 350 | 21800 |
| 2017-12-03 | 58090.91 | 91.8 | Asiago122+BC | 700 | 41800 |
| 2017-12-04 | 58091.38 | 92.3 | FTN+FLOYDS | 500 | 1800 |
| 2017-12-07 | 58094.04 | 94.9 | NOT+ALFOSC | 300 | 600 |
| 2017-12-09 | 58096.83 | 97.7 | Asiago122+BC | 700 | 41800 |
| 2017-12-10 | 58097.26 | 98.2 | Bok+BC | 700 | 31200 |
| 2017-12-12 | 58099.15 | 100.1 | VLT+FORS2 | 500 | 2329 |
| 2017-12-13 | 58100.12 | 101.0 | VLT+FORS2 | 500 | 329 |
| 2017-12-14 | 58101.04 | 102.0 | VLT+FORS2 | 500 | 329 |
| 2017-12-15 | 58102.46 | 103.4 | FTS+FLOYDS | 500 | 3600 |
| 2017-12-18 | 58105.8 | 106.7 | Asiago122+BC | 700 | 41800 |
| 2017-12-20 | 58107.8 | 108.7 | Asiago122+BC | 700 | 41800 |
| 2017-12-21 | 58108.11 | 109.0 | VLT+FORS2 | 500 | 3329 |
| 2017-12-21 | 58108.55 | 109.5 | BAO+BFOSC | 500 | 3000 |
| 2017-12-22 | 58109.11 | 110.0 | VLT+FORS2 | 500 | 2329 |
| 2017-12-23 | 58109.8 | 110.8 | Asiago122+BC | 700 | 41800 |
| 2017-12-23 | 58110.04 | 111.0 | VLT+FORS2 | 500 | 329 |
| 2017-12-23 | 58110.23 | 111.1 | MMT+BCH | 3900 | 3300 |
| 2017-12-29 | 58116.59 | 117.5 | HCT+HFOSC | 350 | 21500 |
| 2018-01-05 | 58123.45 | 124.4 | FTS+FLOYDS | 500 | 3600 |
| 2018-01-07 | 58126.42 | 127.3 | BAO+BFOSC | 500 | 3000 |
| 2018-01-09 | 58128.82 | 129.7 | Asiago182+AFOSC | 300 | 21200 |
| 2018-01-14 | 58132.05 | 133.0 | VLT+FORS2 | 500 | 329 |
| 2018-01-14 | 58132.56 | 133.5 | HCT+HFOSC | 350 | 21500 |
| 2018-01-15 | 58133.07 | 134.0 | VLT+FORS2 | 500 | 329 |
| 2018-01-16 | 58134.12 | 135.0 | VLT+FORS2 | 500 | 329 |
| 2018-01-16 | 58134.26 | 135.2 | FTN+FLOYDS | 500 | 3600 |
| 2018-01-17 | 58135.05 | 136.0 | VLT+FORS2 | 500 | 329 |
| 2018-01-18 | 58136.05 | 137.0 | VLT+FORS2 | 500 | 329 |
| 2018-01-17 | 58136.46 | 137.4 | BAO+BFOSC | 500 | 3300 |
| 2018-01-19 | 58137.07 | 138.0 | VLT+FORS2 | 500 | 2329 |
| 2018-01-20 | 58137.89 | 138.8 | NOT+ALFOSC | 300 | 600 |
| 2018-01-22 | 58141.47 | 142.4 | BAO+BFOSC | 500 | 3000 |
| 2018-01-24 | 58142.15 | 143.1 | Bok+BC | 700 | 3600 |
| 2018-02-05 | 58154.09 | 155.0 | MMT+BCH | 3900 | 3900 |
| 2018-02-12 | 58161.22 | 162.1 | FTN+FLOYDS | 500 | 3600 |
| 2018-01-20 | 58163.86 | 164.7 | NOT+ALFOSC | 300 | 600 |
| 2018-07-12 | 58311.37 | 312.3 | Magellan+MIKE | 40000 | 31200 |
Note. — Phases are reported with respect to an explosion epoch of 57999.09
| UT Date | MJD | Phase | Telescope | range | Exp Time |
|---|---|---|---|---|---|
| (y-m-d) | Instrument | m | (s) | ||
| 2017-09-06 | 58002.46 | +3.4 | Gemini/GNIRS | 0.82–2.4 | 14120 |
| 2017-09-10 | 58005.57 | +6.5 | IRTF/SpeX | 0.82–2.4 | 8150 |
| 2017-09-16 | 58012.45 | +13.4 | Gemini/GNIRS | 0.82–2.4 | 20150 |
| 2017-10-20 | 58046.17 | +47.1 | NTT/SOFI | 0.9–2.4 | 12125 |
| 2017-10-28 | 58054.31 | +54.2 | IRTF/SpeX | 0.82–2.4 | 12150 |
| 2017-11-28 | 58085.14 | +86.1 | NTT/SOFI | 0.9–2.4 | 8120 |
| 2017-12-11 | 58098.30 | +99.2 | IRTF/SpeX | 0.82–2.4 | 20150 |
| 2018-01-20 | 58138.23 | +139.1 | Gemini/GNIRS | 0.8–2.4 | 20120 |
| 2018-01-31 | 58149.02 | +149.9 | Magellan/FIRE | 0.8–2.4 | 12127 |