Analysis of the duration–hardness ratio plane of gamma-ray bursts with skewed distributions
Abstract
It was recently shown that the distributions of gamma-ray bursts from CGRO/BATSE and Fermi/GBM are well described by a mixture of only two skewed components, making the presumed third, intermediate class unnecesary. The Swift/BAT, Konus-Wind, RHESSI and Suzaku/WAM data sets are found to be consistent with a two-class description as well.
Keywords:
gamma-ray burst: general – methods: data analysis – methods: statisticalI Introduction
The two widely accepted classes of gamma-ray bursts (GRBs), short and long, are with confidence ascribed to mergers of compact objects and collapse of massive stars, respectively. A third, intermediate class (Horváth 1998), remains putative. Its existence was claimed based on univariate and bivariate analyses of GRB observables modeled with Gaussian distributions (Mukherjee et al. 1998; Horváth 2002; Horváth et al. 2008; Zhang & Choi 2008; Huja et al. 2009; Řípa et al. 2009; Horváth et al. 2010; Veres et al. 2010; Zitouni et al. 2015; Zhang et al. 2016; Horváth et al. 2018), but also has been put into doubt several times (Bystricky et al. 2012; Řípa et al. 2012; Tarnopolski 2015; Zitouni et al. 2015; Narayana Bhat et al. 2016; Tarnopolski 2016a; Tarnopolski 2016b; Ohmori et al. 2016; Yang et al. 2016; Kulkarni & Desai 2017; Zitouni et al. 2018). Gaussian models, however, may not be the appropriate approach11 1 Mukherjee et al. 1998 noted that ”the distributions often seem bimodal with asymmetrical non-Gaussian shapes”, but failed to employ skewed distributions in modeling and proceeded considering multinormal distributions. (Koen & Bere 2012; Tarnopolski 2015; Koen & Bere 2017), as it has been already shown that the univariate distributions of (Tarnopolski 2016c; Tarnopolski 2016a; Kwong & Nadarajah 2018) and bivariate ones (Tarnopolski 2019) are better described by mixtures of two skewed components rather than three Gaussian ones. In this work the plane is examined in case of data sets from four other satellites: Swift/BAT, Konus-Wind, RHESSI, and Suzaku/WAM.
II Data
The following data sets are investigated: 1033 GRBs from the Swift/BAT catalogue (Lien et al. 2016), 1143 GRBs observed by Konus-Wind (Svinkin et al. 2016), 427 GRBs detected by RHESSI (Řípa et al. 2009), and 259 GRBs from Suzaku/WAM (Ohmori et al. 2016). The bivariate distributions of duration and hardness ratio in the log-log plane are examined. For each instrument, fluences in different energy bands are available, hence the definitions of are: for Swift; for Konus; for RHESSI; and for Suzaku.
III Methodology
The methodology is the same as in (Tarnopolski 2019). Two- and three-component mixtures of the following bivariate distributions are fitted: regular Gaussian (2G and 3G), skew-normal (2SN and 3SN), Student (2T and 3T), and skew-Student (2ST and 3ST). The fits are compared using the small sample Akaike (Hurvich & Tsai 1989) and Bayesian Information Criteria ( and ). is liberal, and has a tendency to overfit. is much more stringent, and tends to underfit. Therefore, when the two point at different models, the truth lies somewhere in between. (See Tarnopolski 2019 for details.) The fitting is performed using the R package mixsmsn22 2 https://cran.r-project.org/web/packages/mixsmsn/index.html (Prates et al. 2013).
IV Results
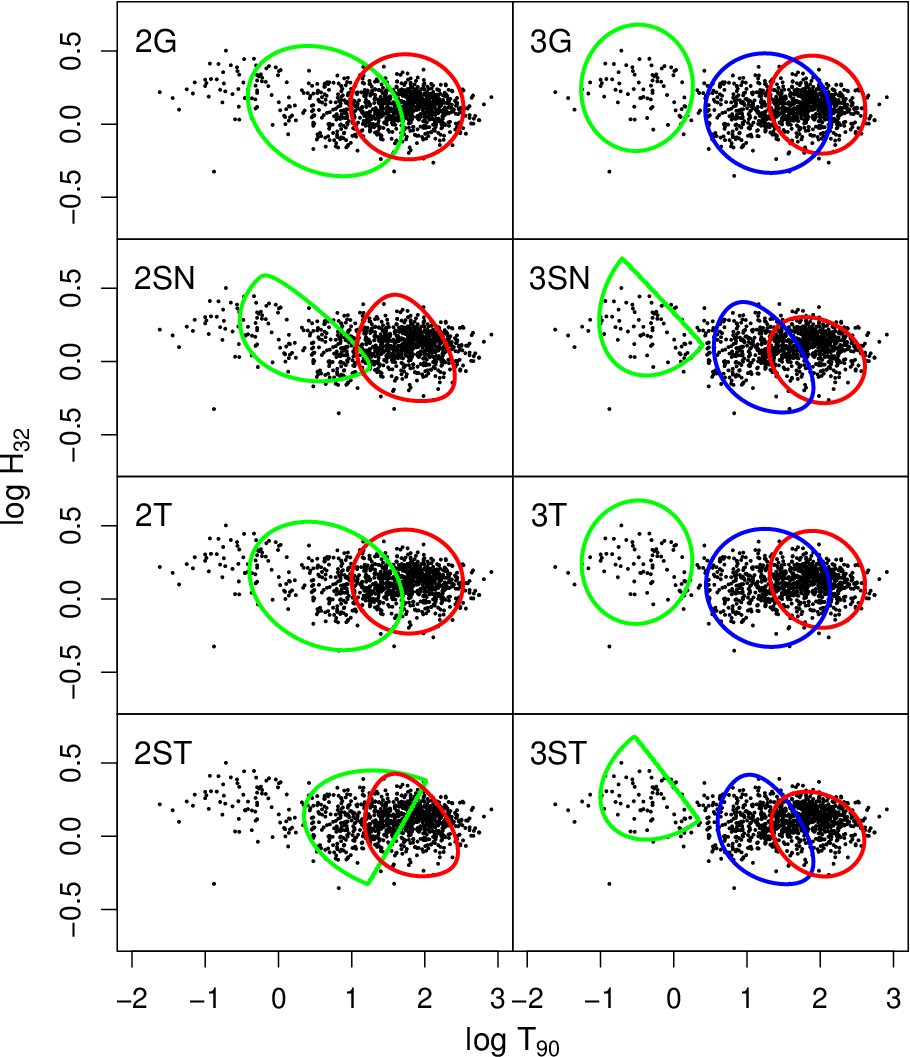
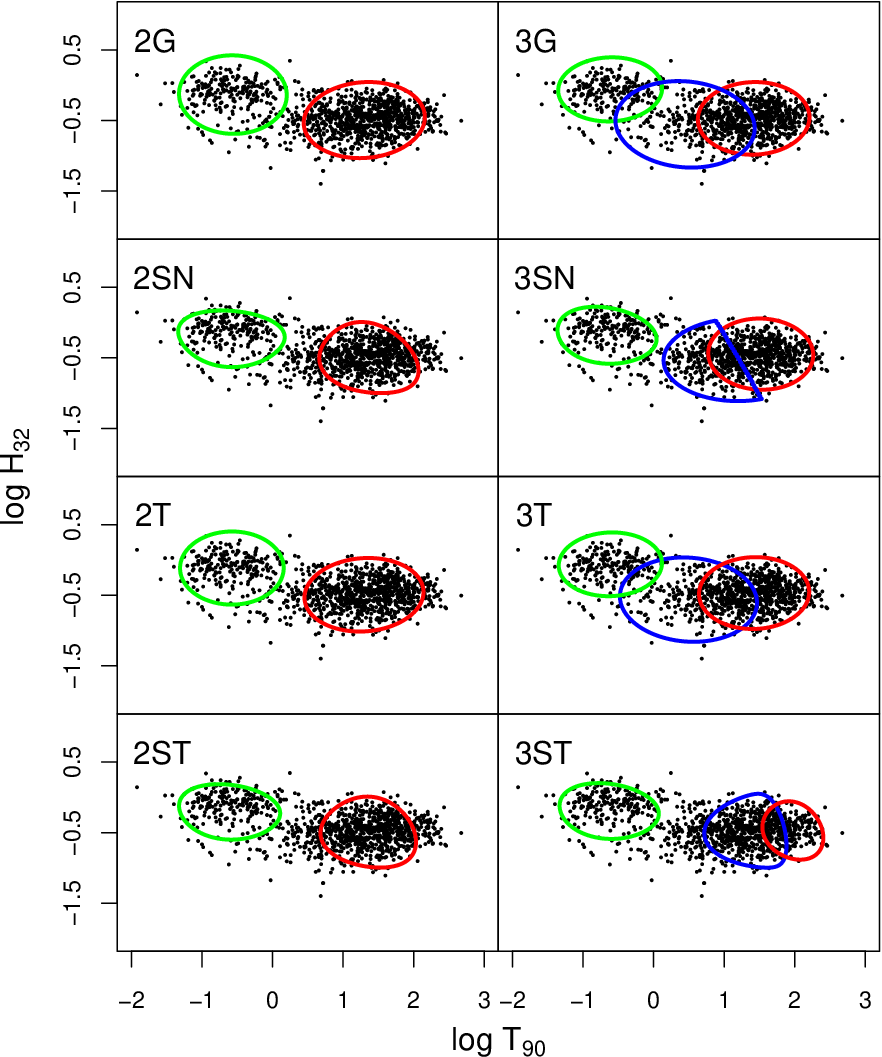
The results are displayed in Figs. 1–4. For Swift and Konus no clear answer is obtained, however both point at skewed distributions (see bottom panels of Figs. 1 and 2). For Swift, the yields 2ST and 2SN, while gives 3ST and 3SN. Henceforth, the lack of a third component in the data cannot be confidently ruled out; on the other hand, its presence is also not unambiguously supported. Konus gives remarkably similar results.


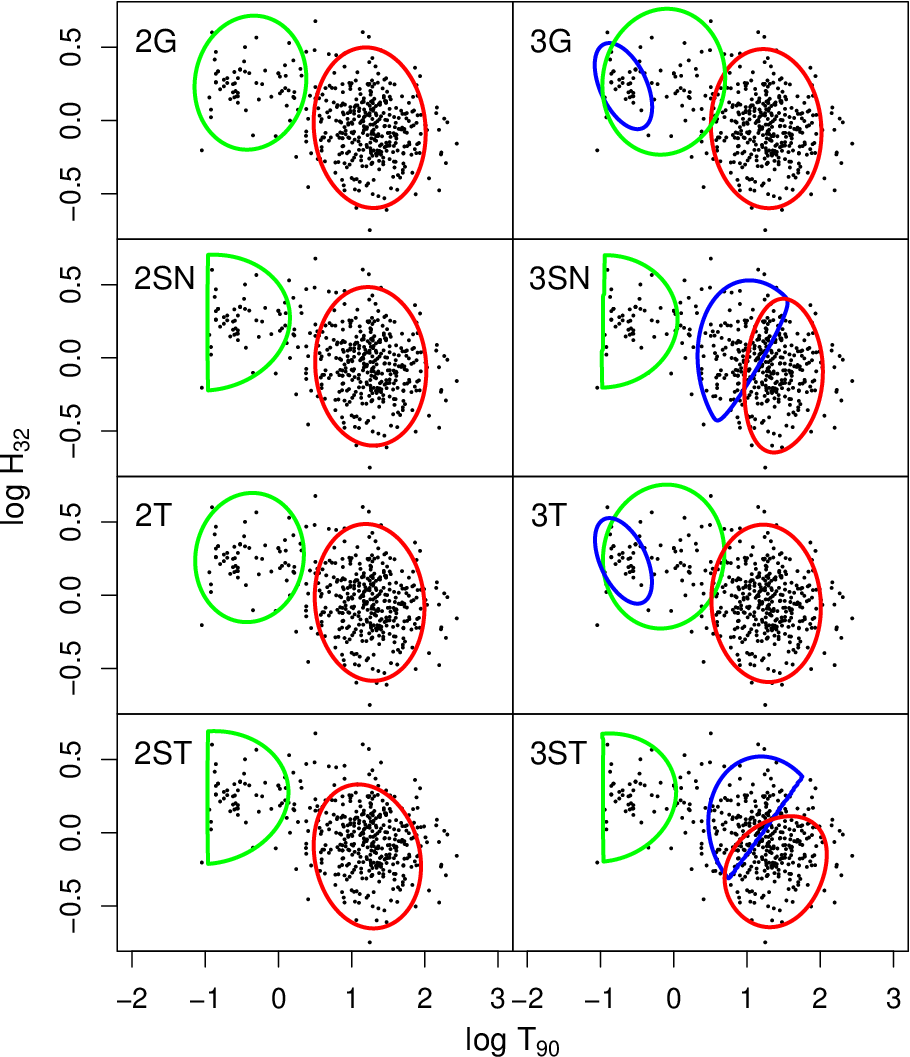


In case of RHESSI (see Fig. 3), both point unequivocally at 2-component mixtures, however prefers symmetric distributions (2G and 2T), while hints at skewed ones (2ST and 2SN). Suzaku, the smallest data set examined, can be with no doubt well modeled with only 2 components, with 2G being the simplest model (see Fig. 4).
V Discussion
GRBs from BATSE and Fermi can be confidently divided into only two classical groups, short and long; the elusive soft-intermediate class is not necessary to satisfactorily describe the data (Tarnopolski 2015; Tarnopolski 2016c; Tarnopolski 2016a; Tarnopolski 2019). In case of Swift and Konus, however, no firm conclusion can be formulated—the point at either two or three classes. The smallest data sets—RHESSI and Suzaku—can be adequately construed as consisting of two groups, although due to the smallness of these samples, the more subtle structure in the plane can simply be not traced prominently enough.
The asymmetry of the data, manifested via skewed distributions, might come from a non-symmetric distribution of the envelope masses of the progenitors of the long GRBs or other inherently asymmetrical distributions of physical parameters governing the progenitors or GRBs themselves; from the impact of the redshift distribution on the observables; or a combination of the listed possibilities (Tarnopolski 2015; Zitouni et al. 2015; Tarnopolski 2016c; Tarnopolski 2016a; Tarnopolski 2016b; Tarnopolski 2019).
VI Conclusions
No definite signs of the putative third GRB class are visible in the examined data. On the other hand, the Swift and Konus data yield inconclusive. It is desirable to have the exact shape of the observed distributions derived from a physical theory, or inferred on the grounds of statistics, which has not been convincingly realized thus far.
References
- Bystricky et al. (2012) Bystricky, P., Mészáros, A., & Řípa, J. 2012, in Proceedings of the 21st Annual Conference of Doctoral Students - WDS 2012, Prague, 29th May - 1st June, 2012, Edited by J. Safrankova and J. Pavlu, MATFYZPRESS, Prague, Part III - Physics, f-1
- Horváth (1998) Horváth, I. 1998, ApJ, 508, 757, doi: 10.1086/306416
- Horváth (2002) —. 2002, A&A, 392, 791, doi: 10.1051/0004-6361:20020808
- Horváth et al. (2010) Horváth, I., Bagoly, Z., Balázs, L. G., et al. 2010, ApJ, 713, 552, doi: 10.1088/0004-637X/713/1/552
- Horváth et al. (2008) Horváth, I., Balázs, L. G., Bagoly, Z., & Veres, P. 2008, A&A, 489, L1, doi: 10.1051/0004-6361:200810269
- Horváth et al. (2018) Horváth, I., Tóth, B. G., Hakkila, J., et al. 2018, Ap&SS, 363, 53, doi: 10.1007/s10509-018-3274-5
- Huja et al. (2009) Huja, D., Mészáros, A., & Řípa, J. 2009, A&A, 504, 67, doi: 10.1051/0004-6361/200809802
- Hurvich & Tsai (1989) Hurvich, C. M., & Tsai, C.-L. 1989, Biometrika, 76, 297, doi: 10.1093/biomet/76.2.297
- Koen & Bere (2012) Koen, C., & Bere, A. 2012, MNRAS, 420, 405, doi: 10.1111/j.1365-2966.2011.20045.x
- Koen & Bere (2017) —. 2017, MNRAS, 471, 2771, doi: 10.1093/mnras/stx1740
- Kulkarni & Desai (2017) Kulkarni, S., & Desai, S. 2017, Ap&SS, 362, 70, doi: 10.1007/s10509-017-3047-6
- Kwong & Nadarajah (2018) Kwong, H. S., & Nadarajah, S. 2018, MNRAS, 473, 625, doi: 10.1093/mnras/stx2373
- Lien et al. (2016) Lien, A., Sakamoto, T., Barthelmy, S. D., et al. 2016, ApJ, 829, 7, doi: 10.3847/0004-637X/829/1/7
- Mukherjee et al. (1998) Mukherjee, S., Feigelson, E. D., Jogesh Babu, G., et al. 1998, ApJ, 508, 314, doi: 10.1086/306386
- Narayana Bhat et al. (2016) Narayana Bhat, P., Meegan, C. A., von Kienlin, A., et al. 2016, ApJS, 223, 28, doi: 10.3847/0067-0049/223/2/28
- Ohmori et al. (2016) Ohmori, N., Yamaoka, K., Ohno, M., et al. 2016, PASJ, 68, S30, doi: 10.1093/pasj/psw009
- Prates et al. (2013) Prates, M., Lachos, V., & Cabral, C. B. 2013, Journal of Statistical Software, 54, 1, doi: 10.18637/jss.v054.i12
- Svinkin et al. (2016) Svinkin, D. S., Frederiks, D. D., Aptekar, R. L., et al. 2016, ApJS, 224, 10, doi: 10.3847/0067-0049/224/1/10
- Tarnopolski (2015) Tarnopolski, M. 2015, A&A, 581, A29, doi: 10.1051/0004-6361/201526415
- Tarnopolski (2016a) —. 2016a, Ap&SS, 361, 125, doi: 10.1007/s10509-016-2687-2
- Tarnopolski (2016b) —. 2016b, NewA, 46, 54, doi: 10.1016/j.newast.2015.12.006
- Tarnopolski (2016c) —. 2016c, MNRAS, 458, 2024, doi: 10.1093/mnras/stw429
- Tarnopolski (2019) —. 2019, ApJ, 870, 105, doi: 10.3847/1538-4357/aaf1c5
- Řípa et al. (2012) Řípa, J., Mészáros, A., Veres, P., & Park, I. H. 2012, ApJ, 756, 44, doi: 10.1088/0004-637X/756/1/44
- Řípa et al. (2009) Řípa, J., Mészáros, A., Wigger, C., et al. 2009, A&A, 498, 399, doi: 10.1051/0004-6361/200810913
- Veres et al. (2010) Veres, P., Bagoly, Z., Horváth, I., Mészáros, A., & Balázs, L. G. 2010, ApJ, 725, 1955, doi: 10.1088/0004-637X/725/2/1955
- Yang et al. (2016) Yang, E. B., Zhang, Z. B., & Jiang, X. X. 2016, Ap&SS, 361, 257, doi: 10.1007/s10509-016-2838-5
- Zhang & Choi (2008) Zhang, Z.-B., & Choi, C.-S. 2008, A&A, 484, 293, doi: 10.1051/0004-6361:20079210
- Zhang et al. (2016) Zhang, Z.-B., Yang, E.-B., Choi, C.-S., & Chang, H.-Y. 2016, MNRAS, 462, 3243, doi: 10.1093/mnras/stw1835
- Zitouni et al. (2018) Zitouni, H., Guessoum, N., AlQassimi, K. M., & Alaryani, O. 2018, Ap&SS, 363, 223, doi: 10.1007/s10509-018-3449-0
- Zitouni et al. (2015) Zitouni, H., Guessoum, N., Azzam, W. J., & Mochkovitch, R. 2015, Ap&SS, 357, 7, doi: 10.1007/s10509-015-2311-x