Particle decays of levels in 11,12N and 12O investigated with the invariant-mass method
Abstract
Particle-decaying states of the light nuclei 11,12N and 12O were studied using the invariant-mass method. The decay energies and intrinsic widths of a number of states were measured, and the momentum correlations of three-body decaying states were considered. A second 2-decaying state of 12O was observed for the first time, and a higher energy 12O state was observed in the 4+2 decay channel. This 4+2 channel also contains contributions from fission-like decay paths, including 6Beg.s.+6Beg.s.. Analogs to these states in 12O were found in 12N in the 2+10B and 2++6Li channels. The momentum correlations for the prompt 2 decay of 12Og.s. were found to be nearly identical to those of 16Neg.s., and the correlations for the new 2+ state were found to be consistent with sequential decay through excited states in 11N. The momentum correlations for the 2 state in 12O provide a new value for the 11N ground-state energy. The states in 12N/12O that belong to the =12 isobaric sextet do not deviate from the quadratic isobaric multiplet mass equation (IMME) form.
I INTRODUCTION
Isotopes near and beyond the drip lines can show interesting properties such as spatially extended halos, prompt two-nucleon emission, and low-energy intruder states. They also present a theoretical challenge as coupling to the continuum needs to be included which can result in clusterization Okołowicz et al. 2012 and the breaking of isospin symmetry due to Thomas-Ehrman effects Thomas 1951; Ehrman 1951; Grigorenko et al. 2002; Michel et al. 2010.
Experimentally, the invariant-mass method can play an important role in the study of such effects, finding new levels, and characterizing their decays. It is particularly useful in 3-body decays as the momentum correlations between the decay products can capture information about the decay dynamics and the structure of the parent states. These correlations can be characterized by a two-dimensional plot of kinematic relations between the decay fragments. High-statistics measurements of such plots for the democratic 2 decay of the 6Be and 16Ne ground states have been made and successfully compared to three-body calculations Egorova et al. 2012; Brown et al. 2014a. For the intermediate case, 12Og.s., only a 1-dimensional distribution has been measured with lower statistics Kryger et al. 1995.
The structure of 11N is important for excited 12O levels that sequentially 2 decay. Knowledge of the energies, widths, and decay paths of these states will lead to better understanding of this sequential 2 decay and constrain theoretical calculations.
The isobaric analog of 12O in 12N was also shown to undergo prompt 2 decay to the isobaric analog state (IAS) in 10B Jager et al. 2012. This represented a second case of prompt 2 decay from one IAS to another IAS, with the first case being 8B2+6LiIAS Charity et al. 2011a; Brown et al. 2014b. It is interesting to determine if these analog 2 decays have the same momentum correlations as their ground-state cousins. 8BIAS is the analog of 8Cg.s., which decays by two sets of prompt 2 decays Charity et al. 2011a. It is difficult to separate the protons from the two steps, making comparison of the analog 2 decays difficult. On the other hand, 12Og.s. and its analog 12NIAS present no such difficulties, as there is only one step of 2 decay in both systems. It is also interesting to see if higher-lying analog states undergo prompt or sequential 2 decay to the 10BIAS.
This work is part of a larger joint experimental and theoretical study of 12O and its neighbors with the aim of addressing these issues. The present paper mostly presents experimental results with comparisons to other experimental values and some previous theoretical predictions. Comparisons with predictions of the Gamow coupled-channel (GCC) method Wang et al. 2017a; Wang and Nazarewicz 2018 are given in Refs. Webb et al. 2019; Wang et al. 2019 and this work, and further comparisons will be elaborated on in future papers when the model is extended to include the dynamics of the 2 decay.
II EXPERIMENTAL METHODS
The data presented were obtained at the National Superconducting Cyclotron Laboratory at Michigan State University, which provided a 16O primary beam at 150 MeV/A. The primary beam bombarded a 193 mg/cm2 9Be target, and 13O fragments were selected by the A1900 magnetic separator. Upon extraction from the separator, this 69.5 MeV/A secondary beam had a purity of only 10%. To remove the substantial contamination, the beam was sent into an electromagnetic time-of-flight filter, the Radio Frequency Fragment Separator Bazin et al. 2009, and emerged with a purity of 80%. The final secondary beam impinged on a 1-mm-thick 9Be target with a rate of pps and the charged particles produced were detected in the High Resolution Array (HiRA) Wallace et al. 2007 consisting of 14 E-E [Si-CsI(Tl)] telescopes 85 cm downstream of the target. The array subtended a polar angular range of 2.1∘ to 12.4∘ and a solid angle of 78 msr. Each telescope consisted of a 1.5-mm-thick, double-sided Si strip detector followed by a 4-cm-thick, CsI(Tl) detector. The detectors are 6.4 cm 6.4 cm in area, with each of the faces divided into 32 strips. Each detector consisted of four separate CsI(Tl) elements each spanning a quadrant of the preceding Si detector. Signals produced in the 896 Si strips were processed with the HINP16C chip electronics Engel et al. 2007.
The energy calibration of the Si detectors was obtained with a 232U -particle source. The particle-dependent energy calibrations of the CsI(Tl) detectors were achieved with cocktail beams selected with the A1900 separator. These included protons (80 MeV), = fragments (=80 MeV), and 9C (=82.9 MeV). Lower-energy points were obtained using 2.2-, 4.9-, and 9.6-mm-thick Al degraders. Calibrations for 10C and 9Be fragments were obtained from interpolating and extrapolating these results.
Particle identification was obtained from plots where the -axis gives the energy lost in the silicon detector while the -axis is related to the residual energy which is deposited in the CsI(Tl) scintillators (). Figure 1 shows zoomed-in regions of such a plot for a typical telescope centered on the regions containing the H [Fig. 1(a)] and C [Fig. 1(b)] isotopes. Isotopes separation is obtained in all cases.

For the normalization of cross sections, the beam particles were counted using a thin plastic-scintillator foil at the exit of the Radio Frequency Fragment Separator. The purity of the beam and the beam flux loss due to its transport to the target were determined periodically in the experiment by temporarily placing a CsI(Tl) detector in the target position. These fluxes were also corrected for the detector dead time measured with a random pulse generator.

III INVARIANT-MASS METHOD
In the decay of a parent state into two or more pieces, the mass of the parent can be obtained from the invariant mass of the decay products. Experimentally we measure the invariant mass of the charged particles detected in the HiRA array. For example 2+10C events associated with the decay of 12O levels are obtained from two protons and a 10C fragment detected in coincidence where each fragment’s and are identified from the plots. The latter requires that each fragment be detected in a separate CsI(Tl) crystal and four-fold or higher-order coincidences containing 2+10C subevents are rejected. For 11N resonances decaying to the +10C channel we can similarly look at double coincidences of a proton and a 10C fragment. However some of these events are in reality 2+10C decays of 12O where one of the protons was not detected. In this case, background from the latter events must be considered (sec. IV.1). The +10C channel is the only channel in this work where a background subtraction was necessary as the corresponding backgrounds from high-order coincidences for other channels was found to be negligible.
Rather than using the , it is often more convenient to use the total kinetic energy () of the fragments in the center-of-mass frame of these fragments
| (1) |
where are the rest masses of the detected fragments. If the fragments are from the decay of a resonance, represents the kinetic energy released in the decay of that resonance. Alternatively if the ground-state rest mass of the parent is well determined we use
| (2) |
This quantity only represents the true excitation energy if all of the detected fragments were produced in their ground states rather than particle-stable excited states. For some of the detected fragments considered in this paper (6Li, 10B, and 10C), there are -decaying excited states, and thus the true excitation energy is obtained by adding the sum of the -rays energies, i.e. . Both 6Li and 10C have only one -decaying excited state, limiting the number of possible excitation values to two for an event that includes one of these fragments.
The largest degrading factor to the invariant-mass resolution is from the energy loss of the decay fragments as they leave the target material Charity et al. 2019. In particular it is the change in the relative velocities of the fragments that is important, with protons having much smaller velocity losses compared to the heavier cores. The difference in the velocity losses depends on the interaction depth in the target material, which is not known. We make an average correction to the velocities by assuming the reaction occurs in the center of the target material, which gives the correct average invariant mass. The contribution of this effect to the resolution can be minimized by selecting events based on the emission angle of the core relative to the beam axis in the parent’s center-of-mass frame Charity et al. 2019. Transverse emissions, where 90∘ (0), have the best resolution, and the width of the gate around this value is optimized for each spectrum based on the statistics and the presence of narrow peaks. The gates used are specified in the figure captions.
Peaks found in the experimental invariant-mass spectra were fit to extract the resonance energy and intrinsic width assuming some intrinsic line shape. The experimental resolution and efficiency is included via Monte-Carlo simulation Charity et al. 2019. These simulations are benchmarked by comparison to well-known narrow resonances with high statistics.
Figures 2(a) and (b) show the excitation-energy spectra for particle-unbound states of 13O from detected 2+11C events and of 12N from +11C events respectively. The curves show fits assuming Breit-Wigner intrinsic line shapes. The fitted parameters for the 2 and 2 states of 12N are shown in Table 1 and compared to the ENSDF values. The reported width of the 2 state is much smaller than the experimental resolution, so the width of this peak is essentially only from the experimental resolution. The simulated peak calculated with =0 reproduces the observed peak correctly.
The peaks in the 2+11C spectrum have only been seen in one previous study Sobotka et al. 2013. Again we obtained excellent reproduction of these peaks with =0 as their width is also dominated by the experimental resolution. The centroid for the lower-energy peak is consistent with the previous value, while the higher-energy is slightly higher (see Table 1). Based on past experience, we expect a systematic error of around 10 keV Charity et al. 2019 which is not included in the uncertainties listed in the following tables. Our reproduction of these known resonances assures us that our simulations correctly incorporate the detector response.
| Nuclide | [MeV] | [keV] | [MeV] | [keV] | |
|---|---|---|---|---|---|
| 12N | 0.960(12) | <20 | 0.962(3) | ||
| 12N | 1.179(17) | 55(14) | 1.186(7) | 77(12) | |
| 13O | 3.025(16) | <0.050 | 3.038(9) | ||
| 13O | 3.669(13) | <0.050 | 3.701(10) |
IV INVARIANT-MASS SPECTRA
Invariant-mass spectra for all the isotopes examined in this work are presented in this section. The level schemes of Fig. 3 contain new and previously known levels, and can be used to aid in understanding the discussions.
IV.1 11N structure
The structure of 11N is important for 12O decay as its levels are possible intermediate states in sequential 2 decays. The spectrum from detected +10C events is shown as the black histogram in Fig. 4(a). From this spectrum we have subtracted two types of contaminations. First, a small fraction of 11C fragments leak into the 10C gate. To estimate the spectrum from such events, we have taken the detected +11C events and analyzed them as if the 11C fragment was 10C. This spectrum is scaled by the probability of misidentification determined from the calibration beams (0.5%) to give the red histogram in Fig 4(a). Its magnitude is only significant at very small values of . Secondly, 12O2+10C events in which one of the protons was not detected will also contribute to the detected +10C events. To account for this, we have taken the detected 2+10C events and randomly thrown away one of the protons, scaling the subsequent +10C invariant-mass spectra (blue histogram) based on the results of the Monte-Carlo simulation to appropriately represent the number of contaminated events from this process.

The contamination-subtracted spectrum is shown as the data points in Fig. 4(b) and largely represents the yield from the knockout of both a proton and a neutron from the projectile. The 12O2+10C events can also give information of 11N as shown later (Sec. V.2). The labeled black arrows show the locations of levels listed in the ENSDF database. A strong peak for the =1/2- first-excited state is observed, as is a smaller peak for the =3/2- state. The 1/2+ (ground state) and 5/2+ levels, if present, are not resolved. The unlabeled red arrows show the locations of new peaks necessary to fit the spectrum. The dominant 1/2- peak has a high-energy tail which cannot be explained by its expected line shape. In fitting the spectrum, we have assumed a new level just above the 1/2- peak in order to reproduce the observed shape. More remarkable is the presence of a low-energy peak (1.1 MeV) well below the nominal ground-state energy of =1.49 MeV ENS. It is unlikely that this is a true +10Cg.s. resonance, as we would expect it to have been observed already. Rather the more reasonable explanation is that it represents a decay to the =2+ first-excited state of 10C which gamma decays (=3.354 MeV, see Fig. 3). Adding the energy moves this peak to the same energy as the 3/2- level. Thus we conclude the =3/2- level has proton decay branches to both the ground and first excited state of 10C.

The solid curve in Fig. 4(b) shows a fit to the invariant-mass spectrum with 5 levels (6 peaks), including the known states indicated by the black arrows and one new level. -matrix line shapes are used for all levels except for the new state where a simple Breit-Wigner shape is assumed, as the decay orbital angular momentum is unknown. The energies and widths of the unresolved 1/2+ and 5/2+ states were fixed to the ENSDF values, but their presence allows for a good fit with a smooth background (blue dashed curve). The fitted branching ratio of the 3/2- state is ) = 0.64(6). Fitted energies and widths are listed in Table 2. The new =2.563-MeV state, can correspond to either an =1.073-MeV or 4.416-MeV level depending on whether the proton decay is to the ground or first excited state of 10C. No known mirror states in 11Be exist for the lower possibility, but a couple of candidates exist for the higher value, suggesting that the decay is to the 10C excited state.
| ENSDF | This Work | ||||
|---|---|---|---|---|---|
| [MeV] | [keV] | [MeV] | [keV] | 33 3 Based on our new value for the ground-state energy. [MeV] | |
| 1/2 | 1.49(6) | 830(30) | 1.378(5)11 1 From an the analysis of 12O2+10C events in Sec. V.2. | 780(10)11 1 From an the analysis of 12O2+10C events in Sec. V.2. | 0. |
| 1/2 | 2.220(30) | 600(100) | 2.216(5) | 721(13) | 0.838 |
| ? | 2.563(10) | 697(32) | 1.185 or 4.539 | ||
| 5/2+ | 3690(30)22 2 Parameters fixed to ENSDF values in fit. | 540(40)22 2 Parameters fixed to ENSDF values in fit. | 2.312 | ||
| 3/2- | 4.350(3) | 340(40) | 4.475(5) | 34022 2 Parameters fixed to ENSDF values in fit. | 3.097 |
IV.2 12O Structure
IV.2.1 2+10C channel
The spectrum for the 2-decay of 12O is shown in both Figs. 2(c) and (d). There are four peak structures present in the spectrum. The spin assignments of the three prominent peaks come from an analysis of the mirror, 12Be, presented in Fortune, H. T. 2016, the predictions of Wang et al. 2019; Fortune 2016; Fortune and Sherr 2011, and previous work Jager et al. 2012. The low-energy shoulder on the 2 peak [Fig. 2(c)] is at the approximate location of the second 0+, state measured in Suzuki et al. 2016. It is also at the approximate energy for the 1 state predicted with GCC calculations (=3.256 MeV) Wang et al. 2019. Alternatively, this structure may be a second 2 decay branch of the 2 excited state to the -MeV, , particle-bound first excited state as the shoulder is located 3.353 MeV lower in than the ground-state decay.
The data were fitted with Monte-Carlo simulations using Breit-Wigner intrinsic lineshapes that incorporated the detector response. The numerics, extracted decay energies, widths, and cross sections of each state are given in Table 3. The decay width of the shoulder state is subject to a large uncertainty, as demonstrated by the fit with different background parameterizations in Figs. 2(c) and 2(d). The extracted centroid and width are consistent with the values of =1.62(13) and =1.2 MeV for the 0 state from Suzuki et al. 2016. On the other hand, if the shoulder peak is a decay branch of the second 2+, we can fix its decay energy and width and refit the spectrum [Fig. 7(a)], obtaining a branching ratio for this component of 0.27(1).
This paper presents the first observation of a second 2+ state, which was predicted to be produced in 13O knockout reactions in Fortune 2016. Note that the analysis of Fortune 2016 predicts four 2+ states, though only two are expected to have significant strength (the first and fourth) and the fourth (presumably our 2 state) should have four times the yield of the 2 state, which is not observed.
| [MeV] | [MeV] | [MeV] | [mb] | |
|---|---|---|---|---|
| 1.718(15) | 0 | 0.051(19) | 1.2(2) | |
| 11 1 Assuming the shoulder peak is the second 0+. | 3.519(67) | 1.801(67) | 0.980(182) | 3.3(10) |
| 3.817(18) | 2.099(18) | 0.155(15) | 2.1(5) | |
| 6.493(17) | 4.775(17) | 0.754(25) | 3.5(9) | |
| 22 2 Assuming the shoulder peak is a decay branch of the second 2+. | 6.493(17) | 4.775(17) | 0.754(25) | 4.8(12) |
| 7.972(40)33 3 Through the decay channel. | 9.984(40) | 0.81(11) | 0.93(11) |
IV.2.2 4+2 channel
Figure 5(a) displays the reconstructed total-decay-energy spectrum of detected 4+2 events which shows a peak sitting atop a large background. Assuming a single level with a Breit-Wigner line shape, the fitted spectrum is shown as the solid curve with fitted parameters: =7.972(40) MeV, =0.81(11) MeV.

With the large multiplicity of exit-channel fragments, it is not easy to disentangle how this state decays, especially as it sits on a large background. Among the possible decay scenarios include sequential decay pathways which are initiated by an +8C/6Be+6Be split or 2 decay to higher-lying excited states of 10C. In all these scenarios, sequential decays of the unstable decay products lead to the observed exit channel.
Of the possible intermediate states, 8Beg.s. is cleanest to isolate as there is only one possible - subevent in each 4+2 event and the - invariant-mass peak has no background under it. The invariant-mass spectrum gated and vetoed by the presence of a 8Be intermediate state is shown in Fig. 5(b). Peaks are present in both spectra, indicating there are at least two decay pathways, but, as we will see, there are many more.
Other possible intermediate states can be identified using various combinations of the decay fragments. For instance, the invariant-mass spectra of 4+ subevents is shown in Fig. 6(c). Note there are two ways to make 4+ subevents for each 4+2 event. This spectrum shows the presence of a peak from the decay of 8Cg.s. at =3.449 MeV Charity et al. 2011b. On the other hand, for 10C intermediate states, the combinatorics give us 6 2+2 subevents for each event. Rather than dealing with all these subevents, the invariant-mass spectrum in Fig. 6(d) used only 2+2 subevents where one of the +2 subsubevents has an invariant mass corresponding to 9Bg.s. decay. This spectrum shows the presence of a prominent peak at =1.45 MeV corresponding to the 5.18-MeV state of 10C which is known to sequentially proton decay through 9Bg.s. to 8Beg.s. Charity et al. 2007a. Finally there are also 6 ways to separate a detected event into two subgroups of 2+ events from which one can search for the fission of 12O into two 6Be fragments. Plotting the decay energies of the prospective 6Be fragments against each other produces the 2D plot shown in Fig. 6(a). A sharp peak for which the two 6Be fragments are in their ground states can be discerned (=1.37 MeV). To make this more obvious, we have employed the diagonal gate shown by the dotted lines and projected onto either one of the axes to produce the spectrum shown in Fig. 6(b). Apart from g.s.+g.s. peak there is a broad peak at 3.5 MeV somewhat above the expected energy if both 6Be fragments are in the =1.16 MeV, =2+ state. Its origin is not clear.
By subtracting a smooth background under all the peaks in Fig. 6, a multiplicity for each observed intermediate resonance and a probability for the 6Beg.s.+6Beg.s. channel can be determined. These various multiplicities are plotted against in Fig. 5(c). In addition to the resonances discussed, multiplicities were also determined for the occurrence of a single 6Beg.s. and for the =5/2-, =2.345-MeV level of 9B. These multiplicities are inclusive and so for example the 8Beg.s. yield from the decay of 9Bg.s. is included in the 8Beg.s. multiplicity. The bin centered around the observed peak is marked by the fatter data points near 8 MeV. If these intermediate resonances are associated mainly with the 12O peak and not with the large background under it, then the multiplicities should have a maximum at the value for the peak (). This is clearly not the case. On the other hand, if the intermediate resonances come purely from the background, then the multiplicities should have a minimum at . According to our fit in Fig. 5(a), the peak to background yield for the bin centered on the peak is 1:1. Thus we would expect a suppression of 50% at the peak relative to the trend from the other bins in this scenario. Again this is also not the case. Thus we conclude that all these intermediate resonances are found in both the peak and the background beneath it with similar magnitudes. Making a more quantitative statement is impossible as the overall trend is non-linear and thus difficult to determine if the peak multiplicities are slightly larger or smaller than the overall trend.
We conclude that about 50% of the events in the observed 12O peak decay by producing at least one 6Beg.s. and another 20% have a 9Bg.s fragment. The latter is responsible for most of the observed 8Beg.s. yield. The fission-like channels 6Beg.s.+6Beg.s. and +8Cg.s. are responsible for 9% and 6% of the yield, respectively. The above analysis may miss wider intermediate states which are more difficult to discern above the backgrounds.

IV.3 12N structure
IV.3.1 2+10B channel
Known low-lying 12N states were observed in the +11C spectrum in Fig. 2(b). Higher-lying excited states can be found in the 2+10B spectrum in Fig. 7(b). This spectrum bears a strong resemblance to the 2+10C spectrum which is also reproduced in panel (a) for convenience. Both spectra contain three prominent peaks with the same energy spacing between them. In addition, the second of these peaks in both cases has a low-energy shoulder. This surprising result suggests that all the peaks in the 2+10B spectrum are analogs of the observed 12O levels. Indeed, the lowest-energy peak was also observed in the invariant-mass study of Jager et al. Jager et al. 2012 and it was argued that it was produced by the prompt 2 decay of the Isobaric Analog State (IAS) of 12O in 12N to the IAS in 10B. The latter subsequently decays. This represented a second example of prompt 2 decay from one IAS to another Charity et al. 2011b. The other example is the IAS of 8C in 8B which 2 decays to the IAS state in 6Li where the ray from the decay of 6LiIAS was observed Brown et al. 2014b. In both cases, prompt 2 decay was the only particle-decay mode which conserved both energy and isospin.

| Observed | Intermediate | [MeV] | [keV] | (mb) | ||
|---|---|---|---|---|---|---|
| Channel | Channel | |||||
| 2+10B | 0+ | 10.502(4) | 12.242 (4) | 100 | 0.19(6) | |
| 2+10B | 2+ | 12.574(4) | 14.314 (4) | 193(26) | 1.2(3) | |
| 2+10B | 2+ | 15.252(11) | 16.992(11) | 420(120) | 2.18(5)11 1 Includes contribution from the shoulder state. | |
| 2++6Li | +8BIAS | 18.408(66) | 21.970(66) | 649(49) | 0.091(2) | |
| 2++6Li | 6Beg.s.+6LiIAS | 18.569(86) | 22.131(86) | 702(170) | 0.15(4) | |
| 3+9Be | 22.158(23) | 22.158(23) | 138(79) | 2.5(6) |
If these other states are also analog states (=2), then the two higher-energy states are both =2+ and also involve 2 decay to the IAS of 10B. The low-energy shoulder on the lowest 2+ peak can again have contributions from three possible sources, i.e. from =2, =0+ or 1- levels or from a decay branch of a higher-energy 2+ state which decays to the first =1, =2+ state in 10B (Fig. 3). The red solid curve in Fig. 7(b) shows a fit obtained with Breit-Wigner intrinsic line shapes where the third origin of the low-energy shoulder is assumed. Figure 7(a) shows a similar fit to the 2+10C decay channel of 12O, assuming the shoulder state decays to the excited state of 10C. For the decay of 12N, the known energy of the first =1, =2+ 10B state is used to constrain its centroid relative to the fitted value for the second 2+ state. The fitted branching ratio is 0.087(12) which is smaller than the corresponding value obtained for the 12O2+10C shoulder state (see Sec. IV.2.1).
Although the 2+10B and 2+10C spectra in Fig. 7 have similar structure, the obvious difference is the much smaller relative yield for the 12NIAS peak (=10.502 MeV) compared to that for the other peaks. The cross sections for the 2 and 2 levels of 12N are about 50% of the corresponding 12O levels. Based on this scaling, we expect the yield of 0+ 12N IAS to be a factor of 3 larger than observed. The simplest explanation would be that 12NIAS has one or more other decay branches which account for most of the decay leaving the 2 branch with only 30% of the yield. If these other branches involve particle emission, then they must violate isospin symmetry, but no candidate peaks were observed in other 11N exit-channels. We cannot rule-out other particle-decay branches as some of these will have very low detection efficiency, e.g., single-proton decay to the 11Cg.s. where the emitted proton will mostly travel to angles outside the detectors angular acceptance. Another possibility is that the 12NIAS has a significant M1 decay strength to the ground state which would satisfy the spin and isospin selection rules.
IV.3.2 2++6Li channel
While the analogs of the low-lying 12O levels have been found, we have also searched for the analog of the higher-lying 12O level observed in the 4+2 channel. Given the large number of decay paths inferred for this state, it is reasonable to assume multiple exit-channels are associated with the analog state, some of which would contain neutrons and not accessible with the experimental apparatus. However, the analog of the fission-like 6Beg.s.+6Beg.s and +8Cg.s. channels in 12O would be 6Beg.s.+6LiIAS and +8BIAS which would populate the 2++6Li+ exit channel. No peaks are observed in the raw 2++6Li invariant-mass spectrum, but with suitable gating the analogs can be found. The invariant-mass spectra from the 2+ and 2+6Li subevents are shown in Fig. 8(a) and 8(b), respectively.

The peak observed in the 2+6Li exit channel [Fig. 8(b)] is consistent in energy and width to a peak observed following proton knockout from a 9C beam Brown et al. 2014b. It was identified as a 8B2+6LiIAS decay where the ray from the decay of 6LiIAS was observed in a subsequent experiment. Gating on the 8BIAS peak produces the 2++6Li invariant-mass spectrum in Fig. 8(d). Taking into account the energy of the unobserved gamma ray (3.563 MeV), the excitation energy of the 12N+8BIAS state is at 21.970(66) MeV.
A 6Be ground-state peak is observed in the invariant-mass spectrum for the 2+ subevents [Fig. 8(a)]. Gating on this peak produces the invariant-mass spectrum in Fig. 8(c). In principle this peak could correspond to either a 6Beg.s.+6Lig.s. or 6Beg.s.+6LiIAS decay. However, the fitted values and widths of the peaks in Figs. 8(c) and 8(d) (given in Table 4) are consistent, suggesting that they are decay branches of the same state. Thus the peak in Fig. 8(c) corresponds to the fission-like 6Beg.s.+6LiIAS decay.
IV.3.3 3+9Be channel
As the 12O4+2 peak appears to have a significant probability of decaying to 9Bg.s. intermediate states, its analog in 12N could decay to the 3+9Be exit channel. The invariant-mass spectrum for these events is shown in Fig. 9(b) and displays a well resolved peak at an excitation energy consistent with that inferred for the 12N2++6Li peaks. See Table 4 for comparison of peak parameters from Breit-Wigner fits. However the fitted intrinsic width of this state is considerably smaller than the (=2) 2++6Li peaks, indicating that it must be associated with a different 12N level. It may even be a =1 state. However we suspect it is a =2 state, and if this is true, it implies that the observed peak in the analog spectrum, 12O4+2, is not a singlet.

Further information on the decay of this state can be gleaned from the invariant-mass spectrum of the +9Be subevents in Fig. 9(c). A prominent peak at 7.47 MeV is observed which could be one or both of the =7.470-MeV (=2+, =0) and =7.479-MeV (=2-, =1) excited states of 10B. The multiplicity of this peak is plotted as a function of 12N excitation energy in Fig. 9(a). The smooth green dashed curve was fitted to excitation-energy bins beyond the peak region and suggests that there might be a small enhancement of this intermediate state at the peak energy. However, this curve is not well constrained for energies below the peak value. Nevertheless, it is clear that this intermediate-state peak is associated with a significant fraction of the 12N3+9Be peak yield. If the 12N state is =2 as suspected, then the intermediate state must be the =1, =2- state. We also see a suggestion of some smaller yield for the =1, =3-(=8.887 MeV) and 2+ (=8.895 MeV) 10B states in the +9Be spectrum in Fig. 9(c), but it is difficult to extract multiplicities as the relative magnitude of the background is much larger.
V Discussion
V.1 Analog States
To further explore the analog states in 12O and 12N, we have looked at their consistency with the other =12 quintet states. Figure 10 plots the level scheme of the newly found levels relative to the energy of the lowest =2, =0+ state. In addition, =2 levels for 12B Charity et al. 2008 and 12Be ENS are included. There is excellent consistency for the energy of the first =2, =2+ state. The second such 2+ state in 12Be is not known, but a state at =4.580 MeV has been assigned as either 2+ or 3- ENS. This state is at the right energy to be the mirror of the 2 state in 12O and thus leads us to strongly favor the 2+ assignment.

The masses in an isospin multiplet are expected to follow the isospin multiplet mass equation (IMME),
| (3) |
if isospin is a good quantum number Benenson and Kashy 1979. The largest deviations from this behavior have been found for =8 and 9 Benenson and Kashy 1979; Lam et al. 2013; Charity et al. 2011b. Deviations from the IMME for =12 quintet were previously examined in Jager et al. 2012, but with our newer, more accurate measurement for 12O and 12N it is worth examining again. The mass excess for the quintets associated with the 0+ and first and second 2+ =2 states are plotted in Fig. 11(a). Results for 12C were taken from ENS and for the second 2+ state of 12Be, we have included the candidate state previously mentioned. The curves show fits with the quadratic IMME which can reproduce the data validating our assumption that the 12N states are =2.

Figure 11(b) shows deviations from the quadratic form for the two lower-energy quintets. The error bars on some of the points for the 2+ states are too large to look for meaningful deviations from the IMME. In the case of the 0+ states, if we include a cubic term () to Eq. (3), then we find = 1.6(37) keV consistent with zero and small compared to values of =8.36(21) keV for the =8 quintet and =6.33(16) keV for the quartet Britz et al. 1998. There is thus no evidence for deviations from the quadratic IMME for the =12 quintet.
The fission-like channels 6Beg.s.+6Beg.s., 6Beg.s.+6LiIAS, +8Cg.s., and +8BIAS remind us of the 6He+6He and +8He decay channels for levels in 12Be observed in Freer et al. 1999; Charity et al. 2007b and which were associated with a molecular :2: band structure Freer et al. 1999. The lowest member of this band was subsequently found at =10.3 MeV Yang et al. 2014; Yang et al. 2015 and shown to be =0+. The location of this level is plotted in Fig. 10 for comparison. While its excitation energy would be appropriate for an analog to the fission-like states we observed in 12O and 12N, its quoted width of = 1.5(2) MeV is too large to be consistent as more neutron-rich analogs are closer to stability and thus should have smaller widths. In any case these fission-like decay modes suggest these states have strong cluster structure.
V.2 Momentum Correlations
The momentum correlations in a 2 decay can be presented as a 2D distribution Pfützner et al. 2012 and are typically given as an energy () versus angle [] plot where
| (4) | |||
| (5) | |||
| (6) |
and the mass of the parent is , where in the nucleon mass and , , and are the momenta of the decay products.

If is the core momentum, then the and quantities are associated with the Jacobi T representation, otherwise we get the Jacobi Y representation. The quantity in the Jacobi T representation is the relative energy between the protons (), while in the Jacobi Y representation it is the relative energy between the core and one of the protons (). In the Jacobi-Y case, -1 corresponds to a small relative angle between the momenta of the two protons. The Jacobi 2D plots for 12Og.s. are compared to those obtained for ground-state emission of 6Be Egorova et al. 2012 and 16Ne Brown et al. 2014a in Fig. 12.

All these data were obtained with the same detector setup, and approximately the same beam value, so the effect of the detector resolution and efficiency will be similar. All channels display features that are expected for 2 decay, including suppressions due to the Coulomb interaction when one of the protons and the core have the same velocity vectors (e.g. 0.56, 1 in the Jacobi T plots) and when the two protons have the same velocity vectors (e.q. 0.5, =-1 in the Jacobi Y plots). It is also clear that the two protons are emitted with approximately the same kinetic energy, as the ridges in the Jacobi Y distribution are centered near 0.5.
The 12O results are remarkably similar to those for 16Neg.s., and both differ from the 6Be results in having relatively more yield for diproton-like decays, i.e., small in the Jacobi T plots or negative values in the Jacobi Y plots. Further comparison can be made with the projections of the distributions on their energy axis which are shown in Fig. 13 as the histograms. The similarity of the 12Og.s. and 16Neg.s. data are confirmed in these projections. This similarity was predicted by Grigorenko et al. in their 3-body calculations Grigorenko et al. 2002.
In addition to the ground-state emitters, we have also included projections for the 2 decays of 12NIAS and 8BIAS Brown et al. 2014b as the data points. We note all the correlation data can be subdivided into two groups with similar projections: the first group - lighter -shell systems 6Beg.s. and 8BIAS - and the second group - the heavier 12Og.s., 12NIAS, and 16Neg.s. systems. The 8BIAS 2 decay may be considered a surrogate for the first step of the decay of its analog, i.e., 8C2+6Be4+ Charity et al. 2011b. One should also note the similarity of the correlations for 12NIAS to its analog 12Og.s. reinforcing this notion. The degree of similarity is probably helped by the fact that is very similar for all systems (Table 5), as the three body-model of Grigorenko et al. indicates that there is a dependence of these projections Grigorenko and Zhukov 2003; Grigorenko et al. 2009.
The similarity for all the heavier systems is expected as they all have significant components in their wavefunction and this component dominates the decay. On the other hand, 6Beg.s. is dominated by the component, but there is some mixing with under the barrier Grigorenko and Zhukov 2003; Grigorenko et al. 2009 and the final distribution is a mixture of and components. The similarity between the projections for 6Beg.s. and 8BIAS (8Cg.s.) is quite interesting. The interior 8C wavefunction of the valence protons can contain and components. The emission of a pair of protons would be expected to yield correlations more like the heavier systems as emission is expected to have a similar phase space as Sharov et al. 2019. It is possible that the 8BIAS result is telling us that the wavefunction is dominated by the component as predicted in the complex scaling model Myo et al. 2012. However, other models predict the addition of more complex configurations in the mirror nucleus Papadimitriou et al. 2011. Calculations of the correlations for this system would help us better understand the structure of 8C, but the systematics of the presented correlations for light 2 emission demonstrate that they contain structural information for the parent state.
| Nucleus | [MeV] | Ref. |
|---|---|---|
| 6Be | 1.372 | Wang et al. 2017b |
| 8BIAS | 1.313 | Wang et al. 2017b |
| 12Og.s. | 1.718(29) | this work |
| 12NIAS | 1.165(29) | this work |
| 16Neg.s. | 1.466(20) | Brown et al. 2014a |
Figure 14 shows the Jacobi Y momentum correlations for bins centered on the three prominent peaks (0, 2, and 2) in the 2+10C invariant-mass spectra in Fig. 2(c). The 2 bin contains contributions from the shoulder state and the 2 bin contains a background contribution. Examination of the neighboring regions to these peaks suggest these contributions have similar correlations. The correlations evolve from the prompt 2 decay for the ground state [Fig. 14(a)] to a sequential-like decay for the 2 state which displays two vertical ridges [Fig. 14(c)]. The latter decay is more complicated than the classical notion of sequential as we will see, but is it useful to determine which 11N intermediate state these ridges are consistent with.

Figure 15 compares the experimental 2 correlations to simulations of sequential decay via the -matrix formalism Lane and Thomas 1958 through the 1/2- [panel (c)] first-excited state and the 3/2- [panel (d)] fourth-excited state of 11N. Both simulations produced ridges in similar locations to the experimental data. In these simulations, one ridge is vertical, corresponding to the second emitted proton whose relative energy with the core is independent of angle, and a sloping ridge, corresponding to the first emitted proton whose relative energy to the core depends of the recoil imparted by the second proton and thus dependent on . In the experimental data, the differentiation of the ridges into a vertical and sloping varieties is not obvious. It is possible that both 11N intermediate states are involved and wash out this differentiation. For example, the correlations plot in Fig. 15(b) was obtained from incoherently adding the two decay paths with equal weight. If we have contribution from the 3/2- 11N intermediate state, then as this state has a decay branch to the excited state of 10C (Sec. IV.1), this will contribute yield in the “shoulder state” (Sec. IV.1).

While there are sequential aspects of the 2 correlations in Fig. 14(c), the yield along the ridges changes rapidly with decreasing as 1. If there is no memory between the two decay steps, one expects a distribution symmetric about =0, even if there is interference between the two proposed decay paths as the two intermediate states have the same parity. Figure 16 shows the projection of the Jacobi Y distribution, corrected for the detection efficiency, as the square data points. To reduce the background contribution, the data have been selected with a narrow gate (1.4-MeV wide) at the peak of the 2 state. To estimate the remaining background, we placed a gate between the two 2+ states (triangular data points) and one above the 2 state (open circular data points) where the fits suggest the background is dominant. These background distributions have been scaled to give the total background contribution as determined in our fits and the two estimates are similar. The data show a strong dependence with the maximum near where the relative angle between the protons is =0. The background distributions cannot explain all the dependence and thus the decay path deviates from the notion of independent sequential decays where the second decay has no memory of the first apart from the dictates of angular-momentum conservation. A similar observation was found for the 2 decay of 2 state in 16Ne Brown et al. 2015 where the preference for small relative angles between the protons was explained in the 3-body model as an interference between sequential and prompt decay components. The sequential decay of the 17Ne second excited state also shows a preference for small after the proton-proton final state interaction was considered, but the magnitude was much smaller than observed here Charity et al. 2018. In the 17Ne case, the 16F intermediate state had a much smaller decay width (20 keV) than the two possible 11N intermediate states we determined for the decay of the 2 state. This suggests that this memory effect diminishes as the time between the two sequential decays increases.

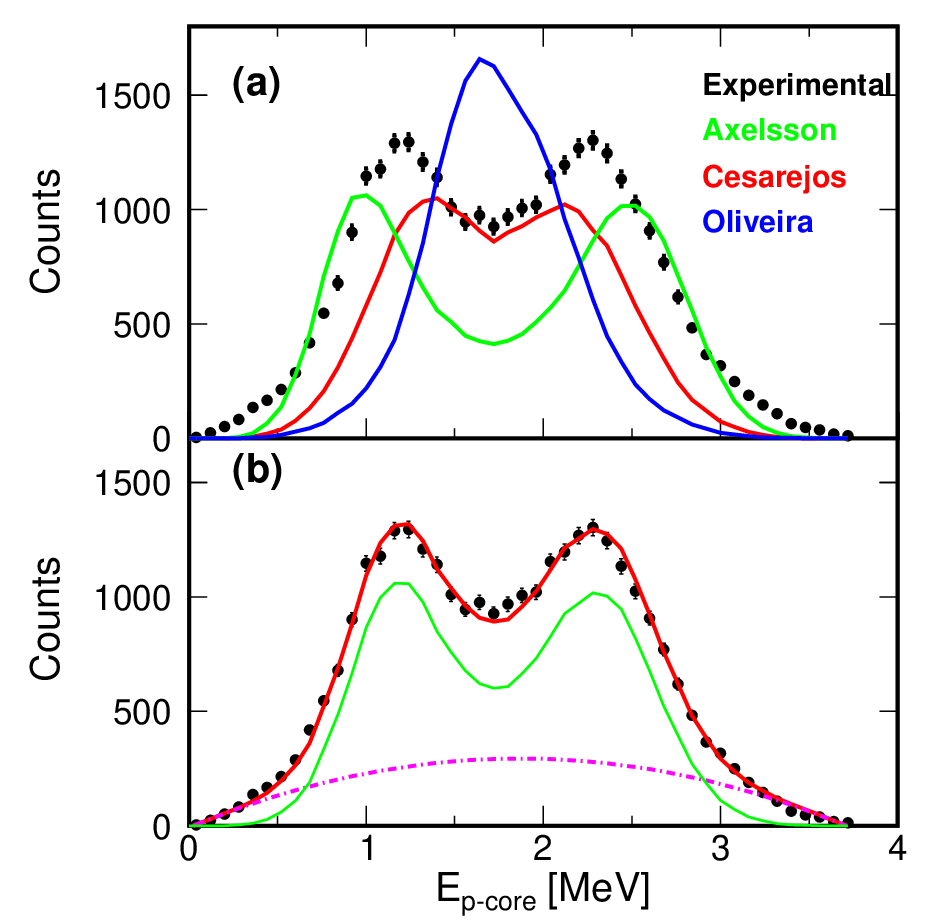
The correlations in Fig. 14(b) for the 2 state are dominated by a banana-shaped structure in the diproton region ( -0.5). A look at the upper half of the correlation plot reveals the presence of two clear ridges suggesting a sequential-like decay component. As mentioned before, the sloping ridge corresponds to the emission of the first proton. The sloping ridge is the one on the right in Fig. 14(b), so this proton has more energy than the second one. As the decay scheme in Fig. 3 shows, the only level that the state can decay through to give the correct energy ordering is the ground state of 11N. These ridges are further investigated by the energy-projection of Fig. 14(b) for 0.5 that is plotted as the data points in Fig. 17.
The resonance energy and width of 11Ng.s. is not well-defined as seen by the discrepancy of level parameters from three studies Axelsson et al. 1996; Oliveira et al. 2000; Casarejos et al. 2006 given in Table 6. These values were used in the ENSDF evaluation ENS. By examining the sequential-component, it might be possible to clear up some of the confusion about the decay parameters of this state. The curves plotted in Fig. 17 show sequential predictions obtained with the different parameter sets from these three studies. The experimental data does not appear to agree with a decay through the 11Ng.s as described by Oliveira et al. 2000. It is also difficult to claim agreement with either Axelsson et al. 1996 or Casarejos et al. 2006, as the experimental peaks appear to lie directly between the two curves. Our data would suggest an intermediate resonance energy to those from Axelsson et al. 1996; Casarejos et al. 2006. We provide our own fit to the data in Fig. 17(b) which gives a decay energy of 1.378(5) MeV and a width of 0.78(1) MeV. A smooth background (dot-dashed curve) was added to enable the reproduction of the wings of the experimental distribution.
| [MeV] | [MeV] | Authors | Ref. |
|---|---|---|---|
| 1.30(4) | 0.99 | Axelsson, et al. | Axelsson et al. 1996 |
| 1.54(2) | 0.83(3) | Casarejos, et al. | Casarejos et al. 2006 |
| 1.63(5) | 0.4(1) | Oliveira, et al. | Oliveira et al. 2000 |
| 1.378(15)11 1 Systematic uncertainty included in this case to aid in comparison to the other measurements. | 0.78(1) | This work | |
| 1.49(6) | 0.83(3) | ENSDF | ENS |
| 2, =3.803 MeV, = 0.132 MeV | |
|---|---|
| 65% | () |
| 23% | () |
| 11% | () |
| 2, =5.150 MeV, =1.027 MeV | |
| 94% | () |
| 1% | () |
| 2, =6.235 MeV, =1.982 MeV | |
| 55% | () |
| 29% | () |
| 4% | () |
| 2% | () |
| 2% | () |
| 2% | () |
V.3 Comparison to GCC predictions
The structure of 12O states have recently been predicted with the Gamow coupled-channel approach Wang et al. 2019 which treats 12O as two protons interacting with a deformed 10C core. The wavefunction of the protons is expanded using the Berggren basis, which includes bound and scattering states, thus considering the effect of the continuum. An initial comparison with the experimental levels of 12O was made in Wang et al. 2019 and the predicted ground-state width was found to be similar to the experimental value. It is interesting to see if the sequential-decay components of the observed 2+ states are consistent with the predicted internal structure. The wavefunction components predicted for the three 2+ states are listed in Table 7.
The 2 state has a sequential component which decays through the =1/2+ ground state of 11N, consistent with the sequential removal of a and then an wave proton. This matches well with the largest component of the predicted wavefunction for this state. This component and the next largest component () could also produce a sequential decay contribution through the 5/2+ state in 11N (see Fig. 3), but as the decay energy of the first proton would be small, the barrier penetration fraction appears to have suppressed it.
Our second observed 2+ state at =6.5 MeV is similar in energy to both the GCC predictions for the second and third 2+ state. The two proposed sequential components deduced from the correlation plot both involve the emission of two -wave protons and thus suggest that our observed 2 level is also the second 2+ state in the calculations, which is dominated by a () structure. Indeed the two sequential decay paths can then be interpreted as differing in the order in which the and protons are emitted.
VI CONCLUSIONS
Levels in 11N, 12N, and 12O have been observed with the invariant-mass technique using single- and multiple-nucleon knockout reactions from a 13O beam at =69.5 MeV. The charged-particle decay products produced from interactions with a 9Be target were detected with the HiRA array. The =1/2 and 3/2 levels were observed in the 11N+10C invariant-mass spectra and the 3/2- state was deduced to have decay branches to the ground and first excited states in 10C. In addition a new state was observed in this channel at either =1.073(10) or 4.416(10) MeV.
High-statistics spectra were obtained for the 2 decay of 12O in which a second 2+ state was observed for the first time. The 2 peak in this spectrum was found to have a low-energy shoulder which could have contributions from the 0, 1, or a second 2 decay branch of the 2 state to the excited state in 10C. A higher-lying 12O state was observed in the 4+2 exit channel which has contributions from a number of different decay paths including fission-like decays, i.e. +8Cg.s. and 6Beg.s.+6Beg.s..
Analogs to these 12O states were also observed in 12N. The 2+10B invariant-mass spectrum was very similar to that for 12O2+10C with the same peak structure. These peaks were shown to arise from 2 decay of =2 states to the isobaric analog state in 10B. Higher-lying =2 states were also observed in the 2++6Li spectrum corresponding to fission-like decay to +8BIAS and 6Beg.s.+6LiIAS. An additional 12N peak was found at the same excitation in the 3+9Be channels that probably is also =2, but results from the decay of a separate level.
The momentum correlations in the prompt 2 decay of 12Og.s. were found to be almost identical to those measured previously in 16Neg.s. consistent with prediction of the 3-body model of Grigorenko et al. Grigorenko et al. 2002. These correlations were also found to be rather consistent with those for the 2 decay of its isobaric analog state in 12N. The correlations for the 2 state of 12O show evidence of sequential decay through the 3/2 and/or the 1/2 intermediate states in 11N. However, the distribution of relative angles between the protons was strongly biased to small angles, qualitatively consistent with the results for the second excited states of 16Ne Brown et al. 2015. This may be a general feature of sequential decay through wide intermediate states.
The correlations for the 2 state show the presence of a significant diproton-like component, but a sequential-decay component through the ground-state of 11N is also observed. The latter component allowed for a new determination of the 11Ng.s.. Decay through this intermediate state is consistent with the internal structure at the 2 level in 12O predicted with Gamow coupled-channels calculations. No deviation from the quadratic isobaric multiplet mass equation was found for the =12 quintet.
Acknowledgements.
This material is based upon work supported by the U.S. Department of Energy, Office of Science, Office of Nuclear Physics under award numbers DE-FG02-87ER-40316, DE-FG02-04ER-41320, DE-SC0014552, DE-SC0013365 (Michigan State University), DE-SC0018083 (NUCLEI SciDAC-4 collaboration), and DE-SC0009971 (CUSTIPEN: China-U.S. Theory Institute for Physics with Exotic Nuclei); and the National Science foundation under grant PHY-156556. J.M. was supported by a Department of Energy National Nuclear Security Administration Steward Science Graduate Fellowship under cooperative agreement number DE-NA0002135.References
- Okołowicz et al. (2012) J. Okołowicz, M. Płoszajczak, and W. Nazarewicz, Prog. Theor. Phys. Supp. 196, 230 (2012), URL http://dx.doi.org/10.1143/PTPS.196.230.
- Thomas (1951) R. G. Thomas, Phys. Rev. 81, 148 (1951), URL https://link.aps.org/doi/10.1103/PhysRev.81.148.
- Ehrman (1951) J. B. Ehrman, Phys. Rev. 81, 412 (1951), URL https://link.aps.org/doi/10.1103/PhysRev.81.412.
- Grigorenko et al. (2002) L. V. Grigorenko, I. G. Mukha, I. J. Thompson, and M. V. Zhukov, Phys. Rev. Lett. 88, 042502 (2002), URL https://link.aps.org/doi/10.1103/PhysRevLett.88.042502.
- Michel et al. (2010) N. Michel, W. Nazarewicz, and M. Płoszajczak, Phys. Rev. C 82, 044315 (2010), URL https://link.aps.org/doi/10.1103/PhysRevC.82.044315.
- Egorova et al. (2012) I. A. Egorova, R. J. Charity, L. V. Grigorenko, Z. Chajecki, D. Coupland, J. M. Elson, T. K. Ghosh, M. E. Howard, H. Iwasaki, M. Kilburn, et al., Phys. Rev. Lett. 109, 202502 (2012), URL https://link.aps.org/doi/10.1103/PhysRevLett.109.202502.
- Brown et al. (2014a) K. W. Brown, R. J. Charity, L. G. Sobotka, Z. Chajecki, L. V. Grigorenko, I. A. Egorova, Y. L. Parfenova, M. V. Zhukov, S. Bedoor, W. W. Buhro, et al., Phys. Rev. Lett. 113, 232501 (2014a), URL https://link.aps.org/doi/10.1103/PhysRevLett.113.232501.
- Kryger et al. (1995) R. A. Kryger, A. Azhari, M. Hellström, J. H. Kelley, T. Kubo, R. Pfaff, E. Ramakrishnan, B. M. Sherrill, M. Thoennessen, S. Yokoyama, et al., Phys. Rev. Lett. 74, 860 (1995), URL https://link.aps.org/doi/10.1103/PhysRevLett.74.860.
- Jager et al. (2012) M. F. Jager, R. J. Charity, J. M. Elson, J. Manfredi, M. H. Mahzoon, L. G. Sobotka, M. McCleskey, R. G. Pizzone, B. T. Roeder, A. Spiridon, et al., Phys. Rev. C 86, 011304(R) (2012), URL https://link.aps.org/doi/10.1103/PhysRevC.86.011304.
- Charity et al. (2011a) R. J. Charity, J. M. Elson, J. Manfredi, R. Shane, L. G. Sobotka, B. A. Brown, Z. Chajecki, D. Coupland, H. Iwasaki, M. Kilburn, et al., Phys. Rev. C 84, 014320 (2011a), URL https://link.aps.org/doi/10.1103/PhysRevC.84.014320.
- Brown et al. (2014b) K. W. Brown, W. W. Buhro, R. J. Charity, J. M. Elson, W. Reviol, L. G. Sobotka, Z. Chajecki, W. G. Lynch, J. Manfredi, R. Shane, et al., Phys. Rev. C 90, 027304 (2014b), URL https://link.aps.org/doi/10.1103/PhysRevC.90.027304.
- Wang et al. (2017a) S. M. Wang, N. Michel, W. Nazarewicz, and F. R. Xu, Phys. Rev. C 96, 044307 (2017a), URL https://link.aps.org/doi/10.1103/PhysRevC.96.044307.
- Wang and Nazarewicz (2018) S. M. Wang and W. Nazarewicz, Phys. Rev. Lett. 120, 212502 (2018), URL https://link.aps.org/doi/10.1103/PhysRevLett.120.212502.
- Webb et al. (2019) T. B. Webb, S. M. Wang, K. W. Brown, R. J. Charity, J. M. Elson, J. Barney, G. Cerizza, Z. Chajecki, J. Estee, D. E. M. Hoff, et al., Phys. Rev. Lett. 122, 122501 (2019), URL https://link.aps.org/doi/10.1103/PhysRevLett.122.122501.
- Wang et al. (2019) S. M. Wang, W. Nazarewicz, R. J. Charity, and L. G. Sobotka, Phys. Rev. C 99, 054302 (2019), URL https://link.aps.org/doi/10.1103/PhysRevC.99.054302.
- Bazin et al. (2009) D. Bazin, V. Andreev, A. Becerril, M. Doléans, P. Mantica, J. Ottarson, H. Schatz, J. Stoker, and J. Vincent, Nucl. Instrum. Methods A 606, 314 (2009), URL http://www.sciencedirect.com/science/article/pii/S0168900209011425.
- Wallace et al. (2007) M. Wallace, M. Famiano, M.-J. van Goethem, A. Rogers, W. Lynch, J. Clifford, F. Delaunay, J. Lee, S. Labostov, M. Mocko, et al., Nucl Instrum. Methods A 583, 302 (2007), URL http://www.sciencedirect.com/science/article/pii/S016890020701947X.
- Engel et al. (2007) G. L. Engel, M. Sadasivam, M. Nethi, J. M. Elson, L. G. Sobotka, and R. J. Charity, Nucl. Instrum. Methods A 573, 418 (2007).
- Charity et al. (2019) R. J. Charity, K. W. Brown, J. Elson, W. Reviol, L. G. Sobotka, W. W. Buhro, Z. Chajecki, W. G. Lynch, J. Manfredi, R. Shane, et al., Phys. Rev. C 99, 044304 (2019), URL https://link.aps.org/doi/10.1103/PhysRevC.99.044304.
- Sobotka et al. (2013) L. G. Sobotka, W. W. Buhro, R. J. Charity, J. M. Elson, M. F. Jager, J. Manfredi, M. H. Mahzoon, A. M. Mukhamedzhanov, V. Eremenko, M. McCleskey, et al., Phys. Rev. C 87, 054329 (2013), URL https://link.aps.org/doi/10.1103/PhysRevC.87.054329.
- Ajzenberg-Selove (1990) F. Ajzenberg-Selove, Nucl. Phys. A 506, 1 (1990), URL http://www.sciencedirect.com/science/article/pii/037594749090271M.
- Suzuki et al. (2016) D. Suzuki, H. Iwasaki, D. Beaumel, M. Assié, H. Baba, Y. Blumenfeld, F. de Oliveira Santos, N. de Séréville, A. Drouart, S. Franchoo, et al., Phys. Rev. C 93, 024316 (2016), URL https://link.aps.org/doi/10.1103/PhysRevC.93.024316.
- (23) Evaluated Nuclear Structure Data File (ENSDF), http://www.nndc.bnl.gov/ensdf/.
- Fortune, H. T. (2016) Fortune, H. T., Eur. Phys. J. A 52, 11 (2016), URL https://doi.org/10.1140/epja/i2016-16011-8.
- Fortune (2016) H. T. Fortune, J. Phys. G 43, 115102 (2016), URL http://stacks.iop.org/0954-3899/43/i=11/a=115102.
- Fortune and Sherr (2011) H. T. Fortune and R. Sherr, Phys. Rev. C 83, 044313 (2011), URL https://link.aps.org/doi/10.1103/PhysRevC.83.044313.
- Charity et al. (2011b) R. J. Charity, J. M. Elson, J. Manfredi, R. Shane, L. G. Sobotka, Z. Chajecki, D. Coupland, H. Iwasaki, M. Kilburn, J. Lee, et al., Phys. Rev. C 84, 051308(R) (2011b), URL https://link.aps.org/doi/10.1103/PhysRevC.84.051308.
- Charity et al. (2007a) R. J. Charity, K. Mercurio, L. G. Sobotka, J. M. Elson, M. Famiano, A. Banu, C. Fu, L. Trache, and R. E. Tribble, Phys. Rev. C 75, 051304(R) (2007a), URL https://link.aps.org/doi/10.1103/PhysRevC.75.051304.
- Charity et al. (2008) R. J. Charity, S. A. Komarov, L. G. Sobotka, J. Clifford, D. Bazin, A. Gade, J. Lee, S. M. Lukyanov, W. G. Lynch, M. Mocko, et al., Phys. Rev. C 78, 054307 (2008), URL https://link.aps.org/doi/10.1103/PhysRevC.78.054307.
- Yang et al. (2015) Z. H. Yang, Y. L. Ye, Z. H. Li, J. L. Lou, J. S. Wang, D. X. Jiang, Y. C. Ge, Q. T. Li, H. Hua, X. Q. Li, et al., Phys. Rev. C 91, 024304 (2015), URL https://link.aps.org/doi/10.1103/PhysRevC.91.024304.
- Benenson and Kashy (1979) W. Benenson and E. Kashy, Rev. Mod. Phys. 51, 527 (1979), URL https://link.aps.org/doi/10.1103/RevModPhys.51.527.
- Lam et al. (2013) Y. H. Lam, B. Blank, N. A. Smirnova, J. B. Bueb, and M. S. Antony, At. Data Nucl. Tables 99, 680 (2013), URL http://www.sciencedirect.com/science/article/pii/S0092640X13000569.
- Britz et al. (1998) J. Britz, A. Pape, and M. Antony, At. Data Nucl. Tables 69, 125 (1998), URL http://www.sciencedirect.com/science/article/pii/S0092640X98907732.
- Freer et al. (1999) M. Freer, J. C. Angélique, L. Axelsson, B. Benoit, U. Bergmann, W. N. Catford, S. P. G. Chappell, N. M. Clarke, N. Curtis, A. D’Arrigo, et al., Phys. Rev. Lett. 82, 1383 (1999), URL https://link.aps.org/doi/10.1103/PhysRevLett.82.1383.
- Charity et al. (2007b) R. J. Charity, S. A. Komarov, L. G. Sobotka, J. Clifford, D. Bazin, A. Gade, J. Lee, S. M. Lukyanov, W. G. Lynch, M. Mocko, et al., Phys. Rev. C 76, 064313 (2007b), URL https://link.aps.org/doi/10.1103/PhysRevC.76.064313.
- Yang et al. (2014) Z. H. Yang, Y. L. Ye, Z. H. Li, J. L. Lou, J. S. Wang, D. X. Jiang, Y. C. Ge, Q. T. Li, H. Hua, X. Q. Li, et al., Phys. Rev. Lett. 112, 162501 (2014), URL https://link.aps.org/doi/10.1103/PhysRevLett.112.162501.
- Pfützner et al. (2012) M. Pfützner, M. Karny, L. V. Grigorenko, and K. Riisager, Rev. Mod. Phys. 84, 567 (2012), URL https://link.aps.org/doi/10.1103/RevModPhys.84.567.
- Grigorenko and Zhukov (2003) L. V. Grigorenko and M. V. Zhukov, Phys. Rev. C 68, 054005 (2003), URL https://link.aps.org/doi/10.1103/PhysRevC.68.054005.
- Grigorenko et al. (2009) L. V. Grigorenko, T. D. Wiser, K. Mercurio, R. J. Charity, R. Shane, L. G. Sobotka, J. M. Elson, A. H. Wuosmaa, A. Banu, M. McCleskey, et al., Phys. Rev. C 80, 034602 (2009), URL https://link.aps.org/doi/10.1103/PhysRevC.80.034602.
- Sharov et al. (2019) P. G. Sharov, L. V. Grigorenko, A. N. Ismailova, and M. V. Zhukov, JETP Letters (2019), ISSN 1090-6487, URL https://doi.org/10.1134/S0021364019130046.
- Myo et al. (2012) T. Myo, Y. Kikuchi, and K. Katō, Phys. Rev. C 85, 034338 (2012), URL https://link.aps.org/doi/10.1103/PhysRevC.85.034338.
- Papadimitriou et al. (2011) G. Papadimitriou, A. T. Kruppa, N. Michel, W. Nazarewicz, M. Płoszajczak, and J. Rotureau, Phys. Rev. C 84, 051304(R) (2011), URL https://link.aps.org/doi/10.1103/PhysRevC.84.051304.
- Wang et al. (2017b) M. Wang, G. Audi, F. Kondev, W. J. Huang, S. Naimi, and Xing Xu, Chin. Phys. C 41, 030003 (2017b).
- Lane and Thomas (1958) A. M. Lane and R. G. Thomas, Rev. Mod. Phys. 30, 257 (1958), URL https://link.aps.org/doi/10.1103/RevModPhys.30.257.
- Brown et al. (2015) K. W. Brown, R. J. Charity, L. G. Sobotka, L. V. Grigorenko, T. A. Golubkova, S. Bedoor, W. W. Buhro, Z. Chajecki, J. M. Elson, W. G. Lynch, et al., Phys. Rev. C 92, 034329 (2015), URL https://link.aps.org/doi/10.1103/PhysRevC.92.034329.
- Charity et al. (2018) R. J. Charity, K. W. Brown, J. Okołowicz, M. Płoszajczak, J. M. Elson, W. Reviol, L. G. Sobotka, W. W. Buhro, Z. Chajecki, W. G. Lynch, et al., Phys. Rev. C 97, 054318 (2018), URL https://link.aps.org/doi/10.1103/PhysRevC.97.054318.
- Axelsson et al. (1996) L. Axelsson, M. J. G. Borge, S. Fayans, V. Z. Goldberg, S. Grévy, D. Guillemaud-Mueller, B. Jonson, K. M. Källman, T. Lönnroth, M. Lewitowicz, et al., Phys. Rev. C 54, R1511 (1996), URL https://link.aps.org/doi/10.1103/PhysRevC.54.R1511.
- Oliveira et al. (2000) J. M. Oliveira, A. Lépine-Szily, H. G. Bohlen, A. N. Ostrowski, R. Lichtenthäler, A. Di Pietro, A. Laird, G. F. Lima, L. Maunoury, F. de Oliveira Santos, et al., Phys. Rev. Lett. 84, 4056 (2000), URL https://link.aps.org/doi/10.1103/PhysRevLett.84.4056.
- Casarejos et al. (2006) E. Casarejos, C. Angulo, P. J. Woods, F. C. Barker, P. Descouvemont, M. Aliotta, T. Davinson, P. Demaret, M. Gaelens, P. Leleux, et al., Phys. Rev. C 73, 014319 (2006), URL https://link.aps.org/doi/10.1103/PhysRevC.73.014319.