SPATIALLY RESOLVED WATER EMISSION FROM GRAVITATIONALLY LENSED DUSTY STAR FORMING GALAXIES AT 3
Abstract
Water (H2O), one of the most ubiquitous molecules in the universe, has bright millimeter-wave emission lines easily observed at high-redshift with the current generation of instruments. The low excitation transition of H2O, p- ( = 987.927 GHz) is known to trace the far-infrared (FIR) radiation field independent of the presence of active galactic nuclei (AGN) over many orders-of-magnitude in FIR luminosity (). This indicates that this transition arises mainly due to star formation. In this paper, we present spatially (0.5 corresponding to 1 kiloparsec) and spectrally resolved (100 kms-1) observations of p- in a sample of four strong gravitationally lensed high-redshift galaxies with the Atacama Large Millimeter/submillimeter Array (ALMA). In addition to increasing the sample of luminous ( L⊙) galaxies observed with H2O, this paper examines the / relation on resolved scales for the first time at high-redshift. We find that is correlated with on both global and resolved kiloparsec scales within the galaxy in starbursts and AGN with average /. We find that the scatter in the observed / relation does not obviously correlate with the effective temperature of the dust spectral energy distribution (SED) or the molecular gas surface density. This is a first step in developing p- as a resolved star formation rate (SFR) calibrator.
Keywords:
galaxies: high-redshift — galaxies: ISMI Introduction
Studies of molecules play a prominent role in understanding the physical, chemical and kinematic properties of the interstellar medium (ISM) in galaxies (Omont 2007; Tielens 2013). One such molecule is H2O, the third most abundant molecule in the warm dense ISM after H2 and CO (Neufeld et al. 1995). As an asymmetric rotor with a large electric dipole moment, H2O has a rich and complex spectrum giving rise to emission and absorption lines mainly in the submillimeter (submm) and far-infrared (FIR) regime of the electromagnetic spectrum. Observations from local galaxies (Weiß et al. 2010; van der Werf et al. 2010; Rangwala et al. 2011; Yang et al. 2013), high redshift ultra luminous infrared galaxies (ULIRGs) (Omont et al. 2013; Yang et al. 2016), and active galactic nuclei (AGN) (van der Werf et al. 2011) have shown H2O emission to be ubiquitous with intensities as bright as CO lines. Modeling has shown that, in addition to infrared pumping where H2O is excited by FIR photons, collisions also contribute to the intensities of low-excitation transitions (González-Alfonso et al. 2010; González-Alfonso et al. 2012, e.g.). This is best represented in Figure 3 from Liu et al. 2017 which shows the prominent H2O lines in different ISM components. The low excitation lines become weaker or completely disappear in the warm and hot regions ( 40 K) where infrared pumping dominates over collisions. The higher excitation transitions which require strong far-infrared radiation density are mainly found in the hotter regions ( K) of the galaxy. The cascading emission lines, p- (Eup = 100.8 K, = 987.927 GHz), p- (Eup = 137 K, = 752.033 GHz) and p- (Eup = 196 K, = 1228.789 GHz) are pumped by 101 m photons from the base 11,1 level and are primarily excited in the warm regions of the galaxy. The collisional excitation of the low lying levels (11,1 and 20,2) in optically thin or high density hot regions might also contribute to the emission of the p- line. Hence, H2O transitions probe the infrared radiation field density and physical properties of the ISM such as gas density and kinetic temperature (Weiß et al. 2010; González-Alfonso et al. 2014; Liu et al. 2017, e.g.).
Because of water vapor in the Earth’s atmosphere, ground-based observations of H2O in the local universe are nearly always impossible. The Herschel Space Observatory opened the window to multiple H2O transitions in the local universe (Weiß et al. 2010, e.g.) and Yang et al. 2013 demonstrated that the luminosity of submm H2O lines () is linearly correlated with the total infrared luminosity (, integrated over ) over three orders of magnitude in multiple transitions. This suggests that the H2O transitions, especially p- which is not affected by the presence of AGN (Yang et al. 2013), trace the far infrared field in star forming regions. At high redshift, H2O has been detected using the current generation of ground-based telescopes such as the CSO, PdBI and ALMA, as the transitions are redshifted into the transparent millimeter atmospheric windows. Strong gravitational lensing, which acts as a cosmic microscope, further boosts the flux from high-redshift sources making their detections possible. Several detections of H2O have been reported in the literature from such lensed galaxies (Bradford et al. 2009; Omont et al. 2011; van der Werf et al. 2011; Combes et al. 2012; Weiß et al. 2013; Omont et al. 2013; Bothwell et al. 2013a; Spilker et al. 2014; Yang et al. 2016, e.g.).
Multi-wavelength observations ranging from the UV to radio have improved our understanding of interstellar physics and the star formation rate (SFR) calibration. Average scaling relations from single observables are often used to estimate global SFR. Obtaining resolved SFR maps is challenging due to the difficulty in observing individual star forming regions over multiple wavelengths. Far-infrared luminosity of galaxies (, integrated over 42.5122.5 ) is often used to infer SFR as it has some advantages over other indicators such as UV luminosity and recombination lines which are widely discussed in Kennicutt 1998 and Kennicutt & Evans 2012. The UV emission from young stars is a direct tracer of star formation but is highly sensitive to interstellar dust attenuation. The recombination lines such as H and FIR cooling lines (e.g. [CII] 158 m) originate in the ionized regions surrounding stars and are good tracers of star formation. However, these lines are affected either by dust attenuation (Casey et al. 2017, e.g.) or the scatter in the estimated SFR is large (Narayanan & Krumholz 2017; Lagache et al. 2018, e.g.). In contrast, is a good tracer of SFR at high optical depth, such as starburst galaxies where most of the UV light is re-emitted as infrared radiation. Although, it is widely used as a SFR calibrator in high-redshift starburst galaxies (see review by Casey et al. 2014), the spectral energy distribution (SED) has to be fully sampled over the SED peak at m to estimate , which is observationally expensive. However, one further caveat is that infrared emission does not necessarily trace only the unobscured star formation. For instance, may overestimate the SFR in regions where there are other sources of dust heating such as evolved older stars or an obscured AGN (Kennicutt et al. 2009; Murphy et al. 2011; Hayward et al. 2014, e.g.). Longer wavelength spectral features such as p-, which are very well correlated with and observable with current generation telescopes, can be used instead of to estimate SFR (in environments where the based calibration holds true). Figure 1 summarizes some of the measurements from the literature and shows that p- is almost linearly correlated with with Pearson’s correlation coefficient of 0.96. Among the CO transitions, it has been observed that mid to highJ CO transitions (e.g. CO(65) and CO(76)) are a good tracer of both in local and high-redshift (U)LIRGs (Lu et al. 2015; Yang et al. 2017, e.g.). However, sub-linear slopes in the -LCO correlation arising possibly from shocks/turbulence and detached from star formation have also been discussed in highJ CO lines (e.g. Greve et al. 2014, see section IV.4). While CO is collisionally excited by H2 molecules, p- is excited by FIR photons which makes H2O a more direct tracer of star formation. In nearby luminous galaxies, dense gas tracers such as HCN and CS are shown to be tightly correlated with while HCO has a slightly super-linear correlation (Gao & Solomon 2004; Zhang et al. 2014, e.g.). p- is a bright emission line (compared to HCN/HCO) which is easily observable both in local and high-redshift galaxies. The linear correlation between and from Figure 1 suggests that it is a better tracer of compared to other commonly observed lines such as CO(10), CO(65) and [CII]. While the correlation is tight on the global integrated scales, it is unclear if this correlation breaks down on resolved scales.

In this work, we show that traces far infrared radiation not just at the integrated global scale (Yang et al. 2013; Omont et al. 2013; Yang et al. 2016) but also at resolved scales within galaxies at high redshift. The resolution of the observations is 0.5 ″ which corresponds to 1 kiloparsec given the magnification and redshift of the sources from Spilker et al. 2014 (the beam resolution and the physical scale for each source are given in Table 1 and Table 3 respectively). This physical scale is only an approximation as we do not perform lens modeling in this analysis and adopt magnification values obtained from 870 m imaging. We have selected a sample of strong-gravitationally lensed dusty star forming galaxies (DSFGs) discovered in the South Pole Telescope (SPT) survey (Vieira et al. 2010; Carlstrom et al. 2011; Mocanu et al. 2013). DSFGs host intense star formation with SFR 10 1000 M⊙/yr (Casey et al. 2014; Narayanan et al. 2015, e.g.). These galaxies are bright in submm wavelengths as the ultraviolet (UV) radiation from young stars is absorbed and re-radiated by the dust in FIR. Long-wavelength dust continuum observations of such galaxies have the advantage of “negative - K correction” (Blain & Longair 1993), where the decrease in flux due to increase in cosmological distance is compensated by the rising flux on the RayleighJeans side of the SED. Thus, sources of a given luminosity can be detected largely independent of redshift. This, in addition to gravitational lensing and the power of ALMA provides enough sensitivity and resolution to investigate the correlation between and at resolved scales in star forming galaxies which we present in this paper.
In section II, we summarize the ALMA observations taken over two cycles and the data reduction procedure. In section III, we present the results estimating the infrared luminosity and line properties. In section IV, we analyze the results on correlation and the effect of physical properties on this correlation. We conclude with a summary in section V. Hereafter, H2O refers to p- at 987.927 GHz and / refers to . We use Planck 2015 flat CDM cosmology where = 0.677, = 0.307 and = 0.693 (Planck Collaboration et al. 2016). We estimate the total infrared luminosity () as flux integrated from 81000 and total far-infrared luminosity () from 42.5122.5 in rest frame (Helou et al. 1985).
II Observations and Data Analysis
We choose p- as it is one of the brightest H2O transitions and has been observed to be well correlated with (Yang et al. 2013; Liu et al. 2017, e.g.). This line also falls in the transparent ALMA Band 6 for the given redshift range of the sources (2.78 3.37). We observed the p- 987.927 GHz line in SPT0529-54 ( = 3.369), SPT0532-50 ( = 3.399) and SPT0538-50 ( = 2.782) with ALMA. We also include archival data on the Cloverleaf quasar, a strongly-lensed AGN at = 2.558 in this analysis. The source properties are listed in Table 1.
II.1 Sample Selection
The three SPT targets were selected such that they are at a similar redshift and within 10∘ of each other on the sky. This selection was chosen to observe the same line transition in the three galaxies and to make observations efficient for resolved ALMA Band 9 continuum observations, which where A-rated in Cycle 5, but not yet observed. All three sources have ALMA 870 m imaging and lens models (Spilker et al. 2016). SPT0538-50 is a possible ongoing major merger as seen from dust continuum models (Bothwell et al. 2013b) and has resolved CO and CO ATCA observations (Aravena et al. 2013; Spilker et al. 2015). SPT0529-54 and SPT0532-50 have resolved CO observations from ALMA (Dong et al. 2019) which we make use of in this work. The Cloverleaf quasar (also known as H1413+117 or QSO J1415+1129) is an extensively studied strongly-lensed AGN at high redshift (Solomon et al. 2003; Weiß et al. 2003, e.g.) which can be compared against the star forming galaxies in this sample.
| Source name | IAU name | RA | DEC | Beam | SNRline | ||||
| [mJy/ | |||||||||
| ( J2000 ) | ( J2000 ) | [ GHz ] | [GHz] | [ ] | beam] | ||||
| SPT0529-54 | SPT-S J052903-5436.6 | 05:29:03.37 | -54:36:40.30 | 3.3689 | 226.13 | 224.87 | 1.10 1.06 | 0.17 | 7.5 |
| SPT0532-50 | SPT-S J053250-5047.1 | 05:32:51.27 | -50:47:09.50 | 3.3988 | 224.59 | 223.80 | 0.73 0.56 | 0.18 | 24.4 |
| SPT0538-50 | SPT-S J053816-5030.8 | 05:38:16.83 | -50:30:52.00 | 2.7817 | 260.98 | 259.32 | 0.63 0.51 | 0.22 | 18.6 |
| Cloverleaf | H 1413+117 | 14:15:46.24 | 11:29:43.68 | 2.5579 | 277.67 | 278.83 | 0.54 0.50 | 1.07 | 11.8 |
| NOTE. - The position (RA, DEC) and redshift () of the SPT sources are taken from ALMA 870 m imaging in Spilker et al. 2016 and Weiß et al. 2013 respectively. The redshift of the Cloverleaf quasar is found in Solomon et al. 2003. is the observed frequency of p- transition at 987.927 GHz rest frequency. is the frequency of the continuum. The beam size and the sensitivity per beam in the continuum map () at are shown in columns 8 and 9. The peak signal-to-noise of the H2O line (SNRline) with 50 kms-1 channel resolution in all sources except SPT0529-54 with 100 kms-1 channel width is shown in the last column. | |||||||||
| Cycle | Proposal ID | Source | Date | Time on source | Antennas | Baseline | PWV |
| [ h ] | [ m ] | [mm] | |||||
| 4 | 2016.1.01554.S | SPT0529-54 | 05 Dec, 2016 | 1.01 | 41 | 15.1 650.3 | 1.57 1.84 |
| SPT0532-50 | 03 Dec, 2016 | 0.38 | 40 | 15.1 704.1 | 0.53 0.56 | ||
| SPT0538-50 | 05 Dec, 2016 | 0.90 | 41 | 15.1 650.3 | 1.57 1.78 | ||
| 3 | 2015.1.01578.S | SPT0532-50 | 22 June, 2016 | 0.41 | 38 | 15.1 704.1 | 1.27 1.32 |
| SPT0538-50 | 22 June, 2016 | 0.74 | 38 | 15.1 704.1 | 1.23 1.28 | ||
| 2 | 2012.1.00175.S | Cloverleaf | 30 June, 2015 | 0.16 | 42 | ||
| NOTE. - The baseline given in the table is the minimum and maximum. The last column shows the range of Precipitable Water Vapor (PWV) over the course of the observations. | |||||||
II.2 Data Reduction and Imaging
For SPT0532-50 and SPT0538-50, the observations are taken with ALMA in Cycle 3 (2015.1.01578.S) and Cycle 4 (2016.1.01554.S). SPT0529-54 was observed only in Cycle 4. The Cloverleaf quasar archival data is from ALMA 2012.1.00175.S (PI: Van Der Werf). In both Cycle 3 and Cycle 4, the SPT sources are observed in two basebands each with 2 GHz bandwidth and 240 channels with a channel resolution of 1.875 MHz. The p- line and continuum in the Cloverleaf was taken over a continuous bandwidth with two basebands each 2 GHz wide, 128 channels and channel resolution of 15.625 MHz. The observations are summarized in Table 2.
All the data are calibrated using the ALMA pipeline for the respective cycles. We inspected the quality of the reduction manually and found no major problems. The data were reduced and imaged using the Common Astronomy Software Application package CASA (McMullin et al. 2007). We imaged the continuum by combining data from all the spectral windows and by excluding the line emission using the task CLEAN. The frequency of the continuum image is given in Table 1. An outer taper of 1.0′′ and 0.5′′ is applied to SPT0529-54 and the Cloverleaf respectively such that the visibilities at shorter baselines are weighted more. This increases the signal-to-noise at the expense of resolution of the image. A natural weighting is applied to all the sources. All the pixels in the image plane are correlated in the interferometric data. In order to have minimum number of correlated pixels, we choose to have few pixels in a beam (3 to 5). The continuum images are shown in Figure 2. We create a mask such that only the pixels with signal-to-noise 3 in the continuum are selected. We use this mask for all the resolved analysis in this paper.
To get the spectral cubes, we use natural weighting for all the sources and 1.0′′ and 0.5′′ outer taper to SPT0529-54 and the Cloverleaf respectively, same as the continuum map. We use 50 kms-1 velocity averaging for SPT0532-50, SPT0538-50 and the Cloverleaf and 100 kms-1 in SPT0529-54. For the velocity integrated intensity map (moment 0), in order to increase the signal-to-noise ratio, we re-image the data to create a single wide channel which contains most of the line flux. The width of this channel is 2 x FWHM of the line (see Table 3 for FWHM and integrated line flux values). All the moment 0 maps are imaged similar to the continuum map and the cube. The moment 0 contours are overlaid on the continuum image in Figure 2.
It has been shown by many studies that the CO gas sizes can be larger than that of the infrared emission (Spilker et al. 2015; Tadaki et al. 2017; Calistro Rivera et al. 2018; Dong et al. 2019, e.g.). As H2O and CO are observed to have similar line profiles (e.g. Omont et al. 2013; Yang et al. 2016, and Appendix A3 (IX) ), it is likely that H2O and CO are both tracing similar regions. Hence, H2O could be also more extended than dust. In our analysis, the mask selected from the continuum includes 95100 of the total H2O flux (depending on the source) and any possible additional extended emission would be small and not affect our results. Moreover, selecting a mask based on continuum is less biased because of the high signal-to-noise in every pixel in the continuum unlike the moment 0 map.


 |


 |
III Results
III.1 Estimating
To fit the SED (and estimate the total ) in the SPT sources, we use the unresolved millimeter and submm photometry from ALMA (3 mm), SPT (2.0 and 1.4 mm), LABOCA (870 m), and Herschel (500, 350, 250, 160 and 100 m) (Vieira et al. 2013; Strandet et al. 2016). For the Cloverleaf, we use the unresolved photometry from Weiß et al. 2003 (references therein). We fit the modified blackbody function given by Equation 1 with Markov Chain Monte Carlo (MCMC) algorithm using the emcee (Foreman-Mackey et al. 2013) package to sample the posterior probability function:
| (1) |
where is the rest frequency, is the source solid angle, B is the Planck function estimated at dust temperature and is the optical depth. At long wavelengths, is given by with being the wavelength at which the optical depth is unity (Draine 2006, e.g.) and is the spectral index which determines the slope of the RayleighJeans tail of the blackbody. This is the same method used previously in, e.g., Greve et al. 2012 and Spilker et al. 2016. It should be noted that this simplistic modified blackbody function applies only with the assumption that the entire source has a single Td and that the source is uniform (Hayward et al. 2012, e.g.). Moreover, , and temperature distribution are degenerate (Papadopoulos et al. 2010).
In this analysis we consider photometry points 50 m rest frame. The value converges to 2 for the SPT sample which has a well sampled SED. For the SPT sources and the Cloverleaf, we fix to 2 and let the amplitude (), and vary. To investigate / at resolved scales, the for each pixel is obtained by scaling the of the entire source using the flux contribution of each pixel to the total continuum flux i.e.
| (2) |
where denotes pixel and S is the continuum flux obtained by combining all the spectral windows from the observations excluding the line. It should be noted that the resolved is estimated by scaling the continuum which is not in the FIR regime i.e. not around the peak of the SED (the frequencies of the continuum are given in Table 1). Hence, the variations in dust temperature, optical depth, et cetera, across the source are not taken into account in this analysis, and we assume that the galaxies have uniform temperature and opacity distribution. Improvement on this assumption would require spatially resolved continuum observations that sample the peak of the dust SED at rest-frame 100 m (which as of this date have been approved, but not observed).
III.2 Literature Sample
We draw our sample of sources detected at both low and high redshift, in p-, from the literature. The local sample is drawn from the Herschel Science Archive (Yang et al. 2013) and the AGN in this sample are identified in Koss et al. 2013. The FIR luminosity in the local galaxies is estimated by fitting 60 and 100 m photometry (Sanders et al. 2003) with a modified blackbody as discussed in Section III.1. We fix = 2.0 to be consistent with the SPT sources and to 100 m (Draine 2006) as there are only two photometry points available.
The high-redshift ULIRGs include SPT0346-52
(Apostolovski et al. 2019), SPT0125-47 (Appendix A2 [VIII]), HFLS3 (Riechers et al. 2013), APM08279+5255 (van der Werf et al. 2011), G12.v2.30, NBV1.78, SDP17b, NAV1.195 and SDP11 (Omont et al. 2013; Yang et al. 2016). in HFLS3 is estimated using photometry taken from Riechers et al. 2013 and magnification from Cooray et al. 2014. In the quasar APM08279+5255, is taken from Weiß et al. 2007; Beelen et al. 2006 and magnification from Riechers et al. 2009. in all the other sources (except SPT sources) are estimated similarly as for the local galaxies (fixing and ) using 250, 350, 500 and 880 m photometry and magnification from Bussmann et al. 2013. All the high-redshift ULIRG values are given in Table 5.
III.3 Spectral Analysis and
To obtain the spatially integrated flux density in each of the 50 or 100 kms-1 wide channels, we apply the continuum mask to each velocity bin of the spectral cube and integrate within the region selected. Selecting a mask based on the continuum flux is less biased because of the high signal-to-noise in every pixel in the continuum unlike the moment 0 map. This mask includes 95100 of the total water emission. The resultant spectra are shown in Figure 2. We use the standard deviation of flux density in line-free channels as the error in each velocity bin. To obtain the line properties, we use the non-parametric estimation of line width described in Bothwell et al. 2013b which is a preferred method than fitting a simple Gaussian profile, especially if the line profile is asymmetric. The intensity weighted second moment of the spectrum is given by:
| (3) |
where is the intensity weighted frequency centroid, is the integrated flux at frequency and the FWHM of the line is estimated as FWHM 2.35. The line properties estimated with this method are listed in Table 3 along with the velocity integrated line flux ( in Jy kms-1). We obtain the line luminosity from the relation given in Solomon & Vanden Bout 2005:
| (4) |
where is the total line luminosity in units of , is the rest frequency of the line in GHz (987.927 GHz for the p- transition) and is the luminosity distance to the source at a redshift z in Mpc. We estimate in each pixel by using the above equation with (the integrated line flux of the pixel taken from the moment 0 image).
| Source | ra | Scont | S | / | |||||
|---|---|---|---|---|---|---|---|---|---|
| [kpc] | [mJy] | [1012 L⊙] | [mJy] | [kms-1] | [Jy kms-1] | [108 L⊙] | [10-5] | ||
| SPT0529-54 | 13.2 0.8 | 2.3 | 32.9 0.1 | 30.84 4.96 | 7.7 1.0 | 675 235 | 2.8 0.6 | 5.94 1.18 | 1.92 0.49 |
| SPT0532-50 | 10.0 0.6 | 1.7 | 42.3 0.1 | 68.33 9.81 | 17.6 0.6 | 475 44 | 10.4 0.2 | 22.25 0.38 | 3.26 0.47 |
| SPT0538-50 | 20.1 1.8 | 1.1 | 58.3 0.1 | 63.91 10.55 | 27.7 1.5 | 463 144 | 8.8 1.3 | 13.59 2.08 | 2.13 0.48 |
| Cloverleaf | 11 | 0.4 | 20.1 0.2 | 70.91 15.47 | 49.9 3.7 | 434 156 | 17.0 2.4 | 22.63 3.17 | 3.19 0.83 |
| NOTE. - Magnification () of the SPT sources are taken from ALMA 870 m lens models Spilker et al. 2016. Magnification of the Cloverleaf quasar is found in Venturini & Solomon 2003. a) r is the effective resolution in kiloparsec achieved per beam (beam size is given in Table 1) in the source plane. Scont is the spatially integrated continuum flux ( 3) and is the observed far-infrared luminosity. S is the peak line flux and is the FWHM of the spatially integrated spectrum which are derived using the non-parametric method of estimating line properties (Section III.3). is velocity integrated line flux under the colored region shown in Figure 2. is the observed H2O luminosity. The error on / takes into account both the error on luminosities and magnification. | |||||||||
IV Analysis and Discussion
IV.1 Correlation and SFR Calibration
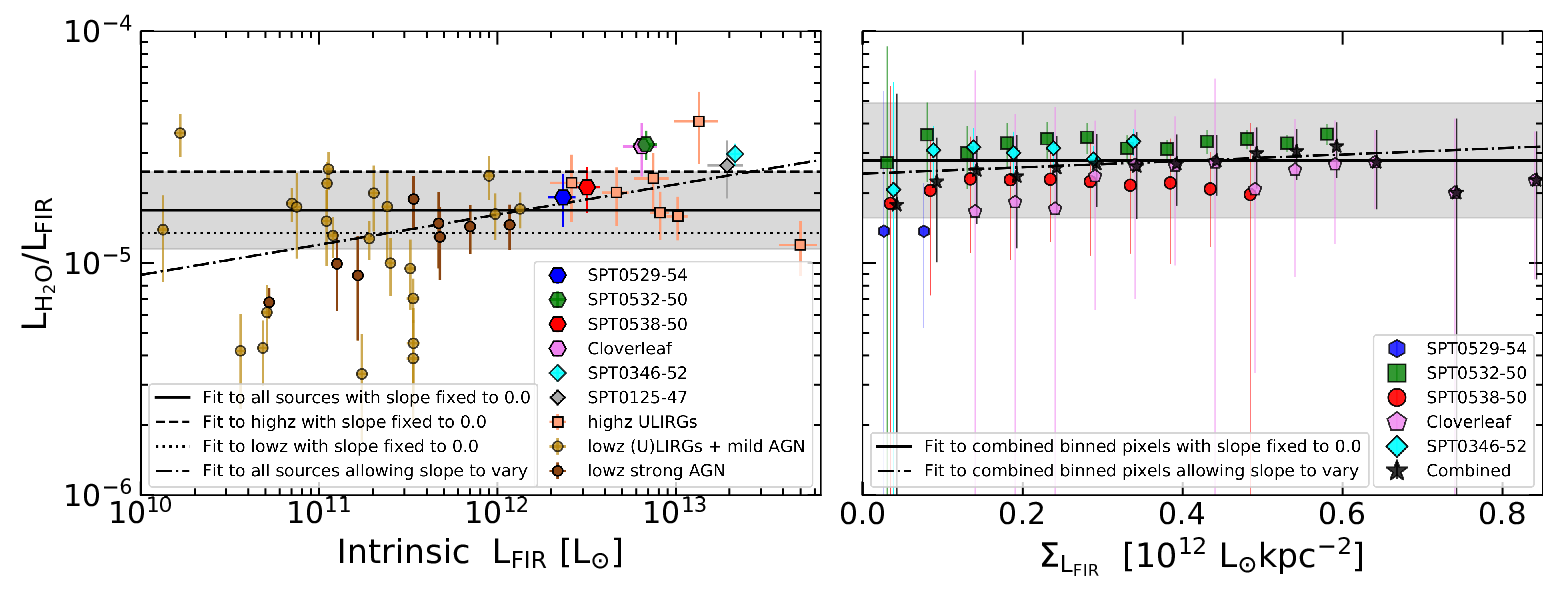
Using the estimated intrinsic luminosities (corrected for magnification) of FIR and H2O, we plot / as a function of in Figure 3 in both globally integrated scales and spatially resolved scales (Yang et al. 2013, values for high-redshift galaxies are given in Table 3 and Table 5 and local galaxies are discussed in). In our analysis, we assume that H2O and FIR are co-spatially lensed and hence, the issue of differential lensing where the lensing magnification varies across the source (Blain 1999; Hezaveh et al. 2012) is not significant.
From Figure 3A, the correlation between global and is slightly super-linear and shown as dot-dashed black line. A fit (including all sources from literature in the MCMC) to log10() and log10() gives:
| (5) |
This result is similar to the conclusion presented in the literature (Omont et al. 2013; Yang et al. 2016) where / is slightly higher in luminous high-redshift galaxies when compared to less luminous local galaxies. The fit to / with the slope fixed to zero is shown as a thick black line (the error region is shown in grey) gives / = 1.69 10-5. The fit (slope fixed to zero) to high-redshift sources is shown as dashed line and to the low-redshift galaxies is shown as dotted line. Both the lines (with their respective errors) are within the error bar of the thick black line which shows that the increase in / in this sample might not be significant. The almost linear relation between and over more than 3 orders-of-magnitude supports the previously found conclusions in the literature that p- traces both in local galaxies and in high-redshift ULIRGs irrespective of the presence of AGN.
It should be noted that the low-redshift sample from Yang et al. 2013 is not complete and the super-linear correlation between and , seen in Figure 3A might be real. The deficiency of H2O in less luminous galaxies ( 1011.5 L⊙) has also been observed in the compilation of fluxes presented by Liu et al. 2017 where a few LIRGs have similar to ULIRGs while the others either have lower or no H2O detection. This effect could be arising because of p- excitation requirements. H2O molecules have to be well shielded from UV radiation to avoid dissociation but also have to reside in warm gas (not UV heated) to escape into gas phase from the grain mantles. Moreover, p- requires dense gas to populate the 11,1 level through collisions, which is the base for 101 m excitations. Hence, H2O couples with far-infrared radiation strongly in such warm, dense, well shielded gas which is prevalent in galaxies with 1011.5 L⊙, but less so in low luminous galaxies. H2O emission is also enhanced as a result of shocks or intense radiation fields prominent in starbursts. Shocks could increase the abundance of H2O and strong radiation could lead to increase in excitations (Gonzalez et al. 2010; Omont et al. 2011, e.g). This might result in the slightly super-linear correlation.
Figure 3B shows the correlation between and on resolved scales. In each spatial pixel, the surface brightness () is estimated by dividing the observed in each pixel by the area of the pixel in the image plane. Because lensing conserves surface brightness, the pixel-by-pixel values of do not require a lensing correction. / per pixel also does not require a lensing correction as we assume that the FIR and H2O emission are co-spatially lensed. The data points corresponding to each source are the average value of / in pixels binned within (0.05 x ) and the error on each data point corresponds to combined error of the standard deviation of pixel values within that bin and the propagated error due to averaging. This averaging reduces the number of degenerate pixels arising from multiple images of the same region in the source due to gravitational lensing. However, pixel averaging contributes to the error on and / because of differential lensing within pixels in each bin. These errors are not shown in Figure 3B as it is difficult to quantify without a good lens model but this does not affect the results discussed below. The black points are obtained by combining all the pixels from all the sources. The best fit to the black points by fixing the slope to zero is given by:
| (6) |
This fit is shown as a thick black line and the grey shaded region in Figure 3B which is consistent with the global / (Figure 3A). The dotted line in Figure 3B is the best fit to the resolved data by allowing the slope to vary. We obtain / 0.14±1.44 which is consistent within the grey shaded region. On comparing the two fits using a F-test, we conclude that the fit with varying slope does not provide significantly more information than the fit with slope fixed to zero. We obtain a F-distribution value of 0.5 with the null hypothesis that the fit with varying slope provides more information than the fit with slope fixed to zero and we reject this hypothesis if the F-distribution value is 0.05.
We observe that / remains linear in SPT0532-50, SPT0538-50 and the Cloverleaf with . The correlation is not obvious in SPT0529-54 as the signal-to-noise of the H2O emission in this source is lower than other sources (peak SNR 7.5 in 100 kms-1 channels). This strong correlation between and suggests that H2O is tracing star formation rate not just at global scales (as discussed in previous paragraph) but also at resolved scales (1 kiloparsec) within the galaxy. Thus, this result demonstrates that we can use resolved H2O as resolved SFR indicator in high-redshift intense star forming regions. However, high resolution continuum observations in the FIR regime are required to quantify temperature (and hence ) variations within the galaxy.
To understand in which regions of the galaxy H2O best traces in the image plane at resolved pixel scales, we plot the relative deviation of / in Figure 4. Here, corresponds to [ratioi - ratiomed] / ratiomed where ratioi is / of ith pixel and ratiomed is the median value of / in each source. The closer the value to 0, the closer it is to the median value which implies that H2O is well correlated with FIR in those pixels. As seen in the images, the correlation is stronger in regions with good signal-to-noise and the ones which deviate the most from are at the edges with low signal-to-noise. Moreover, the bright regions are multiple images of the same region in the source (due to gravitational lensing) and as expected, we see that / is the same in these regions. This suggests that water emission faithfully traces the FIR luminosity on resolved scales.
The almost linear correlation between and at the resolved scales in the galaxies (Figure 3B and Equation 6) allows us to calibrate the star formation rate as a function of for high-redshift intense star forming regions. The caveat, as discussed previously in Section I, is that the SFR calibration from can not be applied to certain environments such as regions around AGN and resolved SFR depends on variations in dust temperature and opacity. However, we assume a uniform temperature and opacity distribution across the sources as we do not have more resolved continuum observations around the peak of the SED. The SFR is generally estimated from scaling relations discussed in Kennicutt & Evans 2012:
| (7) |
To convert to , we use / 1.38 obtained from the SEDs of SPT0529-54, SPT0532-50, SPT0538-50 and the Cloverleaf. This value is similar to / in the low-redshift galaxies which is 1.29 (Soifer et al. 1987). Using the to conversion from the SPT sources and the relation between and given by Equation 6, we calibrate SFR using at resolved galaxy scales as:
| (8) |
We have shown that is well correlated with the FIR continuum at resolved scales. As mentioned previously, this calibration is applicable to high-redshift intense star forming regions assuming no spatial variations in temperature and optical depth. A similar analysis using resolved continuum observations at the peak of the SED has to be performed to obtain a more accurate SFR calibration from , which could then be used instead of the observationally expensive . We note that resolved FIR continuum observations at the peak of the SED (even at these redshifts) are observationally expensive, while H2O is a bright line and easily observable in high-redshift sources with ALMA. In addition to providing an alternative to the expensive FIR continuum observations, H2O additionally provides kinematics of the star forming regions.


 |
IV.2 Effect of AGN
Aside from the SPT sources, which are dominated by star formation and show no evidence of an AGN, our sample also includes the Cloverleaf quasar, a well characterized AGN at = 2.56.
The higher transitions of H2O (E 400 K) are mainly excited by absorption of short wavelength far-infrared photons ( 50 m) emitted by the hot dust surrounding the AGN. Modeling of a lensed quasar, APM 08279+5255 at z 3.9 (van der Werf et al. 2011), showed that the higher H2O transitions are arising from the compact central region with Td 200 K. The AGN contributes less to the J 3 excitations (mainly excited by 75 m and 101 m photons) in the warm regions but does contribute significantly to the total . This results in APM 08279+5255 lying low on the / correlation (Figure 3A, Table 5). Similar results are found in Mrk 231 where p- is detected (van der Werf et al. 2010) and in p- and p- is lower than other ULIRGs without AGN (Yang et al. 2016).
Previous work (Yang et al. 2013) has shown that although the presence of strong AGN lowers the global / ratio, there does not appear to be a significant effect of AGN on H2O emission lines. This can be seen from Figure 3A. Our spatially-resolved analysis of the Cloverleaf quasar in Figure 3B indicates that / remains constant at resolved scales and is similar to ULIRGs even in the presence of an AGN. This suggests that the presence of an AGN has little impact on p- excitation – not just at the global scale but also down to kiloparsec scales.
IV.3 Correlation of / with physical properties
The strength of H2O emission depends on a number of physical properties such as Td, H2O column density and continuum opacity () which are better constrained through modeling of multiple H2O excitations. As we observed only a single transition, we now investigate to what extent the global variations in / we observe correlate with other properties we constrain such as (the wavelength in rest frame at which the dust SED peaks) and gas mass density (). We estimate these by using the available photometry and values from the literature (Table 4).
The correlation of / with can be interpreted as a correlation with the dust temperature or surface density. Since, p- is mainly excited by the FIR radiation, we are interested in understanding the correlation with dust temperature. We use as it is a more direct observable than dust temperature, which is degenerate with optical thickness (Papadopoulos et al. 2010, e.g.). In Figure 5A, there is no correlation between / and , consistent with previous results on low-redshift galaxies (Yang et al. 2013, Table 2 in) where no relationship is observed between / and S60μm/S100μm, a dust temperature indicator (these wavelengths are used to fit the SED in our analysis for local sources).
In Figure 5B, we plot / as a function of in an effort to understand whether collisions significantly affect the H2O excitation. is calculated by dividing gas mass by the effective area of the source. The gas mass values from Bothwell et al. 2017 (estimated using [CI] observations) in SPT0529-54 and SPT0532-50 and from Aravena et al. 2016 for SPT0538-50, SPT0125-47 and SPT0346-52 (estimated using CO observations) are used. The source properties are detailed in Spilker et al. 2016, where lens modeling of 870 m dust continuum is performed by assuming a single or multiple Sersic source profiles. Using these values, the area () under a Sersic profile is calculated. This method might overestimate but since the sizes are within a factor of 2, the overestimated value might only be by a factor of few. Moreover, the CO (gas) sizes can be larger than that of the infrared emission (Spilker et al. 2015; Tadaki et al. 2017; Calistro Rivera et al. 2018; Dong et al. 2019). For a simple calculation, we assume that the dust and gas sizes are similar. All the values are given in Table 4. As seen in Figure 5B, there is no observed correlation of / with .
The dust opacity at 100 m, the wavelength at which p- is excited, could also affect the intensity of the line and could explain the spread in the correlation. The slightly super-linear / correlation where the increase in H2O line emission is faster than (Omont et al. 2013; Yang et al. 2016, e.g.) could be because of the increase in (dust opacity at 100 m) with the increase in (González-Alfonso et al. 2014) in turn enhancing because of photon trapping. In a high medium, the 100 m photons are trapped and scattered thereby increasing the local radiation field. This amplifies the p- pumping and hence the p- line photons. We do a simple estimation of in the three SPT sources using the equation from Yang et al. 2016 where is given by:
| (9) |
is the dust absorption opacity at 100 m and r is the radius of the source at submm wavelength. We use = 2.92 (Li & Draine 2001) at rest wavelength and dust mass () given by:
| (10) |
Here, is the flux density at observed frequency, is the redshift of the source, is the luminosity distance, is the Planck function at rest frequency (described in Section III.1) and is the magnification of the source. From the lens model parameters derived in Spilker et al. 2016, we estimate 0.34, 1.36 and 0.46 for SPT0529-54, SPT0532-50 and SPT0538-54 respectively. The higher value of in SPT0532-50 could be enhancing the H2O luminosity above the average value. However, several physical factors like Td, opacity, H2O abundance, et cetera, can also influence the intensity of the line.
To summarize, the global variations in / are not observed to be affected by the physical properties of the galaxy such as and . Large dust opacity at 100 m might enhance due to photon trapping. Modeling with multiple transitions will give a better understanding of the factors influencing the correlation between and .
| Source | Reference | ||||
| [m] | [] | [] | [] | ||
| SPT0529-54 | 108.57 5.59 | 4.05 0.90 | 9.17 3.46 | 0.44 0.19 | Bothwell et al. 2017 |
| SPT0532-50 | 92.43 6.83 | 6.05 1.71 | 7.46 1.69 | 0.81 0.29 | Bothwell et al. 2017 |
| SPT0538-50 | 94.91 6.83 | 1.7 0.3 | 15.71 3.05 | 0.11 0.03 | Aravena et al. 2016 |
| SPT0125-47 | 84.98 11.17 | 11.5 1.0 | 11.93 9.93 | 0.96 0.81 | Aravena et al. 2016 |
| SPT0346-52 | 73.80 5.59 | 8.2 0.6 | 2.81 0.45 | 2.92 0.52 | Aravena et al. 2016 |
| Cloverleaf | 71.32 6.83 | - | - | - | - |
| NOTE. - , the rest frame wavelength at which dust SED peaks, is estimated from the modified blackbody fit to photometry using MCMC algorithm. Gas mass () is taken from the references shown in the last column. The Sersic area () is calculated from the best fit source parameters from lens modeling (Spilker et al. 2016). is the gas surface density. | |||||
 |
IV.4 and CO
CO traces relatively dense gas (with critical density of H) in molecular clouds, although not as dense as HCN or HCO+ (Shirley 2015; Béthermin et al. 2018). The highJ CO lines are therefore found to be correlated with the far infrared field in these star forming regions (Liu et al. 2015, Figure 1 in). Here, we investigate this correlation in the context of the relation. We make use of the spatially and spectrally resolved observations of midJ CO in SPT0529-54, SPT0532-50 (Dong et al. 2019) and supplement these data with observations of the two other SPT sources SPT0346-52 (Apostolovski et al. 2019) and SPT1247-50 (which is not detected in p-) from Dong et al. 2019. The imaging of the CO data is similar to that described in Section II.2. The mask used to select the pixels recovers of the CO emission, depending on the source.
Figure 6 shows / as a function of similar to Figure 3. Figure 6A contains the global integrated values in local luminous infrared galaxies from Lu et al. 2017 and high-redshift SPT sources. Figure 6B shows the resolved correlation between CO and (the binning procedure is similar to that described in Section IV.1) where the resolved is estimated using the continuum around the CO line. CO is observed to have an almost linear correlation with both at global and resolved scales, similar to H2O.
The spectra of CO and p- in SPT0532-50 and SPT0346-52 (with a good detection of both the lines) shows that CO has a FWHM consistent with H2O within the errors (Figure 8A). This may indicate that both the lines are emitted from similar regions in the galaxy (Omont et al. 2013; Yang et al. 2016; Liu et al. 2017, See also). It can further be seen from the spatial distribution comparison in the image plane (Figure 8B). This agrees with the results in Yang et al. 2019, where they find similar spatial distribution and also similar kinematic structure between CO and p- in G09v1.97.
While p- excitation is due to FIR pumping mechanism and depends mainly on the radiation field density, the CO excitation is due to collisions with the H2 molecules. Hence, CO intensity increases with increase in the gas density and temperature (Narayanan & Krumholz 2014, e.g.). The mid and highJ CO lines (J = and above) are shown to have increasingly sub-linear slopes with which suggests that denser and much warmer gas than star forming regions (possibly due to shocks or turbulence) is needed for CO excitation (Narayanan et al. 2008; Greve et al. 2014). Thus, variations in star formation efficiency, or other physical properties within the molecular gas such as the shape of the density probability distribution function (PDF) and the median density of the gas within and between galaxies might affect / more strongly than /. Although the mid-J / ratio is not expected to be enhanced in galaxies with supernovae or stellar wind driven shocks, NGC 6240 shows a higher ratio (Lu et al. 2017). This suggests that H2O is an intrinsically better tracer of the far infrared field than CO. To confirm this result, we need a larger sample of sources across a broad range in to compare H2O and CO (and other dense gas traces such as HCN) to determine which one is an empirically better tracer of star formation.
 |
V Summary and Conclusion
We observed p- 987.927 GHz line in SPT0529-54 ( = 3.369), SPT0532-50 ( = 3.399) and SPT0538-50 ( = 2.782) with ALMA. We also include the Cloverleaf quasar at = 2.558 to compare with the star forming galaxies. The observational results and conclusions from this analysis are:
- •
is empirically correlated with over more than three orders-of-magnitude from low-redshift LIRGs to high-redshift ULIRGs
- •
The relationship between and stays linear even at resolved scales within individual galaxies with average / = 2.76 10-5
- •
This linear correlation holds even in the presence of a strong AGN in the Cloverleaf quasar
- •
We present p- as a resolved SFR calibrator for high-redshift intense star forming regions assuming a single temperature and opacity across the source
- •
There is no observed correlation of / with , the wavelength at which SED peaks or , the gas mass surface density. The dust opacity at 100 m (), on the other hand, may influence due to photon trapping. However, the current sample is too small to give any definite result
- •
p- is intrinsically a better tracer of than CO. A larger sample size is needed to confirm this result
This work shows that p- traces at resolved kiloparsec scales in high-redshift galaxies with intense star forming regions while assuming a single temperature and dust opacity across the source. In order to validate these assumptions and obtain a more accurate SFR calibration, we need resolved continuum observations around the peak of the SED. We also need to perform similar analysis on less luminous galaxies ( 1012 L) to extend the SFR calibration. Future work will involve detailed lens modeling of the sources with a pixellated lens model (Hezaveh et al. 2016). In the future, it would also be interesting to compare and model multiple resolved H2O lines with other dense gas tracers.
VI Acknowledgments
This paper makes use of the following ALMA data: ADS/JAO.ALMA #2015.1.01578.S, #2016.1.01554.S, #2012.1.00844.S, #2012.1.00175.S and #2011.0.00957.S. The SPT is supported by the NSF through grant PLR-1248097, with partial support through PHY-1125897, the Kavli Foundation and the Gordon and Betty Moore Foundation grant GBMF 947. S.J., J.D.V., D.P.M. and K.C.L. acknowledge support from the US NSF under grants AST-1715213 and AST-1716127. S.J. and K.C.L acknowledge support from the US NSF NRAO under grants SOSPA5-001 and SOSPA4-007, respectively. J.D.V. acknowledges support from an A. P. Sloan Foundation Fellowship. D.N. was supported in part by NSF Award AST-1715206 and HST Theory Award 15043.0001. ALMA is a partnership of ESO (representing its member states), NSF (USA) and NINS (Japan), together with NRC (Canada), MOST and ASIAA (Taiwan), and KASI (Republic of Korea), in cooperation with the Republic of Chile. The Joint ALMA Observatory is operated by ESO, AUI/NRAO and NAOJ. This research has made use of NASAfls Astrophysics Data System.
References
- Apostolovski et al. (2019) Apostolovski, Y., Aravena, M., Anguita, T., et al. 2019, arXiv e-prints, arXiv:1905.12738. https://arxiv.org/abs/1905.12738
- Aravena et al. (2013) Aravena, M., Murphy, E. J., Aguirre, J. E., et al. 2013, MNRAS, 433, 498, doi: 10.1093/mnras/stt741
- Aravena et al. (2016) Aravena, M., Spilker, J. S., Bethermin, M., et al. 2016, MNRAS, 457, 4406, doi: 10.1093/mnras/stw275
- Beelen et al. (2006) Beelen, A., Cox, P., Benford, D. J., et al. 2006, ApJ, 642, 694, doi: 10.1086/500636
- Béthermin et al. (2018) Béthermin, M., Greve, T. R., De Breuck, C., et al. 2018, A&A, 620, A115, doi: 10.1051/0004-6361/201833081
- Blain (1999) Blain, A. W. 1999, MNRAS, 304, 669, doi: 10.1046/j.1365-8711.1999.02426.x
- Blain & Longair (1993) Blain, A. W., & Longair, M. S. 1993, MNRAS, 264, 509
- Bothwell et al. (2013a) Bothwell, M. S., Aguirre, J. E., Chapman, S. C., et al. 2013a, ApJ, 779, 67, doi: 10.1088/0004-637X/779/1/67
- Bothwell et al. (2013b) Bothwell, M. S., Smail, I., Chapman, S. C., et al. 2013b, MNRAS, 429, 3047, doi: 10.1093/mnras/sts562
- Bothwell et al. (2017) Bothwell, M. S., Aguirre, J. E., Aravena, M., et al. 2017, MNRAS, 466, 2825, doi: 10.1093/mnras/stw3270
- Bradford et al. (2009) Bradford, C. M., Aguirre, J. E., Aikin, R., et al. 2009, ApJ, 705, 112, doi: 10.1088/0004-637X/705/1/112
- Bussmann et al. (2013) Bussmann, R. S., Pérez-Fournon, I., Amber, S., et al. 2013, ApJ, 779, 25, doi: 10.1088/0004-637X/779/1/25
- Calistro Rivera et al. (2018) Calistro Rivera, G., Hodge, J. A., Smail, I., et al. 2018, ApJ, 863, 56, doi: 10.3847/1538-4357/aacffa
- Carlstrom et al. (2011) Carlstrom, J. E., Ade, P. A. R., Aird, K. A., et al. 2011, PASP, 123, 568, doi: 10.1086/659879
- Casey et al. (2014) Casey, C. M., Narayanan, D., & Cooray, A. 2014, Phys. Rep., 541, 45, doi: 10.1016/j.physrep.2014.02.009
- Casey et al. (2017) Casey, C. M., Cooray, A., Killi, M., et al. 2017, ApJ, 840, 101, doi: 10.3847/1538-4357/aa6cb1
- Combes et al. (2012) Combes, F., Rex, M., Rawle, T. D., et al. 2012, A&A, 538, L4, doi: 10.1051/0004-6361/201118750
- Cooray et al. (2014) Cooray, A., Calanog, J., Wardlow, J. L., et al. 2014, ApJ, 790, 40, doi: 10.1088/0004-637X/790/1/40
- Díaz-Santos et al. (2014) Díaz-Santos, T., Armus, L., Charmandaris, V., et al. 2014, ApJ, 788, L17, doi: 10.1088/2041-8205/788/1/L17
- Dong et al. (2019) Dong, C., Spilker, J. S., Gonzalez, A. H., et al. 2019, arXiv e-prints. https://arxiv.org/abs/1901.10482
- Draine (2006) Draine, B. T. 2006, ApJ, 636, 1114, doi: 10.1086/498130
- Foreman-Mackey et al. (2013) Foreman-Mackey, D., Hogg, D. W., Lang, D., & Goodman, J. 2013, PASP, 125, 306, doi: 10.1086/670067
- Gao & Solomon (2004) Gao, Y., & Solomon, P. M. 2004, ApJ, 606, 271, doi: 10.1086/382999
- Gonzalez et al. (2010) Gonzalez, A. H., Papovich, C., Bradač, M., & Jones, C. 2010, ApJ, 720, 245, doi: 10.1088/0004-637X/720/1/245
- González-Alfonso et al. (2014) González-Alfonso, E., Fischer, J., Aalto, S., & Falstad, N. 2014, A&A, 567, A91, doi: 10.1051/0004-6361/201423980
- González-Alfonso et al. (2010) González-Alfonso, E., Fischer, J., Isaak, K., et al. 2010, A&A, 518, L43, doi: 10.1051/0004-6361/201014664
- González-Alfonso et al. (2012) González-Alfonso, E., Fischer, J., Graciá-Carpio, J., et al. 2012, A&A, 541, A4, doi: 10.1051/0004-6361/201118029
- Greve et al. (2012) Greve, T. R., Vieira, J. D., Weiß, A., et al. 2012, ApJ, 756, 101, doi: 10.1088/0004-637X/756/1/101
- Greve et al. (2014) Greve, T. R., Leonidaki, I., Xilouris, E. M., et al. 2014, ApJ, 794, 142, doi: 10.1088/0004-637X/794/2/142
- Gullberg et al. (2015) Gullberg, B., De Breuck, C., Vieira, J. D., et al. 2015, MNRAS, 449, 2883, doi: 10.1093/mnras/stv372
- Hayward et al. (2012) Hayward, C. C., Jonsson, P., Kereš, D., et al. 2012, MNRAS, 424, 951, doi: 10.1111/j.1365-2966.2012.21254.x
- Hayward et al. (2014) Hayward, C. C., Lanz, L., Ashby, M. L. N., et al. 2014, MNRAS, 445, 1598, doi: 10.1093/mnras/stu1843
- Helou et al. (1985) Helou, G., Soifer, B. T., & Rowan-Robinson, M. 1985, ApJ, 298, L7, doi: 10.1086/184556
- Hezaveh et al. (2012) Hezaveh, Y. D., Marrone, D. P., & Holder, G. P. 2012, ApJ, 761, 20, doi: 10.1088/0004-637X/761/1/20
- Hezaveh et al. (2016) Hezaveh, Y. D., Dalal, N., Marrone, D. P., et al. 2016, ApJ, 823, 37, doi: 10.3847/0004-637X/823/1/37
- Kennicutt & Evans (2012) Kennicutt, R. C., & Evans, N. J. 2012, ARA&A, 50, 531, doi: 10.1146/annurev-astro-081811-125610
- Kennicutt (1998) Kennicutt, Jr., R. C. 1998, ARA&A, 36, 189, doi: 10.1146/annurev.astro.36.1.189
- Kennicutt et al. (2009) Kennicutt, Jr., R. C., Hao, C.-N., Calzetti, D., et al. 2009, ApJ, 703, 1672, doi: 10.1088/0004-637X/703/2/1672
- Koss et al. (2013) Koss, M., Mushotzky, R., Baumgartner, W., et al. 2013, ApJ, 765, L26, doi: 10.1088/2041-8205/765/2/L26
- Lagache et al. (2018) Lagache, G., Cousin, M., & Chatzikos, M. 2018, A&A, 609, A130, doi: 10.1051/0004-6361/201732019
- Li & Draine (2001) Li, A., & Draine, B. T. 2001, ApJ, 554, 778, doi: 10.1086/323147
- Liu et al. (2015) Liu, D., Gao, Y., Isaak, K., et al. 2015, ApJ, 810, L14, doi: 10.1088/2041-8205/810/2/L14
- Liu et al. (2017) Liu, L., Weiß, A., Perez-Beaupuits, J. P., et al. 2017, ApJ, 846, 5, doi: 10.3847/1538-4357/aa81b4
- Lu et al. (2015) Lu, N., Zhao, Y., Xu, C. K., et al. 2015, ApJ, 802, L11, doi: 10.1088/2041-8205/802/1/L11
- Lu et al. (2017) Lu, N., Zhao, Y., Díaz-Santos, T., et al. 2017, ApJS, 230, 1, doi: 10.3847/1538-4365/aa6476
- McMullin et al. (2007) McMullin, J. P., Waters, B., Schiebel, D., Young, W., & Golap, K. 2007, in Astronomical Society of the Pacific Conference Series, Vol. 376, Astronomical Data Analysis Software and Systems XVI, ed. R. A. Shaw, F. Hill, & D. J. Bell, 127
- Mocanu et al. (2013) Mocanu, L. M., Crawford, T. M., Vieira, J. D., et al. 2013, ApJ, 779, 61, doi: 10.1088/0004-637X/779/1/61
- Murphy et al. (2011) Murphy, E. J., Condon, J. J., Schinnerer, E., et al. 2011, ApJ, 737, 67, doi: 10.1088/0004-637X/737/2/67
- Narayanan et al. (2008) Narayanan, D., Cox, T. J., Shirley, Y., et al. 2008, ApJ, 684, 996, doi: 10.1086/588720
- Narayanan & Krumholz (2014) Narayanan, D., & Krumholz, M. R. 2014, MNRAS, 442, 1411, doi: 10.1093/mnras/stu834
- Narayanan & Krumholz (2017) —. 2017, MNRAS, 467, 50, doi: 10.1093/mnras/stw3218
- Narayanan et al. (2015) Narayanan, D., Turk, M., Feldmann, R., et al. 2015, Nature, 525, 496, doi: 10.1038/nature15383
- Neufeld et al. (1995) Neufeld, D. A., Lepp, S., & Melnick, G. J. 1995, ApJS, 100, 132, doi: 10.1086/192211
- Omont (2007) Omont, A. 2007, Reports on Progress in Physics, 70, 1099, doi: 10.1088/0034-4885/70/7/R03
- Omont et al. (2011) Omont, A., Neri, R., Cox, P., et al. 2011, A&A, 530, L3+, doi: 10.1051/0004-6361/201116921
- Omont et al. (2013) Omont, A., Yang, C., Cox, P., et al. 2013, ArXiv e-prints. https://arxiv.org/abs/1301.6618
- Papadopoulos et al. (2010) Papadopoulos, P. P., van der Werf, P., Isaak, K., & Xilouris, E. M. 2010, ApJ, 715, 775, doi: 10.1088/0004-637X/715/2/775
- Planck Collaboration et al. (2016) Planck Collaboration, Ade, P. A. R., Aghanim, N., et al. 2016, A&A, 594, A13, doi: 10.1051/0004-6361/201525830
- Rangwala et al. (2011) Rangwala, N., Maloney, P. R., Glenn, J., et al. 2011, ApJ, 743, 94, doi: 10.1088/0004-637X/743/1/94
- Riechers et al. (2009) Riechers, D. A., Walter, F., Carilli, C. L., & Lewis, G. F. 2009, ApJ, 690, 463, doi: 10.1088/0004-637X/690/1/463
- Riechers et al. (2013) Riechers, D. A., Bradford, C. M., Clements, D. L., et al. 2013, Nature, 496, 329, doi: 10.1038/nature12050
- Sanders et al. (2003) Sanders, D. B., Mazzarella, J. M., Kim, D.-C., Surace, J. A., & Soifer, B. T. 2003, AJ, 126, 1607, doi: 10.1086/376841
- Shirley (2015) Shirley, Y. L. 2015, PASP, 127, 299, doi: 10.1086/680342
- Soifer et al. (1987) Soifer, B. T., Neugebauer, G., & Houck, J. R. 1987, ARA&A, 25, 187, doi: 10.1146/annurev.aa.25.090187.001155
- Solomon et al. (2003) Solomon, P., Vanden Bout, P., Carilli, C., & Guelin, M. 2003, Nature, 426, 636, doi: 10.1038/nature02149
- Solomon et al. (1997) Solomon, P. M., Downes, D., Radford, S. J. E., & Barrett, J. W. 1997, ApJ, 478, 144, doi: 10.1086/303765
- Solomon & Vanden Bout (2005) Solomon, P. M., & Vanden Bout, P. A. 2005, ARA&A, 43, 677, doi: 10.1146/annurev.astro.43.051804.102221
- Spilker et al. (2014) Spilker, J. S., Marrone, D. P., Aguirre, J. E., et al. 2014, ApJ, 785, 149, doi: 10.1088/0004-637X/785/2/149
- Spilker et al. (2015) Spilker, J. S., Aravena, M., Marrone, D. P., et al. 2015, ApJ, 811, 124, doi: 10.1088/0004-637X/811/2/124
- Spilker et al. (2016) Spilker, J. S., Marrone, D. P., Aravena, M., et al. 2016, ApJ, 826, 112, doi: 10.3847/0004-637X/826/2/112
- Strandet et al. (2016) Strandet, M. L., Weiss, A., Vieira, J. D., et al. 2016, ApJ, 822, 80, doi: 10.3847/0004-637X/822/2/80
- Tadaki et al. (2017) Tadaki, K.-i., Kodama, T., Nelson, E. J., et al. 2017, ApJ, 841, L25, doi: 10.3847/2041-8213/aa7338
- Tielens (2013) Tielens, A. G. G. M. 2013, Reviews of Modern Physics, 85, 1021, doi: 10.1103/RevModPhys.85.1021
- van der Werf et al. (2010) van der Werf, P. P., Isaak, K. G., Meijerink, R., et al. 2010, A&A, 518, L42, doi: 10.1051/0004-6361/201014682
- van der Werf et al. (2011) van der Werf, P. P., Berciano Alba, A., Spaans, M., et al. 2011, ApJ, 741, L38, doi: 10.1088/2041-8205/741/2/L38
- Vassilev et al. (2008) Vassilev, V., Meledin, D., Lapkin, I., et al. 2008, A&A, 490, 1157, doi: 10.1051/0004-6361:200810459
- Venturini & Solomon (2003) Venturini, S., & Solomon, P. M. 2003, ApJ, 590, 740, doi: 10.1086/375050
- Vieira et al. (2010) Vieira, J. D., Crawford, T. M., Switzer, E. R., et al. 2010, ApJ, 719, 763, doi: 10.1088/0004-637X/719/1/763
- Vieira et al. (2013) Vieira, J. D., Marrone, D. P., Chapman, S. C., et al. 2013, Nature, 495, 344, doi: 10.1038/nature12001
- Weiß et al. (2007) Weiß, A., Downes, D., Neri, R., et al. 2007, A&A, 467, 955, doi: 10.1051/0004-6361:20066117
- Weiß et al. (2003) Weiß, A., Henkel, C., Downes, D., & Walter, F. 2003, A&A, 409, L41, doi: 10.1051/0004-6361:20031337
- Weiß et al. (2010) Weiß, A., Requena-Torres, M. A., Güsten, R., et al. 2010, A&A, 521, L1, doi: 10.1051/0004-6361/201015078
- Weiß et al. (2013) Weiß, A., De Breuck, C., Marrone, D. P., et al. 2013, ApJ, 767, 88, doi: 10.1088/0004-637X/767/1/88
- Yang et al. (2013) Yang, C., Gao, Y., Omont, A., et al. 2013, ApJ, 771, L24, doi: 10.1088/2041-8205/771/2/L24
- Yang et al. (2016) Yang, C., Omont, A., Beelen, A., et al. 2016, A&A, 595, A80, doi: 10.1051/0004-6361/201628160
- Yang et al. (2017) —. 2017, A&A, 608, A144, doi: 10.1051/0004-6361/201731391
- Yang et al. (2019) Yang, C., Gavazzi, R., Beelen, A., et al. 2019, arXiv e-prints. https://arxiv.org/abs/1903.00273
- Zhang et al. (2014) Zhang, Z.-Y., Gao, Y., Henkel, C., et al. 2014, ApJ, 784, L31, doi: 10.1088/2041-8205/784/2/L31
VII Appendix: A1
| Source | z | / | / | / | Reference | ||
| [m] | [1012 L⊙] | [108 L⊙] | [10-5] | ||||
| SPT0125-47 | 2.5148 | 5.467 0.120 | 84.98 11.17 | 19.40 4.37 | 5.12 0.87 | 2.64 0.74 | Appendix A2 [VIII] |
| SPT0346-52 | 5.6559 | 5.570 0.117 | 73.80 5.59 | 21.50 2.31 | 6.36 0.24 | 2.96 0.32 | Apostolovski et al. 2019 |
| G12.v2.30 | 3.259 | 9.5 0.6 | 82.49 4.34 | 8.16 1.02 | 1.35 0.27 | 1.65 0.39 | Omont et al. 2013 |
| NAv1.195 | 2.951 | 4.1 0.3 | 93.67 4.34 | 10.25 1.38 | 1.63 0.27 | 1.59 0.34 | Yang et al. 2016 |
| SDP11 | 1.786 | 10.9 1.3 | 91.18 5.59 | 2.60 0.63 | 0.58 0.12 | 2.22 0.71 | Yang et al. 2016 |
| NBv1.78 | 3.111 | 13.0 1.5 | 80.01 4.97 | 4.65 0.79 | 0.94 0.21 | 2.02 0.57 | Omont et al. 2013 |
| SDP17 | 2.305 | 4.9 0.7 | 92.43 5.59 | 7.47 1.65 | 1.73 0.32 | 2.32 0.67 | Omont et al. 2013 |
| HFLS3 | 6.337 | 2.2 0.3 | 76.28 7.45 | 13.47 3.74 | 5.51 1.12 | 4.09 1.41 | Riechers et al. 2013 |
| APM08279 | 3.9 | 4.0 | 50.0 12.0 | 6.0 1.2 | 1.2 0.3 | van der Werf et al. 2011 | |
| +5255 | |||||||
| NOTE. - For the SPT sources, z and magnification () are given in Spilker et al. 2016 and (the wavelength in rest frame at which the dust SED peaks) and are estimated by fitting a modified blackbody function to the photometry by fixing = 2.0. H2O observations of SPT0346-52 is discussed in detail in Apostolovski et al. 2019. In HFLS3, photometry is from Riechers et al. 2013 and magnification is from Cooray et al. 2014. The magnification in APM08279+5255 is taken from Riechers et al. 2009. For all other sources, and photometry is from Bussmann et al. 2013. and are estimated by fixing = 2.0 and = 100 m except in APM08279+5255 where is taken from (Beelen et al. 2006; Weiß et al. 2007). is taken from the references given in the last column. | |||||||
VIII Appendix: A2
APEX observations of H2O in SPT0125-47
We observed p- (=987.927 GHz) line in SPT0125-47 at =2.5148 using the APEX-2 receiver of the Swedish Heterodyne Facility Instrument (Vassilev et al. 2008, SHFI;) on the Atacama Pathfinder Experiment (APEX). The observations in the shared ESO+Swedish project 092.A-0467 (PI M. Aravena) were done between July and November 2013 in excellent conditions with Precipitatable Water Vapor 0.25PWV0.5 mm, and a total on-source integration time of 3 hours. We reduced the data using the standard procedures in the IRAM CLASS software. The line is clearly detected (Figure 7) with a line flux of 21.83.7 Jykm s-1 and a line width of 117 km s-1. Note that the source is unresolved in the 280 GHz APEX beam of 223.
 |
IX Appendix: A3
Spatial distribution of CO and H2O in SPT0532-50 and SPT0346-52
From the spatial distribution comparison of CO and p-, we can see that both the lines are tracing similar regions in the velocity space. Although, the source is gravitationally lensed, the similar distribution in the image plane might indicate that they are tracing the same regions of the galaxy in the source plane.

 |

 |