The metallicity sensitivity of a surface brightness temperature scale
Abstract
To obtain the accuracy now sought in the extragalactic distance scale through standard candles and rulers, calibration of stellar photometry must be improved. The sensitivity of the V–K color surface brightness relation is examined here by means of model atmosphere fluxes. It has previously been neglected, but is shown here to be a significant term in the error budget of a recent high precision distance of the Large Magellanic Cloud, an anchor in galaxy distances based on Cepheids.
Keywords:
Stars: binaries: eclipsing – stars: abundances – galaxies: distance and redshiftsI Introduction
The goal of 1% accuracy in the extragalactic distance scale places new demands on stellar astrophysics. ESA’s mission has opened up new possibilities in the classes of stars that can be standard candles (e.g. Mould, Clementini, Da Costa 2019). Pietrzynski et al (2019) employ the surface brightness colour relation to attain the required accuracy in the distance of the Large Magellanic Cloud (LMC). Both works require accurate calibration of photometry to temperatures and luminosities.
In this paper we explore the metallicity dependence of the surface brightness color relation using the surface fluxes of Kurucz model atmospheres.
II Surface brightness and effective temperature
Eclipsing binaries allow accurate measurements of stellar radii (e.g. Elgueta et al 2018). Physically, we can understand this as combining the definition of effective temperature Te
where L and R are the stellar luminosity and radius respectively, with a geometric measurement of R. Dividing by stellar surface area, we obtain a flux
where is the stellar angular radius and is the Stefan-Boltzmann constant. If the flux is measured photometrically, the effective temperature can be estimated from V–K (e.g. di Benedetto et al 1998, 2005). One combines and R to obtain the distance.
In these terms we can express the error propagation: If V–K = (Te, g, Z), then
It is possible to ignore the second term for the time being, supposing the ratio of stellar mass to R2 to be perfectly determined by a spectroscopic eclipsing binary solution and investigate the third term using the predictions of Kurucz model atmospheres.
III Synthetic Color Temperature relation
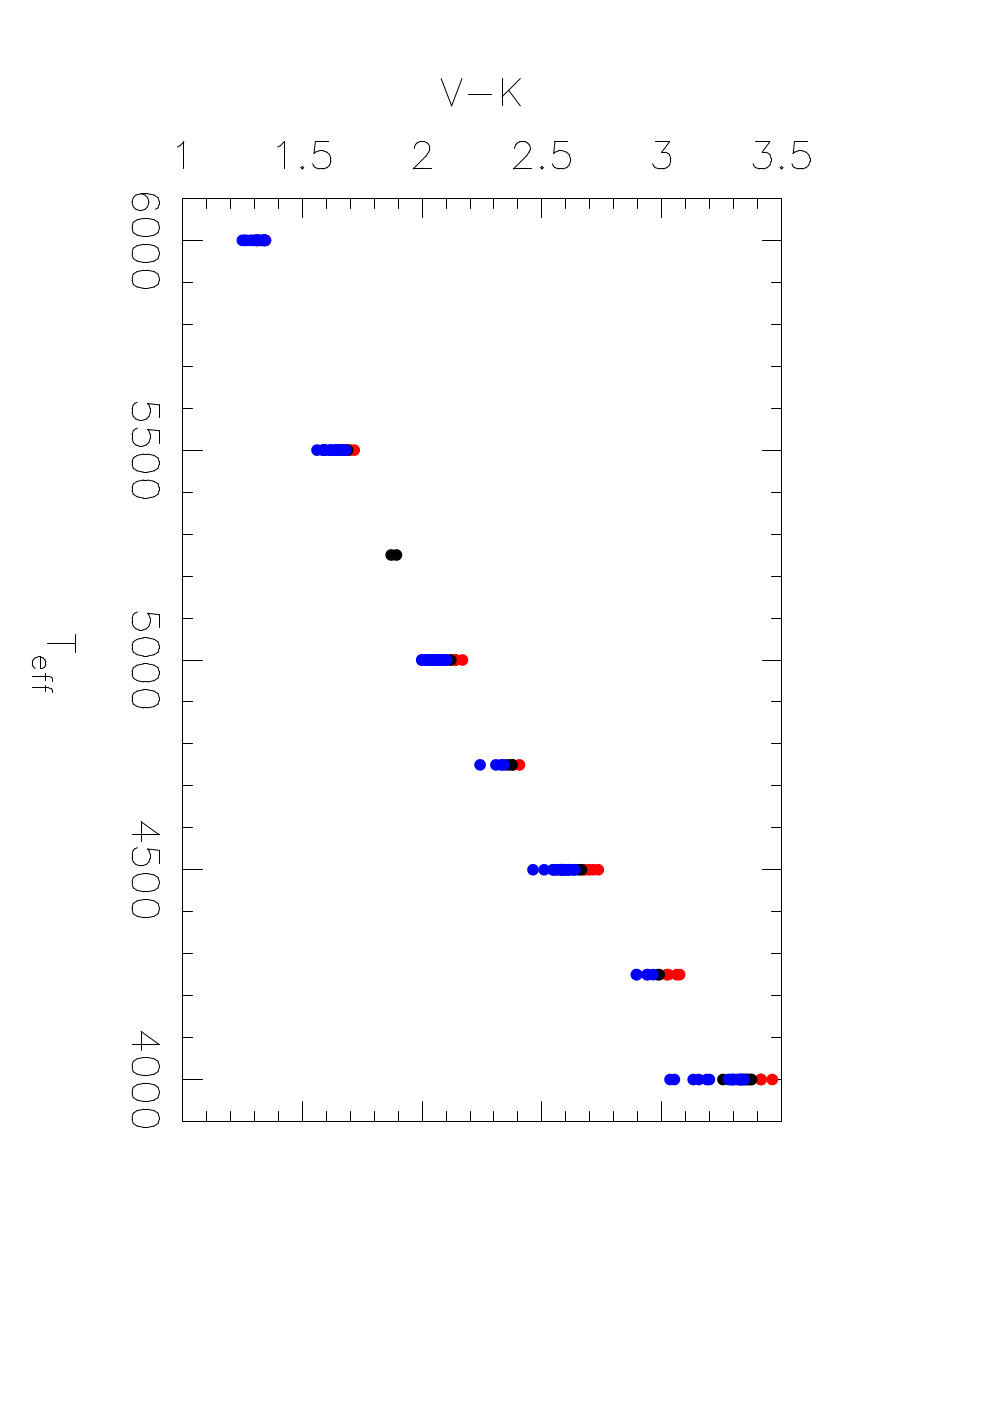
The relation between V–K and Te can be modeled using Buser & Kurucz (1992) fluxes and Bessell (2005), together with Bessell & Brett (1988), filter responses. The fluxes of these models are not well sampled in the near infrared and were therefore interpolated in the K bandpass. Results are independent of whether linear or parabolic interpolation was used. The dependence of color on metallicity at fixed gravity is illustrated in Figure 1. Similar results are obtained using model atmosphere fluxes with nearly two orders of magnitude more spectral resolution (Allard 2016). These models include TiO in the V bandpass and CO in the K bandpass, and so are superior in their predictions for K giants and M stars.
Spherical models are also available to complement the standard plane parallel atmosphere models (e.g. SATLAS, Lester & Neilson 2008). At one solar mass MARCS models11 1 marcs.astro.uu.se by Gustafsson et al (2008) are redder in V–K at 5000K and log g = 3 in the spherical case than the plane parallel case, but is almost identical.
IV Red clump stars
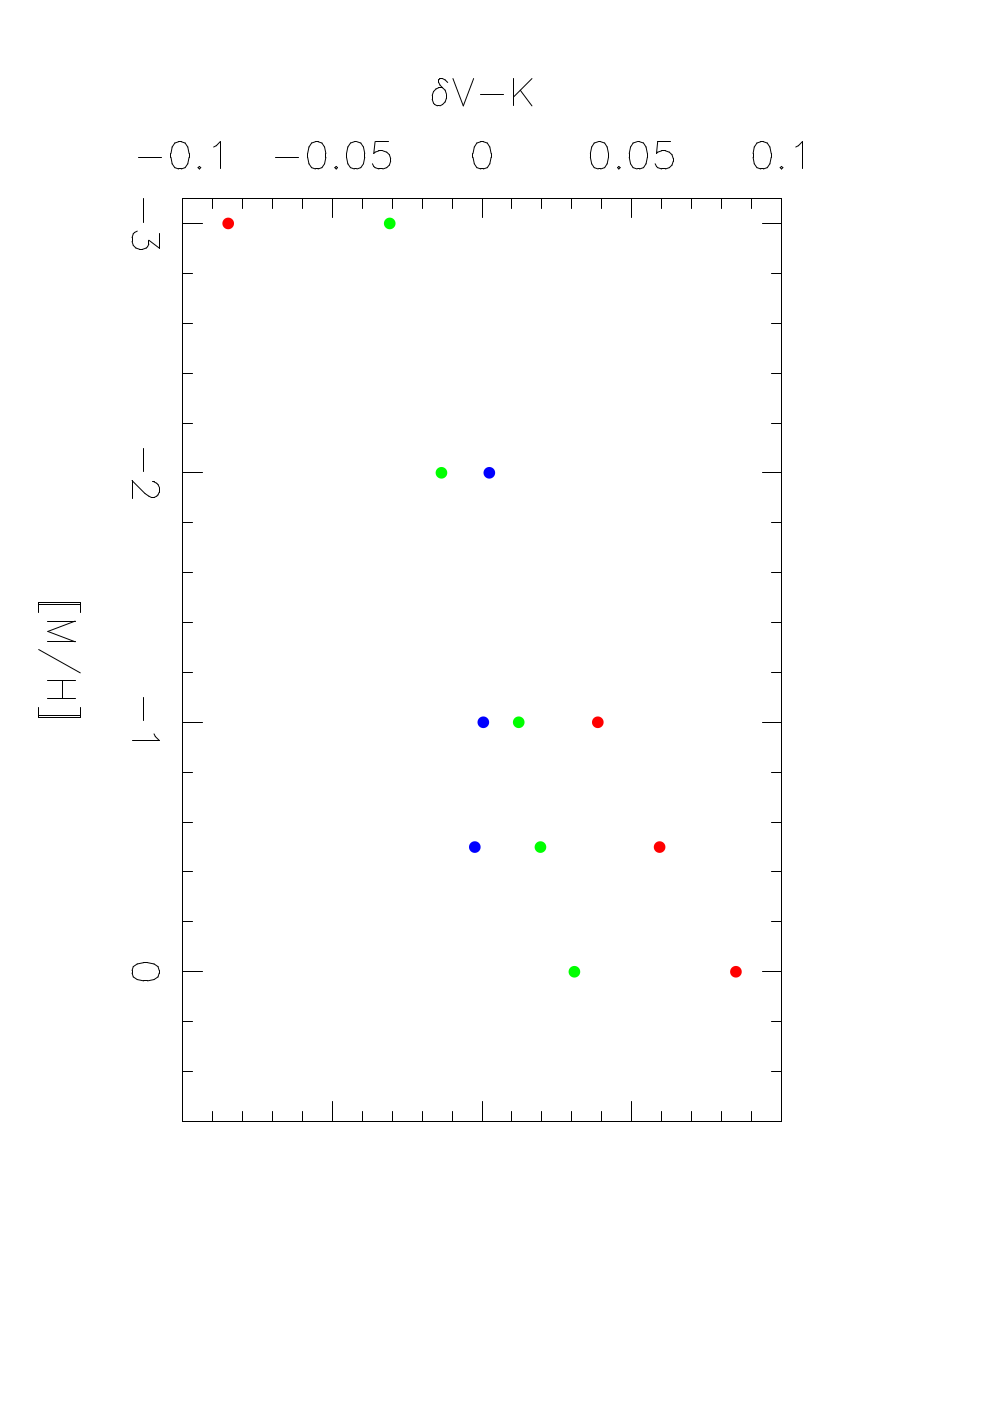
Pietrzynski et al (2019) employ eclipsing binaries from the red clump in the LMC. Onozato et al (2019) find a mean value K 16.82 mag for the red clump in star clusters, and if the LMC is 50 kpc distant, a bolometric correction BCK = 1.92 mag (Johnson 1966) gives log L/L 2.0. For solar mass stars the gravity is log g = 2.2. Figure 2 shows that d(V-K)/dlogZ 0.2/3 mag/dex.
If d(V-K)/dlogTe = 2/0.176, then dlogTe / dlogZ = 0.1 0.176 This means that if an error logZ = 0.3 is made, then logTe =0.434 T/T = 1.76 10-3 and T/T = 0.004, corresponding to a 0.8% error in distance.
V Giant Branch Stars
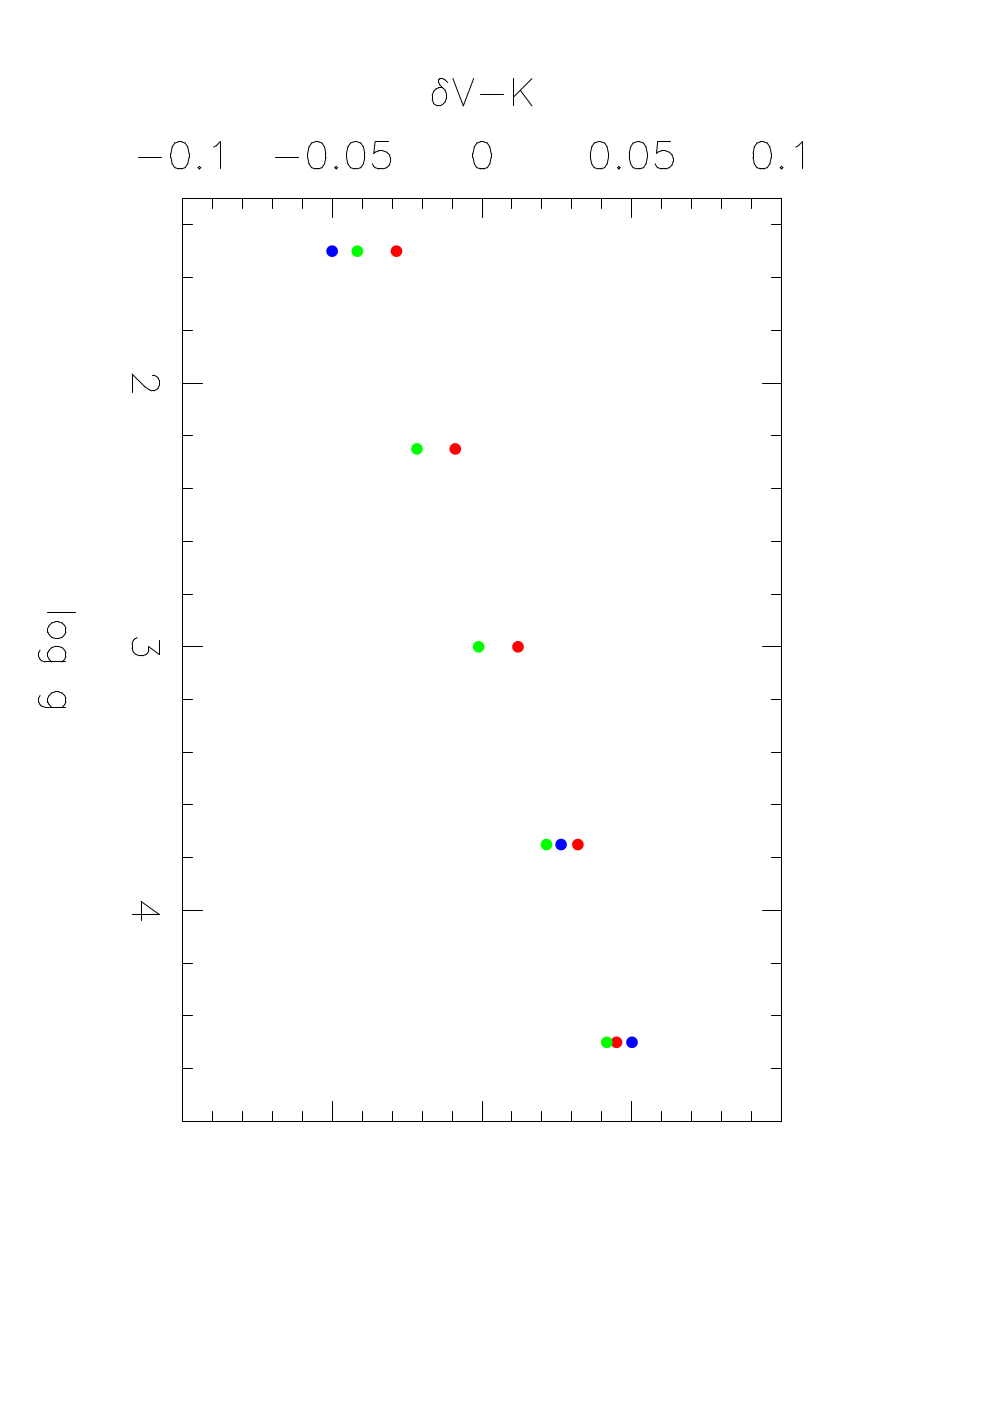
If the stars lie on a giant branch, appropriate gravities for each temperature should be employed. In solar logarithmic units [g] = [M] – [L] + 4[Te]. Modeling the giant branch as a one solar mass line commencing at the Sun and linear in log L, log T to Ltip, Ttip, we can write [L] = [Ltip]/[Ttip] [Te] If Ltip = 2000 L⊙ and Ttip = 3500K, then [g] = 18.9 [Te] With these assumptions we derive Figure 3.

VI Main sequence stars
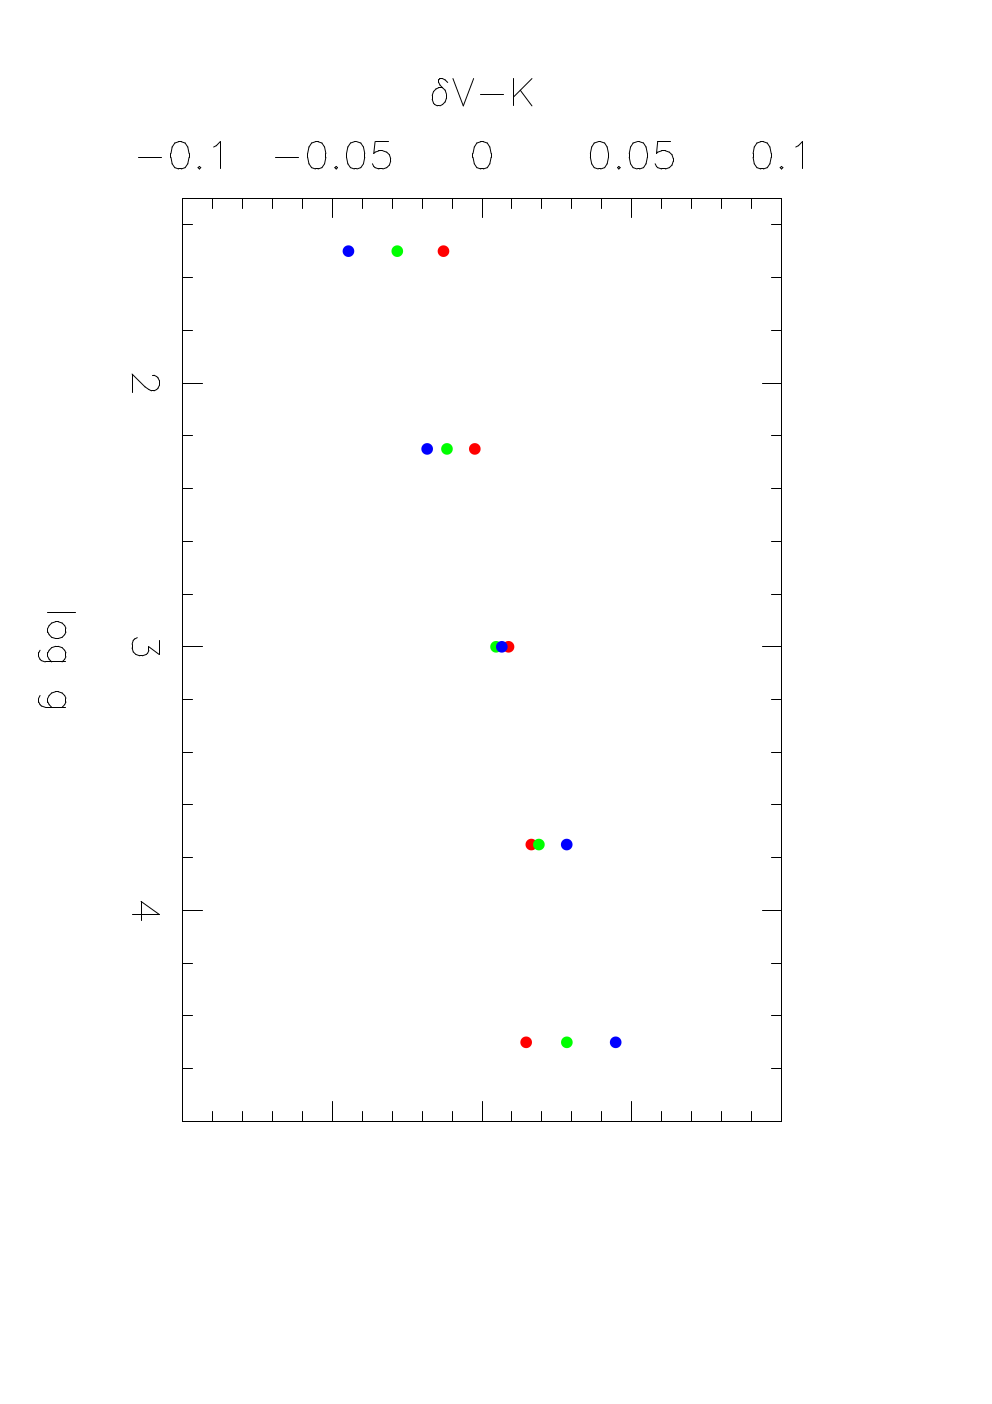
The surface brightness V–K relation is also employed on the main sequence. We show the modeled gravity dependence of V–K, the second term in the error propagation equation, in Figure 4.
VII Conclusion
For precision of 1% in distance the metallicities of eclipsing binaries should not be neglected, as the surface brightness color relation is affected by V–K metallicity dependence at this level. In the range they explore, Onozato et al (2019) find that population effects on JHK colors of LMC red clump stars are small. It may be possible to control the metallicity dependence noted here by small correction to the V–K colors in the V bandpass where blanketing by absorption lines is greater than in the infrared.
I would like to thank the referee for useful comments.
References
Allard, F. 2016, SF2A, Proc. Ann. French Soc. Astr & Ap., Reylé, Richard, Cambrésy, Deleuil, Pécontal, Tresse & Vaughlin, eds., p.237
Bessell, M. 2005, ARAA, 43, 293
Bessell, M. & Brett, J. 1988, PASP, 100, 1134
Buser, R, & Kurucz, R. 1992, A&A, 264, 557
Di Benedetto, G. 1998, A&A, 339, 858
Di Benedetto, G. 2005, MNRAS, 357, 174
Elgueta, S., Graczyk, D. & Gieren, W. 2018, ASP Conf Series, 514, 119
Gustafsson, B. et al 2008, A&A, 486, 951
Johnson, H. 1966, ARAA, 4, 201
Lester, J. & Neilson, H. 2008, A&A, 491, 633
Mould, J., Clementini, G. & Da Costa, G. 2019, PASA, 36, 1
Onozato, H. et al 2019, MNRAS, 486, 5600
Pietrzynski, G. et al 2019, Nature 567, 200