The Galactic spiral structure as revealed by O- and early B-type starsThe Galactic spiral structure as revealed by O- and early B-type stars–References2016
Abstract
We investigate the morphology and kinematics of the Galactic spiral structure based on a new sample of O- and early B-type stars. We select 6,858 highly confident OB star candidates from the combined data of the VST Photometric Survey Data Release 2 (VPHAS+ DR2) and the Gaia Data Release 2 (Gaia DR2). Together with the O-B2 stars from the literature, we build a sample consisting of 14,880 O- and early B-type stars, all with Gaia parallax uncertainties smaller than 20 per cent. The new sample, hitherto the largest one of O- and early B-type stars with robust distance and proper motion estimates, covers the Galactic plane of distances up to 6 kpc from the Sun. The sample allows us to examine the morphology of the Scutum, Sagittarius, Local and Perseus Arms in great detail. The spiral structure of the Milky Way as traced by O- and early B-type stars shows flocculent patterns. Accurate structure parameters, as well as the means and dispersions of the vertical velocity distributions of the individual spiral arms are presented.
Keywords:
stars: early-type – Galaxy: disk – Galaxy: structure1 Introduction
The Galactic spiral structure is an important feature when studying the characteristics and properties of the Milky Way disk. However, we still do not know its exact structure, due to the difficulties of obtaining accurate distances of the tracers (Vallée 2017; Xu et al. 2018b).
Most of the current Galactic spiral models are based on the kinematic distances of ionized regions (Georgelin & Georgelin 1976; Downes et al. 1980; Caswell & Haynes 1987; Russeil 2003; Hou et al. 2009), neutral gas (Kerr 1969; Weaver 1970; McClure-Griffiths et al. 2004; Kalberla & Kerp 2009; Koo et al. 2017) and CO molecular clouds (Solomon & Rivolo 1989; May et al. 1997; Heyer et al. 2001; Dame & Thaddeus 2011; Hou & Han 2014; Sun et al. 2015; Sun et al. 2017). However, due to the large errors of those kinematic distances, the identification of the spiral arms suffers from inevitable large ambiguity. Up to now, there is still no consensus on the number of arms, their locations and properties.
Precise distance is of paramount importance for tracing the structure of the Galactic spiral arms. The accurate distance measurements of masers from the Very Long Baseline Interferometry (VLBI) have been vital to disentangle the spiral arms, spurs and arm branches (Xu et al. 2006; Honma et al. 2007; Reid et al. 2014). However, there are accurate trigonometric parallax observations for only about 100 masers, mostly in the first and second quadrants of the disk.
The second Gaia data release (Gaia DR2; Gaia Collaboration et al. 2018) has provided unprecedented high quality astrometric data for over one billion stars. The uncertainties of Gaia parallaxes vary between 0.04 and 0.1 mas for sources of magnitudes between 8 and 18 mag, yielding parallaxes accurate to 20 per cent out to distance of 5 kpc (Lindegren et al. 2018). Based on the Gaia DR2 parallaxes, Xu et al. 2018a and Xu et al. 2018b have studied the morphology of the Galactic spiral arm structure within 3 kpc of the Sun using a sample of OB stars from Reed 2003. They find that the nearby spiral structure unraveled by this sample agrees well with that revealed by the VLBI masers and extends to the fourth quadrant. They also find new spur-like structures between the major arms.
The Reed OB-star sample that Xu et al. 2018a and Xu et al. 2018b employed is mainly confined to objects brighter than 12th magnitude, and is complete only to 2 kpc. To investigate the Galactic spiral pattern in an even larger spatial volume, one needs a new sample of OB-star candidates of a much deeper limiting magnitude. Skiff 2014 have presented a catalogue of stars with spectral classifications collected from the literature. Some OB stars in the catalogue are fainter than 20th magnitude. The Galactic O-Star Catalog (GOSC; Maíz Apellániz et al. 2013; Maíz Apellániz et al. 2016) contains several hundreds O and other early-type (B/A) stars of magnitudes up to 16 mag, selected from the Galactic O-star spectroscopic survey (GOSSS; Maíz Apellániz et al. 2011). Based on a pure photometric selection algorithm (initiated by Johnson & Morgan 1953), Mohr-Smith et al. 2015 and Mohr-Smith et al. 2017 have selected over 5,000 O- and early B-type star candidates down to a limiting magnitude of 20th magnitude using the photometric data from the VST Photometric Survey (VPHAS+; Drew et al. 2014) for a sky area of 42 deg2. Their method is proved to be of high efficiency and purity. A follow-up spectroscopic campaign of 276 candidates confirms that 97 per cent of them are bona fide OB stars (Mohr-Smith et al. 2017). Most recently, Liu et al. 2019 present a catalogue of about 16,000 OB stars identified in the LAMOST spectroscopic surveys (Deng et al. 2012; Liu et al. 2014; Yuan et al. 2015). However, most of them are late B-type (B4 or later) stars and there are only about 300 O-B2 stars.
The VPHAS+ data release 2 (VPHAS+ DR2; Drew et al. 2014) have presented and photometry of over 300 million objects covering 629 deg2 regions of the Galactic plane. Together with the Gaia DR2, they provide us a great opportunity to select a new sample of O- and early B-type stars and explore the Galactic spiral structure up to 6 kpc from the Sun. In this paper, we have selected a deep sample of OB-star candidates from the VPHAS+ DR2 and Gaia DR2 catalogues. Combined with the O-B2 stars available from the literature, we examine the Galactic spiral structure in unprecedented detail.
The paper is structured as following. In Section 2, we present the relevant VPHAS+ DR2 and Gaia DR2 data. Section 3 describes the new OB-star sample. In Section 4, we present our main results which are discussed and summarized in Section 5.
2 VPHAS+ and Gaia
The new OB star candidates are selected from the VPHAS+ DR2 and Gaia DR2 catalogues.
The VPHAS+ Survey (Drew et al. 2014) collected images in the SDSS broad bands and the narrow band using the OmegaCAM imager (Kuijken 2011) on the VLT Survey Telescope (VST). The survey is designed to cover 2000 deg2 of the Galactic plane in the southern hemisphere of Galactic latitude 5° and Galactic longitude 150° 40°, and a Galactic bulge extension of 10° near the Galactic centre. The VPHAS+ DR2 (Drew et al. 2014), released in 2016, contains PSF and aperture photometry of 319 million point-like sources covering 629 deg2 of the planned VPHAS+ footprint. Typically, a signal-to-noise ratio S/N = 5 cut corresponds to a limiting magnitude of about 22 mag in the and bands. The photometric calibration of VPHAS+ DR2 is consistent with that of the SDSS within an accuracy of 0.05 mag (r.m.s error) for and bands.
To exclude contaminations of sub- and over-luminous OB stars and stars of spectral types B4 and later, we combine the VPHAS+ photometry with the Gaia DR2 data (Gaia Collaboration et al. 2018). Gaia DR2 provides high precision photometric measurements of over 1.4 billion sources in , and bands. The Gaia band covers the entire optical wavelength ranging between 330 and 1050 nm. The (330 - 680 nm) and (630 - 1050 nm) magnitudes are derived from the Gaia low resolution spectrophotometric measurements. The internal validation shows that the Gaia DR2 calibration uncertainties for the , and bands are 2, 5 and 3 mmag, respectively. Gaia DR2 also releases high-quality parallax and proper motion measurements of 1.3 billion sources. The parallax uncertainties are around 0.04 mas for bright sources of 14 mag and around 0.1 mas for sources of 18 mag.
3 The OB-star sample
3.1 OB star candidates from VPHAS+ and Gaia
| Description | Numbers |
| The initial VPHAS+ DR2 Sample | 13,201,826 |
| Sample selected from the VPHAS+ colour-colour diagram | 91,688 |
| Sample with the Gaia photometric and astrometric cuts | 26,936 |
| The VPHAS+ OB star and candidates | 6,858 |
| White dwarf contaminator | 786 |
| Sub-dwarf contaminator | 1,386 |
| B4- and later-type star contaminator | 17,906 |
| O-B2 stars from the literature | 7,441 (Skiff), 442 (Maíz Apellániz et al.) and 931 (Huang et al.) |
| Common stars between the VPHAS+ sample and those from the literature | 93 (Skiff), 2 (Maíz Apellániz et al.) and 3 (Huang et al.) |
| The combined sample of OB stars and candidates | 14,880 |


| Column | Name | Description |
| 1 | id | Index of the star in the catalogue |
| 2 | RA | Right Ascension (J2000) |
| 3 | Dec | Declination (J2000) |
| 4 | u | VPHAS+ -band magnitude |
| 5 | uerr | VPHAS+ -band photometric uncertainty |
| 6 | g | VPHAS+ -band magnitude |
| 7 | gerr | VPHAS+ -band photometric uncertainty |
| 8 | r | VPHAS+ -band magnitude |
| 9 | rerr | VPHAS+ -band photometric uncertainty |
| 10 | i | VPHAS+ -band magnitude |
| 11 | ierr | VPHAS+ -band photometric uncertainty |
| 12 | VPHAS+ -band magnitude | |
| 13 | err | VPHAS+ -band photometric uncertainty |
| 14 | G | Gaia -band magnitude |
| 15 | Gerr | Gaia -band photometric uncertainty |
| 16 | BP | Gaia -band magnitude |
| 17 | BPerr | Gaia -band photometric uncertainty |
| 18 | RP | Gaia -band magnitude |
| 19 | RPerr | Gaia -band photometric uncertainty |
| 20 | dis | Distance of object estimated from Eq. (1) |
| 21 | para | Gaia parallax |
| 22 | paraerr | Gaia parallax uncertainty |
| 23 | pmra | Gaia proper motion in Right Ascension |
| 24 | pmraerr | Uncertainty of proper motion in Right Ascension |
| 25 | pmdec | Gaia proper motion in Declination |
| 26 | pmdecerr | Uncertainty of proper motion in Declination |
| 27 | ref | The reference if the star is already presented in the literature |
| Type | Number | Fraction |
| O stars | 19 | 14 per cent |
| B0-B2 stars | 54 | 39 per cent |
| B3 stars | 9 | 6 pre cent |
| B4-B8 stars | 13 | 9 per cent |
| Other OB stars1 | 30 | 22 per cent |
| WR stars | 5 | 4 per cent |
| A/F/M stars | 9 | 6 per cent |
Notes: 1Of OB spectral type but without subclasses available.
| Column | Name | Description |
| 1 | RA | Right Ascension (J2000) |
| 2 | Dec | Declination (J2000) |
| 3 | G | Gaia -band magnitude |
| 4 | Gerr | Gaia -band photometric uncertainty |
| 5 | BP | Gaia -band magnitude |
| 6 | BPerr | Gaia -band photometric uncertainty |
| 7 | RP | Gaia -band magnitude |
| 8 | RPerr | Gaia -band photometric uncertainty |
| 9 | dis | Distance of object estimated from Eq. (1) |
| 10 | para | Gaia parallax |
| 11 | paraerr | Gaia parallax uncertainty |
| 12 | pmra | Gaia proper motion in Right Ascension |
| 13 | pmraerr | Uncertainty of proper motion in Right Ascension |
| 14 | pmdec | Gaia proper motion in Declination |
| 15 | pmdecerr | Uncertainty of proper motion in Declination |
| 16 | sptype | Spectral type |
| 17 | ref | The reference |
Similarly to Mohr-Smith et al. 2015 and Mohr-Smith et al. 2017, we first select OB star candidates with the (, ) colour-colour diagram. In the diagram, the reddened OB stars of spectral types earlier than B3 are easily identifiable as they are located above and away from the main stellar locus. We select sources in the VPHAS+ DR2 catalogue with cuts 20 mag, -band photometric errors smaller than 0.05 mag, and detections and photometric uncertainties smaller than 0.05 mag. In Fig. 1, we plot the distribution of all stars thus selected in the (, ) colour-colour diagram. We adopt the reddening vector for the B3V stars from Drew et al. 2014. In total, 91,668 unique stars are found located above the B3V-star reddening curve.
Our aim is to select a sample of young and luminous OB stars to trace the Galactic spiral arms. The candidates selected from the (, ) diagram includes all types of OB stars. One thus needs to identify and reject stars amongst those candidates that actually belong to the old populations, such as sub-dwarfs and white dwarfs. In addition, the sample selected from the VPHAS+ colour-colour diagram is also contaminated by a significant number of stars of B4- and later-types due to the relative large photometric uncertainties of -band (see also Mohr-Smith et al. 2017). To exclude those contaminators, Mohr-Smith et al. 2017 carried out a SED analysis based on the multi-band photometry of VPHAS+ and 2MASS. In the current work, we adopt the high precision photometric data and parallaxes from the Gaia DR2 to exclude all the contaminators. We cross-match the candidates with the Gaia DR2 catalogue. We adopt only stars of Gaia parallax errors smaller than 20 per cent, re-normalised unit weight errors (RUWE) small than 1.4 (Gaia technical note GAIA-C3-TN-LU-LL-124-01) and Gaia simple flux ratios smaller than 1.3+0.06 (Evans et al. 2018). This yields 26,936 stars. We construct a Gaia colour-‘absolute’ magnitude diagram, without reddening corrections, using ‘absolute’ magnitude in Gaia -band, , where is distance of the star. The systematic trends and the zero points of the published Gaia magnitudes in the Gaia DR2 are corrected using the relations of Evans et al. 2018 and Maíz Apellániz & Weiler 201811 1 https://www.cosmos.esa.int/web/gaia/dr2-known-issues. The distances of objects in this work are calculated from the Gaia parallaxes using a Bayesian distance estimator (Maíz Apellániz 2005; Bailer-Jones et al. 2018), given by,
| (1) |
where and are Gaia parallax and its associated uncertainty, the global parallax zeropoint ( 0.029 from Lindegren et al. 2018) and the space density distribution prior for the Galactic OB stars adopted from Maíz Apellániz et al. 2008.
The Gaia colour-‘absolute’ magnitude diagram for the 26,936 selected candidates in the current work is shown in Fig. 2. The stars fall clearly into four groups, a group of young and luminous OB stars located at the top of the diagram with 0 mag, a second group of white dwarfs of 10 mag, a third group of sub-dwarfs of 2 mag and 1 mag (below the PARSEC isochrone) and a fourth group of B4- and later-type stars of 2 mag and 1 mag (above the PARSEC isochrone). The extinction vector for a B3V star, calculated with the extinction law of Maíz Apellániz et al. 2014 assuming = 3.1 (Maíz Apellániz & Barbá 2018), nicely separates the OB stars and the contaminators. Most O-B2 candidates from the literature are located well above the B3V extinction curve. Table 1 gives the number of stars selected in each step of our OB-star selection procedure. The majority of the sample in Fig. 2 are B4- and later-type stars (17,906 out of 26,936). This is largely due to the relatively large uncertainties of the VPHAS+ band magnitudes.
Based on the above exercise, 6,858 OB candidates have been selected
above the B3V-star extinction curve. A catalogue of
these OB-star candidates is available in electronic form in the online version of this
manuscript22
2
The catalogue is also available online via
“http://paperdata.china-vo.org/diskec/obsamp/table2.fits”.. Table 2 describes
the data format of the catalogue. In order to check if any objects in our catalogue
have known spectral types, we cross-match our candidates with the SIMBAD
database with a match radius of 1 arcsec. We find 139 objects that have
been spectroscopically classified in the SIMBAD.
Table 3 summarises the numbers and fractions of those stars in different spectroscopically confirmed spectral types.
The majority of them are indeed OB stars as expected, with a contamination at the level of
10 pre cent from Wolf-Rayet (WR) stars, and later A, F and M stars.
A very positive feature of Table 3 is the high success-rate that we are able to place stars correctly into
the O and early B spectral types. Most of the OB stars are of early types (B3 and earlier),
with only about 9 per cent contamination of B4 and later types.
We have also checked our OB-star candidates against data from large-scale spectroscopic surveys, and find
27 common stars with the LAMOST surveys.
There are 25 stars that have effective temperatures higher than 12,000 K in the value-added catalogue of the LAMOST
Spectroscopic Survey of the Galactic Anti-centre Data Release 2
(LSS-GAC DR2; Xiang et al. 2017).
3.2 OB stars from the literature
In addition to the new OB candidates selected from the VPHAS+ DR2 catalogue, we have also made use of the OB stars available in the literature. In the current work, we adopt three catalogues, the GOSC catalogue (Maíz Apellániz et al. 2013), the OB star catalogue selected from Skiff 2014 and that of Huang et al. (in prep.) selected from the LAMOST Spectroscopic Survey of the Galactic Anti-centre (LSS-GAC; Liu et al. 2014; Yuan et al. 2015).
Skiff 2014 present a catalogue of 0.9 million stars with spectral classifications complied from the literature. In this work, we select O-B2 stars from this catalogue and cross-match them with the Gaia DR2 catalogue. After excluding stars with parallax uncertainties larger than 20 per cent, RUWEs larger than 1.4 and larger than 1.3+0.06, we are left with 7,441 unique objects. Amongst those, 93 objects are common with the new VPHAS+ sample.
The objects of the GOSC catalogue are identified from the new, homogeneous, high signal-to-noise ratio, and low spectral resolution GOSSS survey. The current version of the catalogue (v4.1) contains 594 O stars, 24 BA stars, and 11 late-type stars. We select O-B2 stars from the catalogue and cross-match them with the Gaia DR2 catalogue. Again, stars with parallax uncertainties larger than 20 per cent, RUWEs larger than 1.4 and larger than 1.3+0.06 are excluded. This yields 442 unique objects. There are 246 common objects between the GOSC and the Skiff samples. Only 2 common objects are found between the GOSC and the new VPHAS+ samples.
The LAMOST telescope has surveyed several millions stars in a contiguous area of the Galactic disk toward the Galactic anti-centre (150° 210°and 30°). From the LAMOST spectra, Huang et al. (in prep.) have identified 25,000 OB stars with Gaia parallax errors smaller than 20 per cent, RUWEs smaller than 1.4 and smaller than 1.3+0.06. 931 of them are identified as O-B2 stars. There are 237 common stars between the Huang et al and the Skiff samples. Only 6 common stars are found between the Huang et al and the GOSC samples. As the LAMOST surveys are spectroscopic and the survey areas do not have much overlap with the VPHAS+ survey, there are only 3 common stars between the Huang et al. sample and the new VPHAS+ sample.
This catalogue of all O-B2 stars compiled from the literature is available in electronic
form in the online version of this manuscript33
3
The catalogue is also available online via
“http://paperdata.china-vo.org/diskec/obsamp/table4.fits”.. Table 4 describes the format of the catalogue.
3.3 The combined sample of OB stars and candidates
Combing our newly selected VPHAS+ OB-star candidates with those from the literature, we obtain a catalogue of 14,880 unique OB stars and candidates, all with Gaia parallax uncertainties smaller than 20 per cent. Distances of all stars in the catalogue are calculated from the Gaia parallaxes using Eq. (1). We have compared our distance estimates with those of Bailer-Jones et al. 2018 and found no systematics between them and the dispersion is very small (about 1 pre cent). In Fig. 3, we show the distribution of those OB stars and candidates in the Galactic - plane. This new combined sample spans from = 8 to 5 kpc and = 2 to 15 kpc in the Galactic plane. The VPHAS+ and the literature samples complement with each other in the spatial coverage. The Skiff and Maíz Apellániz et al. sample stars are mainly distributed at distances 4 kpc from the Sun, while those of Huang et al. and those newly selected from the VPHAS+ fall between 2 6 kpc from the Sun. Stars from Huang et al. are mainly in the Galactic outer disk while those of the VPHAS+ are in the Galactic inner disk.
4 The Galactic spiral arms

4.1 Morphology of the Galactic spiral structure
As Fig. 3 shows, the OB stars fall in clumps and strips, and trace clearly the structure of the Galactic spiral arms. The gaps between the arms are quite visible. Comparing with previous work (Reid et al. 2014; Xu et al. 2018a; Xu et al. 2018b), our data have a larger spatial coverage and probe much further distances from the Sun. Thanks to the deep limiting magnitudes of the VPHAS+ and LAMOST data, we are now able to explore the disk area of distances between 4 and 6 kpc from the Sun for the first time.
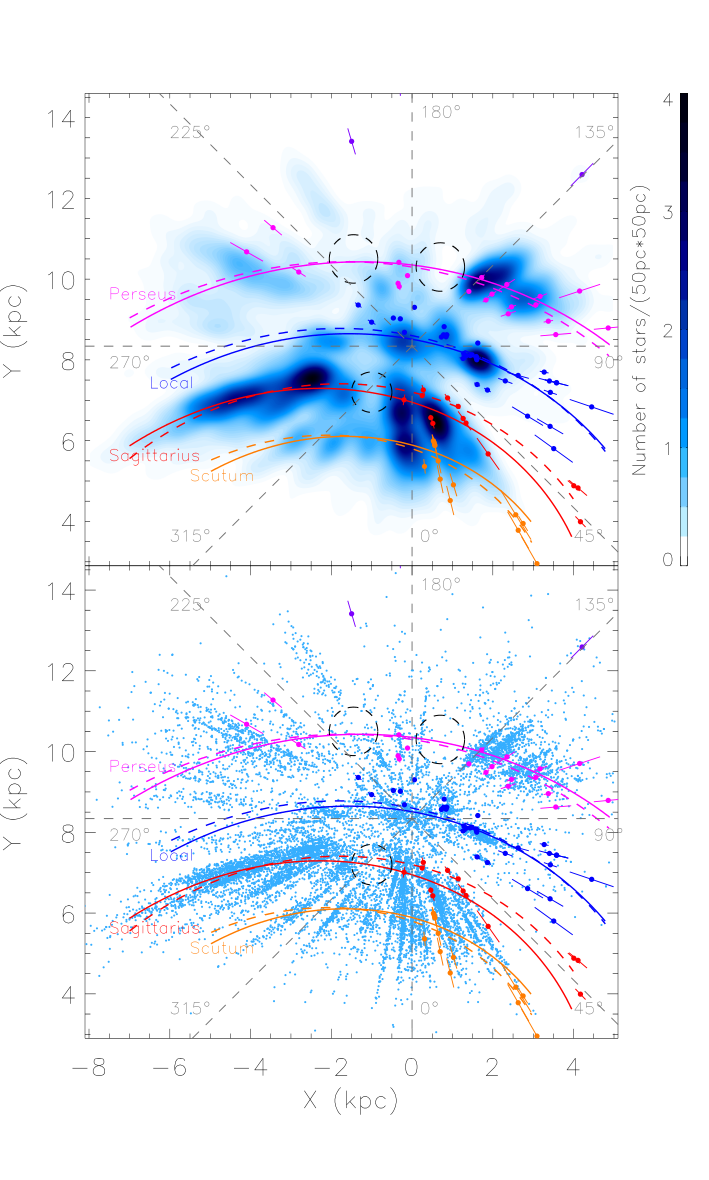
In Fig. 4, we plot the spatial and density distributions of the OB stars in the - plane. The density is calculated using a Kernel Density Estimation (KDE) of a Gaussian Kernel of bandwidth 0.2 kpc. The masers from the literature (Table 2 of Xu et al. 2018b) are over-plotted in the diagram. The similarity in the distributions of these two types of tracers is clearly visible. This is not surprising as masers and young OB associations are both good tracers of massive star forming regions. Overall, the spiral pattern revealed by the OB stars and the masers consists of four spiral arm segments.
In the top parts of the two panels of Fig. 4 (Galactocentric distance 12 kpc), there are two masers (purple circles), probably the sign posts of the position of the Outer Arm. Limited by the Gaia parallax uncertainties, only a few OB stars are found in this region in the current work. Nevertheless, several OB stars are indeed found around one of the two masers ( 135°). Two strips of OB stars, one at () (2.5 kpc, 12 kpc) and another at () (2 kpc, 12 kpc), are visible, and they could belong to the Outer Arm, or to the bridge that connects the Outer and the Perseus Arms.
The Perseus Arm is well constrained by both the OB stars and the masers from = 90° to 270°. In the regions of between 135° and 170° and between 190° and 220°, there are two ‘holes’ without masers or few OB stars. The holes are probably true as these regions are well covered by the VPHAS+ and LAMOST data. OB stars are clearly found in the same directions at either nearer or further distances from the Sun. Thus it is unlikely that we miss the OB stars in the holes should they exist. It is interesting to note that the two possible bridges that connect the Outer and the Perseus Arms fall in those two directions. On the near side of the two holes ( = 1.5 to 1.5 kpc and 9 kpc), several groups of OB stars as well as some masers are found between the Perseus and the Local Arms.
The Local Arm is the nearest spiral arm to our Sun and the most well defined in the plot. All the OB clumps (or strips) of the other arms show significant linear patterns (“fingers”) that point toward the Sun, which are possibly the results of the discontinuous distribution of the VPHAS+ and LAMOST fields, and have relatively large distance dispersions of about 1 kpc, which are likely mainly caused by the relatively large errors in the distances. The Local Arm are well resolved into several small OB clumps, with our Sun located near one of them. The presence of OB stars near () = (6 kpc, 7.5 kpc) suggests that the Local Arm may extend into the fourth quadrant at 280°, indicating that the Local Arm might well be a major spiral arm, rather than a spur structure.
The Sagittarius Arm is well constrained by the OB clumps from = 290° ( = 7 kpc and = 5.5 kpc) to 30° ( = 2 kpc and = 6 kpc). A possible ‘hole’ pattern is visible in the directions of between 320° and 350°. Similar to the ‘holes’ in the Perseus Arm, there are several OB clumps found at both the nearer and further sides of the ‘hole’, connecting the Sagittarius Arm with the Local and the Scutum Arms, respectively. There are a lot more OB stars falling along the Sagittarius Arm than those on the Local and the Perseus Arms, suggesting that the star-forming activities are much stronger in the inner disk than those in the outer disk.
The gap between the Scutum and the Sagittarius Arms is not significant in the first quadrant. Due to the large distance uncertainties of stars in that region, we are not able to distinguish whether this small gap is largely caused by the effects of the large distance errors or the two Arms actually merge into one in this region. The gap between the two Arms in the fourth quadrant is clearly visible.
In general, all the Spiral Arms discussed above are well traced by the discrete OB clumps and masers. In addition to ‘holes’, many more possible patterns, such as branches, spurs and bridges between the major spiral arms, are identifiable. We therefore can confirm the conclusion of Xu et al. 2018b that the spiral structure of our Galaxy as traced by the young OB stars is flocculent, instead of a pure, grand-design spiral structure.
| Arm | ||||
| (kpc) | (°) | |||
| Scutum Arm | 5.890.02 | 15.10.7 | 3.5 | 6.5 |
| Sagittarius Arm | 6.950.01 | 17.40.2 | 4.1 | 6.8 |
| Local Arm | 8.510.01 | 10.20.2 | 2.0 | 7.1 |
| Perseus Arm | 10.350.01 | 7.00.3 | 3.9 | 6.9 |
4.2 Spiral arm models
Following Hou & Han 2014 and Xu et al. 2018b, we derive the parameters of the arm structures, including the Scutum, Sagittarius, Local and Perseus Arms, based on the current sample of OB stars candidates, as well as masers. We adopt the simple, logarithmic model of a spiral arm (Kennicutt 1981), i.e.,
| (2) |
where is the Galactocentric distance, the Galactocentric azimuth that has a value of 0 in the direction toward the Sun and increases clockwise, the radius of the arm at reference azimuth = 0° and the pitch angle of the arm. We perform an MCMC analysis to find the optimized value of each of the parameters by minimising a factor defined as,
| (3) |
where is the weight, and the Cartesian coordinates, and the indexes of tracers and model positions closest to the tracers. In the current work, we simply adopt a weight = 1 for all the OB stars and candidates and = 10 for all the masers (Xu et al. 2018b). The errors of the derived parameters are calculated using the bootstrap method (Wall & Jenkins 2003). We randomly re-sampled the combined OB sample 1000 times and obtain the best-fit parameters for each sample. The r.m.s scatters of the resulted parameters give the uncertainties of our results.
The best-fitted models of the individual arms are plotted in Fig. 4 and the corresponding parameters are listed in Table 5. Our models connect most of the OB clumps and masers. The resulted values of distance of the four spiral arms are very similar to those from Xu et al. 2018b, who obtain the structure parameters of the four arms using O stars from Reed 2003 and the masers. Our current sample of traces covers a larger range in the - space than that of Xu et al. 2018b. And this yields the pitch angles of the individual arms that differ slightly from those of Xu et al. 2018b but match better with the new data.
4.3 Vertical motions of the spiral arms
The Gaia DR2 catalogue has provided us accurate proper motions for the OB stars in our catalogue. As most of the OB stars are located in the Galactic plane of 0°, the vertical components of their radial velocities can be ignored. Thus the vertical velocities of the individual targets in our catalogue can be simply calculated from Gaia proper motions. We select 11,437 OB stars and candidates of Galactic latitude 2° and calculate values of their vertical velocity . The distribution of values thus derived is plotted in Fig. 5. Similar to the spatial position distribution, the distribution of these OB stars are also striped and clumped. We have estimated the means and dispersions of of the individual spiral arms and the results are listed in Table 5. In general, the spiral arms have a negative mean vertical motion that varies slightly from one arm to another. The dispersions of of the individual arms are quite similar, 7 .
5 Discussion and summary

In Fig. 6 we compare the spatial distribution of our OB stars and candidates with that of the interstellar dust reddening for 0.5° of the Galactic plane (Chen et al. 2019). Due to the heavy extinction in the Galactic plane, the extinction map of Chen et al. 2019 is only completed to 3 kpc. Overall, there is a good correlation between the distribution of the OB stars and candidates and that of the interstellar dust at large scales. The Sagittarius, Local and Perseus arms are discernible in both the interstellar dust extinction map and in the OB star distribution. The dust clouds are very likely to be spatially associated with the Galactic spiral arm models delineated in the current work.
In this paper, we have identified 6,858 new O- and early B-type star candidates from the VPHAS+ DR2 and Gaia DR2 catalogues. Combined with the O-B2 candidates available in the literature, we have built a sample of 14,880 O- and early B-type stars and candidates with Gaia parallax errors smaller than 20 per cent. This is hitherto the largest sample of O- and early B-type stars and candidates with accurate distance and proper motion estimates. Based on the catalogue, we have explored the morphology and kinematics of the Galactic spiral structure. Our sample reveal clearly four spiral arm segments, i.e., the Scutum, Sagittarius, Local and Perseus Arms. We have obtained accurate structure parameters of those Arms. The data show three possible ‘hole’ patterns along the Galactic spiral arms, in addition to abundant other substructures. The Galactic spiral structures as traced by the young OB stars are more likely flocculent spirals.
The size and the spatial distribution of our sample are mainly limited by the parallax uncertainties of the Gaia DR2. If we loose the Gaia parallax uncertainties up to 30 per cent, the number of the selected VPHAS+ OB candidates would be doubled and the sample will extend to a distance of 10 kpc from the Sun. However, the increased distance errors will lead to a larger fraction of contamination of the sub-dwarfs. Meanwhile the distance uncertainty might become comparable to or even larger than the gaps between the spiral arms. The future Gaia releases are expected to improve our work by enlarging the sample size and also the spatial coverage. On the other hand, VPHAS+ DR2, that we used in the current work, covers only 20 per cent of the full footprint of the VPHAS+ survey. The future VPHAS+ data release would also help enlarge our data set and extend to higher Galactic latitudes. Other ongoing and future -band photometric surveys, such as the SkyMapper, the Large Synoptic Survey Telescope (LSST) and the Multi-channel Photometric Survey Telescope (Mephisto) surveys, will aid in the construction of samples of more O- and early B-type stars that cover larger areas of the Galactic plane.
Acknowledgements
We want to thank our anonymous referee for the insightful comments. This work is partially supported by National Natural Science Foundation of China 11803029, U1531244, 11833006 and U1731308 and Yunnan University grant No. C176220100007. LGH is supported by the National Key R&D Program of China (NO. 2017YFA0402701) and the Youth Innovation Promotion Association CAS. HBY is supported by NSFC grant No. 11603002 and Beijing Normal University grant No. 310232102. This research made use of the cross-match service provided by CDS, Strasbourg.
This work has made use of data products from the Guoshoujing Telescope (the Large Sky Area Multi-Object Fibre Spectroscopic Telescope, LAMOST). LAMOST is a National Major Scientific Project built by the Chinese Academy of Sciences. Funding for the project has been provided by the National Development and Reform Commission. LAMOST is operated and managed by the National Astronomical Observatories, Chinese Academy of Sciences.
Based on data products from observations made with ESO Telescopes at the La Silla Paranal Observatory under programme ID 177.D-3023, as part of the VST Photometric H Survey of the Southern Galactic Plane and Bulge (VPHAS+, www.vphas.eu).
This work presents results from the European Space Agency (ESA) space mission Gaia. Gaia data are being processed by the Gaia Data Processing and Analysis Consortium (DPAC). Funding for the DPAC is provided by national institutions, in particular the institutions participating in the Gaia MultiLateral Agreement (MLA). The Gaia mission website is https://www.cosmos.esa.int/gaia. The Gaia archive website is https://archives.esac.esa.int/gaia.
References
- Bailer-Jones et al. (2018) Bailer-Jones, C. A. L., Rybizki, J., Fouesneau, M., Mantelet, G., & Andrae, R. 2018, AJ, 156, 58
- Caswell & Haynes (1987) Caswell, J. L. & Haynes, R. F. 1987, A&A, 171, 261
- Chen et al. (2019) Chen, B.-Q., et al. 2019, MNRAS, 483, 4276
- Dame & Thaddeus (2011) Dame, T. M. & Thaddeus, P. 2011, ApJ, 734, L24
- Deng et al. (2012) Deng, L.-C., et al. 2012, Research in Astronomy and Astrophysics, 12, 735
- Downes et al. (1980) Downes, D., Wilson, T. L., Bieging, J., & Wink, J. 1980, A&AS, 40, 379
- Drew et al. (2014) Drew, J. E., et al. 2014, MNRAS, 440, 2036
- Evans et al. (2018) Evans, D. W., et al. 2018, A&A, 616, A4
- Gaia Collaboration et al. (2018) Gaia Collaboration, et al. 2018, A&A, 616, A1
- Georgelin & Georgelin (1976) Georgelin, Y. M. & Georgelin, Y. P. 1976, A&A, 49, 57
- Heyer et al. (2001) Heyer, M. H., Carpenter, J. M., & Snell, R. L. 2001, ApJ, 551, 852
- Honma et al. (2007) Honma, M., et al. 2007, PASJ, 59, 889
- Hou & Han (2014) Hou, L. G. & Han, J. L. 2014, A&A, 569, A125
- Hou et al. (2009) Hou, L. G., Han, J. L., & Shi, W. B. 2009, A&A, 499, 473
- Johnson & Morgan (1953) Johnson, H. L. & Morgan, W. W. 1953, ApJ, 117, 313
- Kalberla & Kerp (2009) Kalberla, P. M. W. & Kerp, J. 2009, ARA&A, 47, 27
- Kennicutt (1981) Kennicutt, Jr., R. C. 1981, AJ, 86, 1847
- Kerr (1969) Kerr, F. J. 1969, ARA&A, 7, 39
- Koo et al. (2017) Koo, B.-C., Park, G., Kim, W.-T., Lee, M. G., Balser, D. S., & Wenger, T. V. 2017, PASP, 129, 094102
- Kuijken (2011) Kuijken, K. 2011, The Messenger, 146, 8
- Lindegren et al. (2018) Lindegren, L., et al. 2018, A&A, 616, A2
- Liu et al. (2014) Liu, X.-W., et al. 2014, in IAU Symposium, Vol. 298, IAU Symposium, ed. S. Feltzing, G. Zhao, N. A. Walton, & P. Whitelock, 310–321
- Liu et al. (2019) Liu, Z., Cui, W., Liu, C., Huang, Y., Zhao, G., & Zhang, B. 2019, ApJS, 241, 32
- Maíz Apellániz (2005) Maíz Apellániz, J. 2005, in ESA Special Publication, Vol. 576, The Three-Dimensional Universe with Gaia, ed. C. Turon, K. S. O’Flaherty, & M. A. C. Perryman, 179
- Maíz Apellániz et al. (2008) Maíz Apellániz, J., Alfaro, E. J., & Sota, A. 2008, arXiv e-prints: 0804.2553
- Maíz Apellániz & Barbá (2018) Maíz Apellániz, J. & Barbá, R. H. 2018, A&A, 613, A9
- Maíz Apellániz et al. (2014) Maíz Apellániz, J., et al. 2014, A&A, 564, A63
- Maíz Apellániz et al. (2016) Maíz Apellániz, J., et al. 2016, ApJS, 224, 4
- Maíz Apellániz et al. (2013) Maíz Apellániz, J., et al. 2013, in Massive Stars: From alpha to Omega, 198
- Maíz Apellániz et al. (2011) Maíz Apellániz, J., Sota, A., Walborn, N. R., Alfaro, E. J., Barbá, R. H., Morrell, N. I., Gamen, R. C., & Arias, J. I. 2011, in Highlights of Spanish Astrophysics VI, ed. M. R. Zapatero Osorio, J. Gorgas, J. Maíz Apellániz, J. R. Pardo, & A. Gil de Paz, 467–472
- Maíz Apellániz & Weiler (2018) Maíz Apellániz, J. & Weiler, M. 2018, A&A, 619, A180
- Marigo et al. (2017) Marigo, P., et al. 2017, ApJ, 835, 77
- May et al. (1997) May, J., Alvarez, H., & Bronfman, L. 1997, A&A, 327, 325
- McClure-Griffiths et al. (2004) McClure-Griffiths, N. M., Dickey, J. M., Gaensler, B. M., & Green, A. J. 2004, ApJ, 607, L127
- Mohr-Smith et al. (2015) Mohr-Smith, M., et al. 2015, MNRAS, 450, 3855
- Mohr-Smith et al. (2017) Mohr-Smith, M., et al. 2017, MNRAS, 465, 1807
- Reed (2003) Reed, B. C. 2003, AJ, 125, 2531
- Reid et al. (2014) Reid, M. J., et al. 2014, ApJ, 783, 130
- Russeil (2003) Russeil, D. 2003, A&A, 397, 133
- Skiff (2014) Skiff, B. A. 2014, VizieR Online Data Catalog, 1
- Solomon & Rivolo (1989) Solomon, P. M. & Rivolo, A. R. 1989, ApJ, 339, 919
- Sun et al. (2017) Sun, Y., Su, Y., Zhang, S.-B., Xu, Y., Chen, X.-P., Yang, J., Jiang, Z.-B., & Fang, M. 2017, ApJS, 230, 17
- Sun et al. (2015) Sun, Y., Xu, Y., Yang, J., Li, F.-C., Du, X.-Y., Zhang, S.-B., & Zhou, X. 2015, ApJ, 798, L27
- Vallée (2017) Vallée, J. P. 2017, The Astronomical Review, 13, 113
- Wall & Jenkins (2003) Wall, J. V. & Jenkins, C. R. 2003, Practical Statistics for Astronomers, ed. R. Ellis, J. Huchra, S. Kahn, G. Rieke, & P. B. Stetson
- Weaver (1970) Weaver, H. 1970, in IAU Symposium, Vol. 38, The Spiral Structure of our Galaxy, ed. W. Becker & G. I. Kontopoulos, 126
- Xiang et al. (2017) Xiang, M.-S., et al. 2017, MNRAS
- Xu et al. (2018a) Xu, Y., et al. 2018a, A&A, 616, L15
- Xu et al. (2018b) Xu, Y., Hou, L.-G., & Wu, Y.-W. 2018b, Research in Astronomy and Astrophysics, 18, 146
- Xu et al. (2006) Xu, Y., Reid, M. J., Zheng, X. W., & Menten, K. M. 2006, Science, 311, 54
- Yuan et al. (2015) Yuan, H.-B., et al. 2015, MNRAS, 448, 855