Preliminary results of the AMIGA engineering array at the Pierre Auger Observatory
Abstract
The Auger Muons and Infill for the Ground Array (AMIGA) aims to both extend the detection range of the Pierre Auger Observatory down to energies and to measure the muon content of extensive air showers. To accomplish these goals, its detection system is composed of an array of coupled water-Cherenkov and scintillation detectors deployed in a graded triangular grid of 433 and 750 m spacings. At each position, the scintillation detector is buried deep so as to shield it from the air shower electromagnetic component and thus only measure the muon component. These muon detectors have area split into modules, each of them highly segmented in 64 plastic-scintillator strips with an embedded wavelength-shifter optical fiber to transport light to an optical sensor located at the center of the module. During the engineering array phase (finished in November 2017) two module areas ( and ) and two optical sensors (photo-multiplier tubes and silicon-photomultipliers) were tested. In this work, we present the final performance of the muon detectors equipped with silicon-photomultipliers which were thereafter selected as the baseline design for the AMIGA production phase. Analyses and results are based both on laboratory and field measurements.
1 The AMIGA array
The Pierre Auger Observatory completed its surface-detector array with spacing (SD-1500) in 2008 to study cosmic rays with energies above eV. An area of was fully deployed with water-Cherenkov detectors (WCD) Auger2015. To extend the energy threshold down to eV, the Auger Muons and Infill for the Ground Array (AMIGA) AMIGA proposed a smaller area of which has already been completely equipped with WCDs spaced at (SD-750). More recently an even denser array at a spacing with an area of is being deployed (SD-433).
Still, AMIGA’s main and novel contribution to the Pierre Auger Observatory is to provide direct muon measurements with dedicated underground muon detectors (UMD) made of plastic scintillators. Each UMD is coupled to a WCD of both SD-750 and SD-433 arrays. Between March 2015 and November 2017, an UMD engineering array (EA) was operated in the SD-750 as a proof of concept, for physics validation, and optimization of the detector design. The layout of this EA is shown in fig. 1.


The of scintillators, buried deep close to a WCD, were segmented in modules of 5 and 10 . In turns, each module consists of 64 extruded plastic-scintillator bars with a wavelength-shifter optical fiber glued to transport light towards an optical connector located at the module center Suarez. Two kinds of optical sensors were tested during the prototype phase: a 64 pixel multi-anode photomultiplier tube (MPMT) and an array of 64 silicon photomultipliers (SiPM). After completion of these tests, the final decision for the production phase was to only build modules equipped with SiPMs. A schematic of the final layout is shown in fig. 2 alongside a field deployment in which is seen the inspection tube that hosts the electronics and the optical sensors.
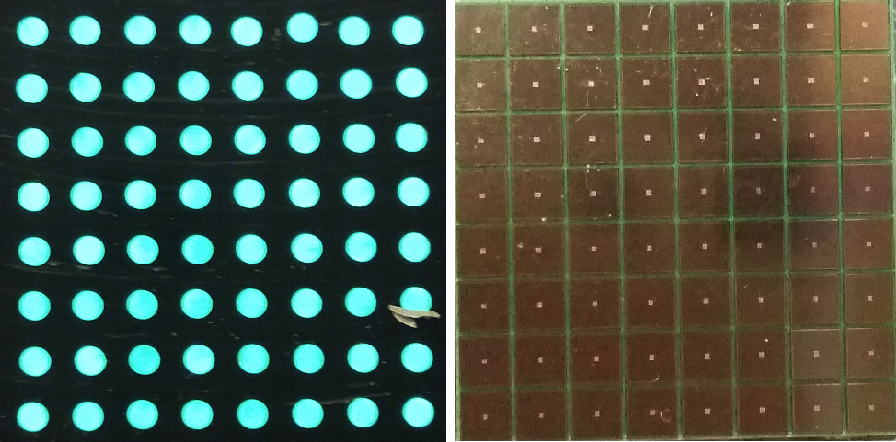
In fig. 3, an example of a module fabrication and assembly is shown together with the chosen SiPM array (Hamamatsu S13361-2050NE-08) and the optical connector that couples the fibers onto it.
The electronics readout works simultaneously as a counter (counts number of arriving muons) and as an integrator (integrates the total signal of the arriving muons). The counter mode consists of 64 channels (one for each scintillator strip in a module) made of a pre-amplifier, a fast-shaper and, finally, a discriminator. These channels are integrated in two 32-pixel ASICs (Application-Specific Integrated Circuits). The signals after the discriminators are all identical in amplitude and only differ in their time width depending on the time the input pulses are above a given threshold. All signals from the 64 discriminators are sampled by a Field-Programmable Gate Array (FPGA) with a sampling time of (). At each sampling, the FPGA associates a “1” if the discriminator pulse is present and a “0” otherwise. As a result, the electronics for the counter mode outputs 64 binary traces where individual muons, and their arrival time, can be easily measured by inspecting the strings of “1s”.

On the other hand, and complementary to the counter mode, the integrator mode of the front-end electronics adds up analogically the 64 SiPM signals and processes the result through a low-gain and a high-gain amplification channel. The amplified signals are sampled with Analog-to-Digital Converters (ADCs) with sample time of (), resulting in two waveforms of 1024 samples from which the total charge of the signal may be calculated.
The counter mode is hardware limited by the segmentation of each module since if two muons arrive simultaneously in any given strip (i.e. within a preset time window AMIGA, typically of 35 ns), they will pile up and be counted as a single muon11 1 It is important to stress, that the time distribution of muons within a shower certainly allows one to measure more than one muon per strip in the counter mode, increasing noticeably the total number of non-simultaneous particles that can be measured. The integrator mode solves this issue and extends the dynamic range of the detector to measure higher muon densities close to the shower core.
2 SiPM operation
A single silicon photomultipier is an array of photodiodes (referred as micro-cells) with densities that usually range from a hundred to several thousand per . The photodiodes are operated with a reverse voltage () which exceeds the breakdown voltage () of the silicon junction.
is the minimum voltage needed for SiPMs to operate in Geiger mode Renker. If , each electron-hole pair created by the absorption of a photon produces a diverging avalanche of multiplication of carriers resulting in a macroscopic current flow in a single micro-cell. If the generated Geiger avalanche is not confined to the same micro-cell it was initiated in, crosstalk is produced, and the SiPM outputs a pulse with twice (or more) the amplitude and charge of a single photo-equivalent (PE) pulse. As an illustration, in the left panel of fig. 4, the oscilloscope capture of dark pulses of the AMIGA SiPM is shown. Therein, the discrete nature of the crosstalk pulses (as well as those of the afterpulses) is seen. Fig. 5 depicts the PE amplitude spectrum arising from the crosstalk. The selected SiPM for AMIGA has 1584 micro-cells and, as already explained, there are 64 SiPMs per muon module coupled to the fibers through an optical connector (see fig. 3). It is known that SiPMs have a high dark rate so each of these 64 pixels might produce muon overcounting during data taking. Their dark rate (as well as crosstalk and gain) is proportional to the over-voltage (), which is in turn determined by . In the right panel of fig. 4, the gain, dark rate, and crosstalk are shown as a function of while the experimental measurement of is shown in the right-hand side of fig. 5.
The operating point of each AMIGA module is set by choosing a single value for all its 64 SiPMs to assure a uniform gain for all of them. On top of this and regarding the counter-mode operation of the front-end electronics, a discriminator threshold has to be selected. During the EA phase, these two parameters were optimized to enhance the detector performance. Note that increasing increases both noise and efficiency while a higher discrimination threshold reduces noise but may alongside reduce the detector efficiency. Laboratory measurements Matias have shown that both low background noise and high efficiency are achieved for V with a discriminator threshold set to . A signal equal or above this threshold is counted as a muon in the UMD counter mode. This one-bit electronics makes muon identification fairly independent of fluctuations (light production, amplitude of PE signals, fiber attenuation, gain shifts).
2.1 Calibration
Contrary to MPMTs, SiPMs have a well-defined PE spectrum. Therefore, it is possible to calibrate them using dark-rate pulses. The PE amplitude spectrum can be obtained by measuring the dark rate as a function of the discrimination threshold. The well-defined SiPM pulses result in turn in well-defined plateaus as shown in the left panel of fig. 5. The transition from one plateau to the following earmarks the corresponding PE amplitude that can be readily identified via the curve derivative as also shown in the figure (green line). To set the (sec. 2), it is necessary to first determine the of each SiPM. To do this, dark-rate curves are measured at different as shown in the middle panel of fig. 5. It can be seen how the PE amplitude, dark rate and crosstalk (ratio between two plateaus) increase when is increased. From these curves, the single PE amplitude as a function of the is obtained, as shown in the right panel of fig. 5. The extrapolation of this curve to 0 (in amplitude) indicates the voltage corresponding to .
Once all 64 are known for all 64 SiPMs, the is roughly adjusted with a Hamamatsu C11204-01 high-voltage source, which sets the same preliminary to all SiPMs. This value is determined by , where is the maximum value of the array of 64 SiPMs and is the desired over-voltage. To compensate for the difference of each SiPM channel, a smooth adjustment per channel is performed with the ASIC which allows setting an individual voltage per channel to ensure the same for all SiPMs. As an example of the impact of the above described procedure, the dark rate curves and the corresponding amplitude histograms are shown in fig. 6, before (top) and after (bottom) the calibration run for (sec. 2). It can be seen that after calibration the curves show less fluctuations, particularly the standard deviation in the amplitude is reduced by a factor of . Therefore the detector response becomes more uniform.
2.2 Temperature compensation
The SiPM dark rate and its PE amplitude depend on temperature (see fig. 8). The dark rate is accounted for by the muon-counting strategy and the time duration of the air shower. In this section, we concentrate on characterizing the temperature impact on the PE amplitude.
Dark-rate curves at different temperatures have been measured in the field with temperature sensors close to the SiPMs (see fig. 7). There is a noticeable shift in the amplitude due to temperature variations since, when temperature increases, the increases accordingly and therefore (along with the SiPM gain) decreases.
Field-temperature changes during the day and year and therefore it is crucial to provide automatic control of so as to maintain constant. By accomplishing this, the SiPM gain would remain stable over time. For the AMIGA detector modules, a temperature compensation mechanism is integrated into the Hamamatsu C11204-01 high voltage source. This mechanism adjusts according to the temperature variation thus compensating for any fluctuations in and, therefore, stabilizing . To study the performance of a compensation mechanism, the gain was estimated repeatedly for more than 8 months. Over periods lasting for approximately one to two weeks, both SiPMs gain and temperature were measured every two hours. The resulting dependence of gain on temperature is displayed in fig. 8 where a temperature correspondence with seasonal changes can be observed. The data points acquired during the coldest months (May and June in the Southern hemisphere) cluster on the left-hand side while on the right-hand side, are those corresponding to the warmest months (January and February). Note that, since the UMC are buried 2.3 m deep, the overall temperature variation is only . The average gain over the entire period was in DAC-counts units. The corresponding gain variation was approximately . Without the compensation, the variation would have been datasheet2. Thus, the compensation mechanism is reducing the gain variations by a factor of 20 (i.e. from to ).
3 Muon reconstruction performance
The two primary tasks of AMIGA UMDs are to count muons and to detect their arrival time. Muon counting can be performed individually muon-by-muon in the counter mode (one-bit electronics) and on a mean-value approach in the integrator mode (charge integration). The counter mode of the read-out electronics produces binary signals relying on the signal amplitude while the integrator mode is based on the total-signal charge.
As SiPMs are located only at a single scintillator-strip edge, it is important to characterize the attenuation of the signal along the scintillator fibers and its impact on the muon-identification efficiency. In the following section, the attenuation of both modes is quantified with laboratory measurements. For this purpose, a dedicated setup was mounted on a test-bench and the analog SiPM waveform pulses were directly acquired with an oscilloscope. The event trigger was performed by a small movable muon telescope and the whole length of the strips was swept in steps of 0.5 m.

3.1 Single-muon reconstruction
The number of PEs in the muon signals both in amplitude and charge as a function of the distance to the SiPM is shown in the top panel of fig. 9. The difference between amplitude and charge attenuations is related to the time distribution of photons reaching the optical sensor: the processes involved in the plastic scintillator as well as in the wavelength-shifter fiber spread photons in time and thus they do not add to the total SiPM pulse amplitude. Therefore, the final amplitude will not be the sum of the individual PE-signal amplitudes (they may be reduced by a factor , see fig. 9 top) whereas the charge of the pulses will not be affected by this time spread since it is integrated over the total pulse timespan. Note that the counter mode is sensitive to the amplitude attenuation (as it implements an amplitude threshold) whereas the integrator mode is sensitive to the charge attenuation. The impact of the attenuation on efficiency to detect muons in the counter mode is shown in the bottom panel of fig. 9. Typically, the SiPM dark rate (with 3 or more PE) surpasses the discriminator threshold for less than 12.5 ns. For this reason, muons are identified when the signal above the discriminator threshold lasts more than . The efficiency loss at the end of the bar is the consequence of the PE attenuation, as signals below the discriminator threshold () are lost. The total efficiency of the and modules is and respectively (the efficiency of the integrator mode has not yet been determined).
3.2 Array reconstruction
As an example of the performance of AMIGA as an array, the reconstruction of the muon lateral distribution reconstruction in an air shower with reconstructed energy of and zenith angle of is shown in fig. 10. Both air shower arrival geometry and energy were obtained from the surface WCD array, SD-750 reconstructionSD. Since the UMC integrator mode is yet to be fully calibrated, muon densities were reconstructed in the counter mode alone. The measured muon densities mueller at each position are shown in the top panel of the figure while the fit to their lateral distribution is seen in the bottom panel. The UMD array of AMIGA is expected to be completed by 2020.
4 Conclusion
Preliminary results of the AMIGA engineering array have been analyzed and shown. A final satisfactory assessment in regard to both UMD construction (mechanics, telecommunications, optoelectronics, counter plus integrator electronics) and data analyses (calibration, temperature compensation, muon reconstruction performance) has been achieved. UMD production phase has started.
References
- (1) The Pierre Auger Collaboration. NIM A 798 (2015).
- (2) A. Etchegoyen for the Pierre Auger Collaboration. 30th International Cosmic Ray Conference 5 (2007).
- (3) The Pierre Auger Collaboration. JINST 11, P02012 (2016).
- (4) D. Renker, E. Lorenz. JINST 4, P04004 (2009).
- (5) The Pierre Auger Collaboration. JINST 12, P03002 (2017).
- (6) Hamamatsu Photonics K.K., MPPC Multi-pixel photon counter, S12572s.
- (7) D. Ravignani, et al. Astropart.Phys 65 (2014).
- (8) The Pierre Auger Collaboration. JCAP 08 (2014)
- (9) S. Müller (Pierre Auger), these proceedings, (2018).