Refractive index matching (RIM) using double-binary liquid-liquid mixturesJournal: Experiments in Fluids
Abstract
Within the last decade microscopic multiphase flows have gained broad interest. An exact understanding of the underlying hydrodynamic interrelations is the key for successful reactor layout and reaction control. To examine the local hydrodynamic behavior, non-invasive optical measurements techniques like particle tracking velocimetry (PTV) or (micro)particle image velocimetry ((µ)PIV) are the method of choice, since they provide precise velocity measurement with excellent spatial resolution. Such optical approaches require refractive index matching (RIM) of the involved flow phases to prevent optical distortion due to light refraction and reflection at the interfaces. Established RIM approaches often provide a single one degree of freedom which is sufficient to match the RI of the flow phases solely. With that, the material properties ( number) are fixed and the relevant dimensionless numbers (, ) may only be altered hydrodynamically or geometrically. To avoid expansive geometric scaling of the microchannels, we propose an approach using two binary mixtures (double-binary mixtures) to introduce an additional degree of freedom. The approach allows examining liquid-liquid two-phase flows at a distinct velocity while being able to change the material combination (-Number). Therefore and can be chosen individually and the RIM provides undisturbed optical access. We present 4 different binary mixtures to be used, e.g. with Taylor droplets. The relevant material parameters are successfully correlated to measurement data, which delivers a system of equations that determines the mass fractions and the velocities to address and individually. A proof-of-principle for the proposed double binary mixture RIM-approach is successfully established using µPIV raw images.
Keywords:
Refractive index matching (RIM) micro particle image velocimetry (µPIV) microscopic multiphase flows1 Introduction and Concept
Microfludic processes using liquid-liquid multiphase flows has gained great interest in the last decades (Zhao and Middelberg 2011; Chou et al 2015; Ahmed et al 2018; Shi et al 2019). The applications range from chemical (Kobayashi et al 2006; Song et al 2006; Kralj et al 2007; Lang et al 2012; Tanimu et al 2017) to biological (Clausell-Tormos et al 2008; Mazutis et al 2013; Chen et al 2014; Wolf et al 2015; Hosokawa et al 2017) and pharmaceutical applications (Kang et al 2014; Piao et al 2015). The large specific surface area in combination with well defined and allegedly easy-to-control flow structures promise a great potential for process intensification. Thus, optimal reactor design and controllability of the flow is key to raise this potential.
Deep insight into the hydrodynamic interaction of the distinct flow phases enables to tune e.g. the mass transfer rates towards more sustainable operation modes close to the optimal working point (Magnaudet and Eames 2000; Ern et al 2012). To achieve this, numerical simulation and CFD-calculations enable relatively easily a parameterized study of e.g. liquid-liquid Taylor flows (Luis A. M. Rocha and João M. Miranda and Joao B. L. M. Campos 2017). Dimensionless numbers (, ) and material property ratios () can be set freely and independently to identify e.g. critical operation modes.
The dimensionless quantities are based on the material parameters of the continuous phase since it provides the wall contact and drives the flow of the disperse phase. The capillary number compares the viscous forces with the interfacial tension forces and it is based on the superficial velocity , the dynamic viscosity of the continuous phase and the interfacial tension . The Reynolds number relates the inertia forces to the viscous forces , where denotes the density of the continuous phase and the diameter of the microchannel. The Ohnesorge number removes the hydrodynamic influences and solely remains as a material parameter. Please note that for macroscopic liquid-liquid flows, the set of dimensionless variables changes with the growing influence of inertia and gravitational forces to , and . Where the Weber number represents the inertia forces compared to the interfacial tension forces. introduces the buoyancy dependence of the flow’s material system (Araújo et al 2012) when combining the Bond number with the Ohnesorge number. Since buoyancy forces are small () in microfluidic applications, we base our RIM system on the number only.
Preferably non-invasive experimental methods need to be applied to investigate the hydrodynamic behavior of liquid-liquid multiphase flows supporting the numerical findings. Even in microchannels, a high spatial resolution of an entire flow field is accessible with e.g. optical measurement techniques (Park and Kihm 2006; Kinoshita et al 2007; Khodaparast et al 2013). However, undistorted optical access is necessary to avoid measurement deviation due to light refraction and reflection.
Often the hardware related refraction effects of the setup can be compensated for adjusting the experimental design e.g. avoiding curved surfaces and using of corrective optics. The curved interfaces of microscopic liquid-liquid flows are commonly counteracted applying refractive index matching with one degree of freedom (Miessner et al 2008; Ma et al 2014; Liu et al 2017). A broad overview of possible liquid-liquid, as well as solid-liquid refractive index matching possibilities, is given in the works of Budwig 1994 and Wright et al 2017. Recently, several approaches have been made using refractive index matched systems to mimic special application cases like specific rheology for blood (Najjari et al 2016; Brindise et al 2018), high-density differences or for a buoyant jet (Clément et al 2018; Krohn et al 2018).
In microscopic liquid-liquid flows RIM with one degree of freedom allows matching the RI of one phase solely to the other. The material system of the phases like density, viscosity and interfacial tension are fixed for the desired RI. The governing dimensionless numbers such as , may only be parameterized hydrodynamically (superficial flow velocity) or geometrically (microchannel diameter). The monetary effort to parameterize the diameter of the microchannel is high, while the velocity alters both quantities simultaneously.
Alternatively, surfactants could be added to change the interfacial tension of the material system solely. Surfactant concentration well below the critical micelle concentration does not significantly change the viscosity of the host phase. Albeit this approach indeed addresses only, the use of surfactants introduces severe effects such as altering the hydrodynamics of the flow as well as its mass transfer properties.
We suggest an approach using two immiscible binary mixtures to match refractive indices (Saksena et al 2015; Cadillon et al 2016), i.e. adding an additional degree of freedom to the system by introducing a binary mixture for each of the liquid phases. The now flexible material system provides an entire range of RI to match the immiscible binary liquid mixtures optically. Hence, the simultaneous velocity related change of and may be compensated for by adequately adapting the material composition of the mixtures ().
We carefully determine the mass fraction dependent material properties of the involved mixtures, establish dedicated correlation functions and provide an optimization algorithm to calculate the necessary information to use this RIM system. A proof of principle is given using µPIV raw-images of two fluorescence particle-seeded microscopic Taylor flows at two and constant at different channel heights.
Recently, the viscosity ratio of both flow phases is reported to influence the local hydrodynamics of microscopic Taylor droplets (Rao and Wong 2018). However, their measurements are limited to a narrow parameter range without refractive index matching (Kovalev et al 2018; Liu et al 2017). Therefore, we suggest four combinations of well quantified double-binary mixtures for the disperse as well as the continuous phase. This allows to additionally alter the viscosity ratio of the flow phases by changing the flow system.
2 Material and Methods
Within this section, the choice of the basic mixture compounds, the experimental procedures to retrieve the properties of the fluids and the numerical approach are described. All measurements are referenced to mass fractions to compensate non-linearities (e.g., excess volume while mixing or when preparing solutions).
2.1 Basic Mixture Compounds
For the binary mixtures of this work, we focused to mainly use nontoxic, non-hazardous, newtonian substances. A wide range of addressable refractive indices is accomplished, when mixing substances if high and and low RI in each phase. The polar phase is chosen to be aqueous for practical reasons. The range of RI of the aqueous binary mixture is defined when using either DMSO or glycerol as newtonian liquid to elevate the RI. The nonpolar phase is based on hexane, as it represents a tradeoff between a lower RI and hazardous properties. The nonpolar binary mixture is complemented by either anisole or sunflower-oil, which establishes a high RI range. Rheometry measurements show, that in the observed range sunflower-oil also behaves newtonian.
Combining the suggested aqueous mixtures properties with the non-polar systems, the viscosity ratio between the phases of the flow can be changed by either inverting the flow phases or changing the combination of the materials. For that reason, we introduce and characterize different binary mixtures for the polar as well as for the non-polar phase. Please note, the viscosity ratio cannot be chosen freely. However, it is possible to choose a ratio below or above unity to investigate the hydrodynamic consequences.
For low viscous mixtures with viscosity ratio below one, we use water/DMSO and n-hexane/anisole, while for high viscosity ratio we propose to apply water/glycerol and n-hexane/sunflower oil.
With these mixtures, we reach a broad range of refractive indices, laying between the pure substance’s RI of n-hexane () and glycerol/DMSO (). The material properties of the binary mixtures (density, viscosity, interfacial tension), as well as the refractive, are given in Sec. 3.
2.2 Determination of material properties
The refractive indices of the used fluids are measured using a Krüss Abbe refractometer AR2008, temperated at 20°C. The refractive indices were measured using a light wavelength of 589 nm (Sodium D1-line) with three independent measurements each. The refractometer uses a liquid film between two prisms to measure the angle of total reflection, from which the refractive index is calculated. For volatile or liquids with low viscosity or low surface tension, no stable film forms between the prisms, which leads to a high deviation. For this reason, the refractive indices of the n-hexane/anisole system for high mass fractions of anisole could not be acquired reliably. Therefore literature data is used.
The interfacial tension of the double binary mixtures is measured using a Lauda TVT drop tensiometer with a syringe of 2.5 ml and a stainless steel capillary at a temperature of 20°C. The interfacial tensions are acquired using the volume drop method: A droplet is formed at a capillary tip. Based on the balance of buoyancy and surface tension the droplet pinches off into the continuous phase. The dispersed droplet is detected with a light barrier and the interfacial tension calculated from the droplet volume.
The interfacial tension is a time-dependent property for nonpure or mixed systems. Thus, as part of the measurement of the dynamic interfacial tension, droplets with differently aged interfacial area are formed. The interfacial tension for infinite time can be derived depending only on bulk diffusion of surface-active substances. Therefore the interfacial tensions are correlated following Wilkinson 1972 and Sinzato et al 2017. Within our work, the droplet formation times and therefore the surface age lie between 2.5 s and 60 s.
The light barrier, that detects the detachment of the ascending droplets, cannot work properly when the refractive indices are matched. Thus, we deliberately detune the mass fraction of the nonpolar phase such, that a sufficient detection difference between the refractive indices of both phases () exists. The droplet detachment, as well as the interfacial tension, are determined at these detuned fluid compositions. The actual interfacial tension for the matched case is then retrieved by linear interpolation using the lever rule. The linear interpolation is considered valid since only the mass fraction of one of both phases is varied and the change in the mass fraction is kept small.
The measurements of the viscosities for the volatile compounds (n-hexane/anisole) are performed using a Malvern Kinexus Ultra Plus with solvent trap, cone-plate setup, 1 degree opening angle and a stationary shear rate table 10 s-1 .. 100 s-1 with 5 % stationarity tolerance. The remaining measurements are performed using a Bohlin Rheometer CS and a 30 ml double-gap system. All measurements were performed at 20°C.
The densities of the mixtures are mostly retrieved from literature data.
2.3 Calculating mass-fractions and the superficial velocity
The main merit of the double-binary mixture flow system is the ability to address different and independently of each other. Keeping in mind the definition of and , this can be stated as an optimization problem with the superficial velocity as the target value. The mass fractions of the continuous phase and disperse phase are the control variable, which influences the material properties.
If the fluid properties for the pure substances as well as for the mixtures are known, and can be calculated. Because the user needs to establish the flow at a distinct and , the equations can be changed such, that the superficial velocity for both numbers is a function of the continuous phase mass fraction :
| (1) |
| (2) |
The problem defines as a minimization problem to find , where the difference of . Depending on the material property function (given in Sec. 3.1), the problem is not necessarily strictly monotonous. Therefore the use of numerical solvers is strictly advised. A working example using fminsearch from MATLAB is given in the supplementary resources. After input of the desired and , this program automatically determines the necessary superficial velocity and mass fraction of both phases. For a minimum residuum of this optimization (), the correct is known as well as the corresponding mass fraction of the continuous phase . The mass fraction of the disperse phase can be calculated via the refractive index of the continuous phase.
3 Experimental Results
Within this section, the material properties of the binary and RI-matched double-binary mixtures are experimentally investigated.
3.1 Properties of binary mixtures
To solve the optimization problem, a solver needs a steady optimization function to work with. However, the measurement data consists of discrete points including a measurement error: A transition of the discrete data sampling to continuous functions is necessary. Thus, we correlate the data with polynomial approaches for simplicity.
The equation for a polynomial function follows
| (3) |
where is the desired property (e.g., density, viscosity or interfacial tension), the mass fraction of the mixture and - fitting coefficients for the polynomial. The polynomial coefficients for the different material properties as well as the experimental data and the range of validity are shown in the following.
At first, the densities of the binary mixtures are investigated in Fig. 1 a) for the polar and in Fig. 1 b) for the nonpolar media. The system water/glycerol shows a nearly linear behavior, while the system water/DMSO shows a peak at approximately . This is caused by nonlinear mixing behavior due to the similarity of water/DMSO and also affects the viscosity. The system n-hexane/anisole shows a nearly linear behavior, while n-hexane/sunflower oil shows a deviation from linearity. The correlations extracted from the measurement and literature data are shown in Tab. 1.


| mixture | range | ||||
|---|---|---|---|---|---|
| water / glycerol | 0 | 0 | 0.2657 | 0.9938 | |
| water / DMSO | -0.1935 | 0.1883 | 0.0958 | 0.9984 | |
| 0.2667 | -0.7371 | 0.6742 | 0.8919 | ||
| hexan / anisole | 0 | 0.129 | 0.2021 | 0.661 | |
| hexan / sunflower oil | 0.0081 | 0.0507 | 0.2025 | 0.6549 |
In Fig. 2 the refractive index of the water/glycerol mixture features a linear behavior (empty squares), while water/DMSO shows a nonlinearity for higher DMSO mass fractions (Fig. 2 a) , triangles). For the nonpolar substances the system n-hexane/sunflower-oil (filled squares) behaves nearly linear, while n-hexane/anisole (filled triangles) increases the slope indicating non-linear dependence (Fig. 2 b) ). For all mixtures, the measurements confirm the available literature data. The correlation coefficients are shown in Tab. 2.


| mixture | ||||
|---|---|---|---|---|
| water / glycerol | 0 | 0.0182 | 0.1232 | 1.3300 |
| water / DMSO | -0.0631 | 0.0834 | 0.1235 | 1.3300 |
| hexan / anisole | 0 | 0.0588 | 0.0790 | 1.3753 |
| hexan / sunflower oil | 0 | 0 | 0.0999 | 1.3753 |
The viscosities of the four binary mixtures are given in Fig. 3. Both of the highly viscous mixtures (water/glycerol Fig. 3 a) and hexane/sunflower-oil Fig. 3 d) ) exhibit similar behavior. As intended, with a higher mass fraction of the more viscous substances, the viscosity rises. The less viscous mixtures water/DMSO (Fig. 3 b) ) and n-hexane/anisole (Fig. 3 c) ) show different behavior. While the viscosity of n-hexane/anisole mixtures increases quadratically with a rising mass fraction of anisole, the viscosity of water/DMSO reaches a peak at . For n-hexane/anisole no own measurements could be performed, since the high evaporation rate of the volatile hexane/anisole mixture leads to a significant deviation in the mass fraction of the mixture during the measurement. Instead, literature data is used. The correlation coefficients are shown in Tab. 3.


| mixture | range | |||||
|---|---|---|---|---|---|---|
| water / glyc. | 0 | 9.6514 | 1.7769 | 1.0095 | ||
| 0 | 0 | 49.223 | -21.944 | 4.5865 | ||
| 0 | 0 | 182.8 | -153.48 | 36.991 | ||
| 0 | 0 | 1272.7 | -1557.1 | 488.84 | ||
| 0 | 10863.4 | -21776.31 | 14652.78 | -3289.78 | ||
| water / DMSO | 0 | 3.6080 | 2.4412 | 1.7748 | 0.8995 | |
| 0 | -11.9506 | 0.4866 | 16.9060 | -4.2424 | ||
| 0 | 130.6611 | -355.8453 | 315.2710 | -88.0846 | ||
| hexan / anisole | 0.7284 | -0.4838 | 0.3969 | 0.1302 | 0.3117 | |
| hexan / sunfl. oil | 0 | 19.1488 | 0.4864 | 0.1616 | 0.3140 | |
| 0 | 1309.0133 | -2622.0800 | 1774.9866 | -399.4200 |
3.2 Properties of RI-matched double-binary mixtures
In addition to the direct properties of the individual binary mixtures that have been discussed in the previous section, the properties of the coupled RI-matched material systems (double-binary mixtures) are discussed in this section. Since the double-binary system consists of four substances, the interfacial tension is influenced independently and possibly nonlinearly by the mass fractions of both binary mixtures. Thus to obtain a manageable experimental effort for the required measurements, the interrelations are linearized and the system is simplified: For the use in RI-matched measurements, only the mass fractions of the matched solution need to be observed. As it is visible in Fig. 4 and 5 this simplifies the problem to two-dimensional problem.
To retrieve the specific mass fractions of both phases for the matched case, the correlations for the RI of both phases are equated and a fit function is numerically retrieved. The behavior of the RI-matched double-binary systems is a combination of the binary mixtures. The results are shown for all double-binary mixture systems in Fig. 4.


The system water/DMSO-hexane/anisole (Fig. 4 (c)) shows the most prominent nonlinear behavior. This is caused by the larger increase of the RI of anisole for elevated anisole mass fractions and the nonlinearity of water/DMSO. For the system water/glycerol-n-hexane/anisole (Fig. 4 (a)) this behavior is as not prominent since the binary mixture water/glycerol in contrast to water/DMSO is nearly linear. As expected from the binary mixture’s behavior, this also holds for the system water/glycerol-hexane/sunflower-oil (Fig. 4 (b)), while again caused by water/DMSO, for water/DMSO-n-hexane/sunflower-oil nonlinearities are present at higher DMSO mass fractions (Fig. 4 (d)). The correlation coefficients for the matched systems are shown in Tab. 4.
| mixture | |||||
|---|---|---|---|---|---|
| water/glycerol - hexane/anisole | -4.599 | 12.318 | -12.348 | 6.632 | -1.237 |
| water/glycerol - hexane/sunfl. oil | 0 | 0 | 0.182 | 1.233 | -0.423 |
| water/DMSO - hexane/anisole | -3.623 | 9.629 | -10.027 | 5.908 | -1.098 |
| water/DMSO - hexane/sunfl. oil | 0 | -0.631 | 0.835 | 1.236 | -0.453 |
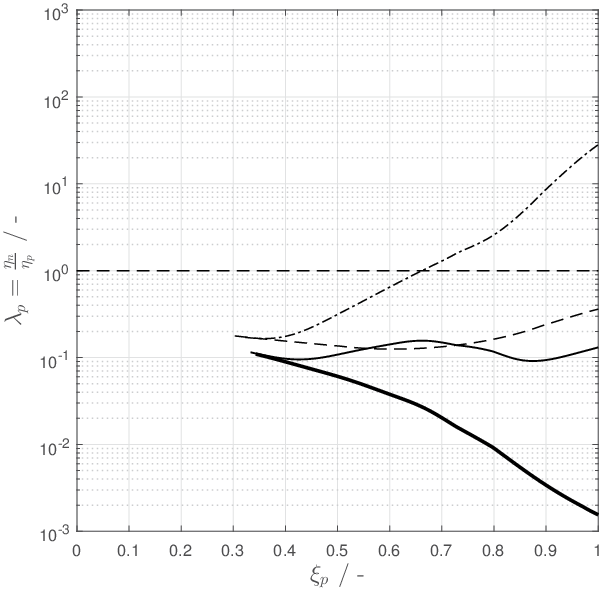
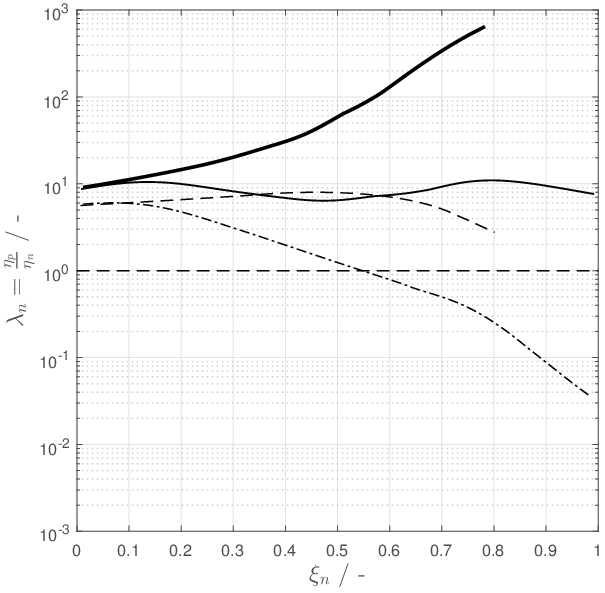
Additionally to the refractive index, the densities, interfacial tension and viscosities for the different matched mass fraction have to be considered for the calculation of the desired dimensionless quantities (, , ). Every matched system consists of two binary mixtures with exactly one RI for the matched case and one specific mass fraction and viscosity for the polar as well as the disperse phase. Changing the mass fraction of one phase, the mass fraction of the other phase needs to be adjusted to keep the RI matching. This changes the viscosity ratio, as it also depends on the ratio of the binary mixtures of each phase.
For the determination of the dimensionless quantities , , of microscopic two-phase flows, especially the viscosity of the continuous phase is important, since it influences the dimensionless quantities the strongest. Therefore the viscosities for the continuous phase of the high viscous systems are shown (Fig. 5).
At first, the polar phase is depicted as the continuous phase, resulting in the graphs of Fig. 5. The combinations with water/glycerol show a broad range of available continuous phase viscosities.


Considering the viscosities of both flow phases, the viscosity ratio of the respective RI-matched material systems can be calculated. The results are shown in Fig. 6 separated for polar and nonpolar continuous phase:
In Addition to the determination of the material properties that depend only on the binary mixtures themselves, also the interfacial tension needs to be described. Since it depends on the forces of the energetic state of the interfacial area, the determination for a quarternary fluid system is complex. For the following measurements, only the interfacial tension of the RI-matched case is of interest. Thus, we only determine values at the mass fractions of the RI-matched interfacial tensions to minimize the experimental effort.
Due to the measurement restrictions (see in Sec. 2.2), we perform the measurements at slightly detuned refractive indices and linearly interpolate the interfacial tension for the matched case between the results. The measurement data, as well as the derived correlations, are shown in Fig. 7.


The interfacial tension between the RI-matched liquids exhibits different behavior for each system. The system water/glycerol- hexane/anisole (Fig. 7 a)) shows an unpredictable interfacial tension development for rising mass fractions of glycerol or anisole. The interpolated values of the single measurements deviate around the correlation function. This is a sign for strong nonlinear interrelations between the four substances. Probably caused by weaker intermolecular forces between glycerol and anisole depending on the composition of the mixture. The system water/glycerol - hexane/sunflower-oil shows a minimum for equivalent fractions of all four substances (, ), while the interfacial tension increases for higher amounts of glycerol or sunflower oil (Fig. 7 b)).
The systems involving water/DMSO expose a decreasing interfacial tension with decreasing mass-fraction of n-hexane. Especially the water/DMSO - hexane/anisole shows a very low interfacial tension for lower mass fractions of hexane (Fig. 7 c)), which is caused by a diminished structural difference to hexane. Water/DMSO - n-hexane/sunflower-oil shows a similar decrease of the interfacial tension (Fig. 7 d)).
The most significant deviations (Fig. 7 a) and b)) are situated in a range of 2 mPas. Please note, that the derived fitting function represents an averaging attempt to describe the complex 4-material-system. Therefore, a deviation between the correlation and the interpolated data of single measurements can be caused by either the linearization or confined effects at distinct mass fractions as well as measurement errors. Since the results of the single measurements are based on at least 20 independent droplets (5 droplets x 4 formation times), we consider possible measurement errors to attribute from diminutive contaminations of the volume tensiometer. The correlation coefficients for the interfacial tension for all four systems are shown in Tab. 5.
| mixture | |||
|---|---|---|---|
| wt./glycerol - hex./anisole | -26.002 | -24.007 | 9.164 |
| wt./glycerol - hex./sunfl. oil | 24.029 | -34.799 | 28.538 |
| wt./DMSO - hex./anisole | 35.627 | -76.700 | 41.824 |
| wt./DMSO - hex./sunfl. oil | 22.616 | -52.398 | 35.929 |
4 Discussion
Based on the material properties of the binary mixtures as well as the double-binary mixtures, which were experimentally determined and successfully modeled with polynomial correlations, we describe the features of the double-binary approach in this section and deliver a proof-of-principle.
4.1 Features and limits of the double-binary approach
The proposed double-binary mixture approach allows tuning the material system of e.g. microscopic Taylor flows with an additional degree of freedom. A two-phase flow can now be RI-matched at a specific individually set of and individually. This is done via a variation of the mass-fraction of both phases , and the superficial velocity . Alternatively, a set of fixed / ratios () at distinct RI can be adjusted, allowing to match the system to a specific reactor material. In this way even complex structures or three phase flows can be observed once the flow is matched to the reactor material. Additionally, the flow can be applied at a specific viscosity of the continuous phase (if fluids with a distinct viscosity should be modeled). A graphical representation of the capabilities is given in Fig. 8.

Based on the conducted measurements and literature data, the proposed double-binary mixture systems are sufficiently described to calculate the relevant dimensionless quantities and for all accessible mass fractions and superficial velocities. These latter two quantities can be calculated by the MATLAB program we supply with the supplementary material. Alternatively, they mass fraction and the superficial velocity can be retrieved graphically from the nomograms presented in Fig. 9. The desired and are chosen on the according axis and the corresponding matched and RI of both phases, as well as the superficial velocity, can be received. The RI determines the mass fractions of both phases (Fig. 4) and the associated viscosity ratio (Fig. 6). Via the continuous phase viscosity (Fig. 5) and the disperse phase viscosity can be determined. Generally, the systems with a high viscous continuous phase (Fig. 9 a) + b)) cover a larger range of possible and , while for the lower viscous continuous phase the parameter range is smaller.


4.2 Proof of Principle
The practicability of the proposed approach for optical measurements and especially the possibility to reach the desired and independently while a matched refractive index is proven in an experimental approach. A microscopic Taylor flow is established at two different numbers while is held constant. The experimental setup to record the PIV raw-images is described in the appendix.
The capability of the double-binary approach and the quality of refractive index matching is evaluated in three measurement planes at two numbers at a steady . Measurements in the symmetry plane (channel center plane), the channel top wall and at an intermediate plane at 0.75 of the channel height are carried out (Fig. 10). In the symmetry plane at the half channel height, distortions arising from non-ideal refractive index matching accumulate and can be quantified. The measurements at the channel top allow classifying, if the flow through the gutters can be measured.


Within the µPIV raw images, the droplet interface is not visible. The raw-images in Fig. 11 show clearly that the droplet length decreases when the focal plane is moved towards the channel top. This is caused by the curvature of the droplet interface. Only the tracer particles in the focal plane are displayed sharp, while particles on other planes out of focus introduce a blurry signal. Thus, the correlations for the refractive index as well as the solver algorithm works well.
Taylor flows were established and recorded without optical distortion. Thus, the proposed double-binary mixture method works well.
5 Conclusion
Within this study, we present and successfully validate a new approach using double-binary mixtures for both immiscible flow phases to establish a refractive index matched microscopic multiphase flows. In comparison to classical mono-binary mixture approaches, and can be addressed individually in a material restricted parameter set, since viscosity and interfacial tension (and thus the different flow forces) do not change in the same order of magnitude if the mass fractions of the phases’ binary mixtures are varied. Alternatively, multiphase flows at different at a fixed can be established to match the reactor material (e.g. simulating three-phase flows via monolith).
Additionally, we introduce two binary mixtures for a polar and nonpolar phase to enable the investigation of e.g., different viscosity ratios or flow systems with simultaneously high or low viscosities are possible too.
Measurements for the relevant material properties (densities, viscosities, refractive index) of the binary mixtures as well as the RI-matched compositions (interfacial tensions) are carried out and compared to literature data to characterize the system. The task to establish multiphase flows at specific and independently is identified as an optimization problem and the material properties as well as the interfacial tension are successfully described with correlations that allow the use of a solver algorithm.
In first measurements, the capability to establish refractive index matched Taylor flows at freely chosen and is proven. This proof of principle is successfully conducted using recorded µPIV raw images. With the proposed double-binary RIM-approach the specific influences on the local velocity of droplets can now be independently examined via optical flow visualization techniques (PTV, PIV).
Appendix
The experimental design follows Fig. 12: A Si-microchannel (manufactured by IMSAS Bremen) with 198 µm nearly rectangular cross-sectional area is located on a Zeiss LSM-210 inverted microscope with a motorized nosepiece and two-axis stage for precision movement. The microscope is controlled via a self-written LabView program using serial port communication.
The microscope is equipped with a Zeiss LD LCI Plan Apochromat 25x/0.8 objective to provide a high spatial resolution at a small depth of field () to receive a high resolution in the z-direction. A pulsed Nd:YAG laser (New Wave Research Solo-PIV III) with a 15 Hz repetition rate, 50 mJ pulse intensity and a pulse length of 3 ns - 5 ns with frequency doubling (wavelength: = 532 nm) serves as a light source for the measurement. Images of the flow are acquired using an active-cooled high quantum-efficient PCO.sensicam qe 670 LD 3078 double CCD-camera with an acquisition rate of 4 Hz at a resolution of 1376 px x 1040 px. The continuous phase is seeded with particles of 1.61 µm particles. The particles are coated with FluoRed as fluorescence dye (excitation peak 530 µm, emission peak 607 µm) and are dispersed in the water/glycerol phase using an ultrasonic bath for 15 min at 20°C.
Two syringe pumps (Dolomite Mitos Duo XS) supply a steady flow such, that the volume flow of both phases can be individually controlled. The excitation light from the pulsed Nd:YAG laser is guided into the Zeiss LSM210 microscope and the laser is widened with a convex lens of short focal length. The illumination is additionally averaged with a holographic diffuser.
A dichroic mirror separates the green excitation light from the red fluorescence light and directs it to the camera. To further improve the cutoff, an additional long-pass filter is mounted in the light-path to shield the camera from laser light (Fig. 12). A timing unit synchronizes the laser and the camera.
An overview of the experimental and optical parameters is given in Tab. 6.
| property | value | unit |
|---|---|---|
| channel width | 198 | µm |
| channel height | 192 | µm |
| excitation wavelength | 532 | nm |
| tracer particle diameter | 1.6 | µm |
| tracer particle CV | 2.3 | % |
| objective magnification | 25 | - |
| objective NA | 0.8 | - |
| objective DOF | 0.859 | µm |
| particle excitation wavelength peak | 530 | nm |
| particle emission wavelength peak | 607 | nm |
| dichroitic mirror cutoff | 552 | nm |
| longpass filter cutoff | 550 | nm |
References
- Ahmed et al (2018) Ahmed I, Akram Z, Bule M, Iqbal H (2018) Advancements and potential applications of microfluidic approaches—a review. Chemosensors 6(4):46, DOI 10.3390/chemosensors6040046
- Al-Jimaz et al (2005) Al-Jimaz AS, Al-Kandary JA, Abdul-latif AHM, Al-Zanki AM (2005) Physical properties of anisole+n-alkanes at temperatures between (293.15 and 303.15) k. The Journal of Chemical Thermodynamics 37(7):631–642, DOI 10.1016/j.jct.2004.09.021
- Araújo et al (2012) Araújo J, Miranda JM, Pinto A, Campos J (2012) Wide-ranging survey on the laminar flow of individual taylor bubbles rising through stagnant newtonian liquids. International Journal of Multiphase Flow 43:131–148, DOI 10.1016/j.ijmultiphaseflow.2012.03.007
- Brindise et al (2018) Brindise MC, Busse MM, Vlachos PP (2018) Density- and viscosity-matched newtonian and non-newtonian blood-analog solutions with pdms refractive index. Experiments in Fluids 59(11):38, DOI 10.1007/s00348-018-2629-6
- Budwig (1994) Budwig R (1994) Refractive index matching methods for liquid flow investigations. Experiments in Fluids 17(5):350–355, DOI 10.1007/BF01874416
- Cadillon et al (2016) Cadillon J, Saksena R, Pearlstein AJ (2016) Transparent, immiscible, surrogate liquids with matchable refractive indexes: Increased range of density and viscosity ratios. Physics of Fluids 28(12):127,102, DOI 10.1063/1.4968512
- Chen et al (2014) Chen Y, Li P, Huang PH, Xie Y, Mai JD, Wang L, Nguyen NT, Huang TJ (2014) Rare cell isolation and analysis in microfluidics. Lab on a chip 14(4):626–645, DOI 10.1039/c3lc90136j
- Chou et al (2015) Chou WL, Lee PY, Yang CL, Huang WY, Lin YS (2015) Recent advances in applications of droplet microfluidics. Micromachines 6(9):1249–1271, DOI 10.3390/mi6091249
- Clausell-Tormos et al (2008) Clausell-Tormos J, Lieber D, Baret JC, El-Harrak A, Miller OJ, Frenz L, Blouwolff J, Humphry KJ, Köster S, Duan H, Holtze C, Weitz DA, Griffiths AD, Merten CA (2008) Droplet-based microfluidic platforms for the encapsulation and screening of mammalian cells and multicellular organisms. Chemistry & Biology 15(5):427 – 437, DOI https://doi.org/10.1016/j.chembiol.2008.04.004, URL http://www.sciencedirect.com/science/article/pii/S1074552108001506
- Clément et al (2018) Clément SA, Guillemain A, McCleney AB, Bardet PM (2018) Options for refractive index and viscosity matching to study variable density flows. Experiments in Fluids 59(2):434, DOI 10.1007/s00348-018-2496-1
- Ern et al (2012) Ern P, Risso F, Fabre D, Magnaudet J (2012) Wake-induced oscillatory paths of bodies freely rising or falling in fluids. Annual Review of Fluid Mechanics 44(1):97–121, DOI 10.1146/annurev-fluid-120710-101250
- González et al (1996) González C, Resa JM, Ruiz A, Gutiérrez JI (1996) Densities of mixtures containing n -alkanes with sunflower seed oil at different temperatures. Journal of Chemical & Engineering Data 41(4):796–798, DOI 10.1021/je960053p
- Hosokawa et al (2017) Hosokawa M, Nishikawa Y, Kogawa M, Takeyama H (2017) Massively parallel whole genome amplification for single-cell sequencing using droplet microfluidics. Scientific reports 7(1):5199, DOI 10.1038/s41598-017-05436-4
- Kang et al (2014) Kang DK, Ali MM, Zhang K, SHuang S, Peterson E, Digman MA, Gratton E, Zhao W (2014) Rapid detection of single bacteria in unprocessed blood using integrated comprehensive droplet digital detection. Nature Communications 5:5427, DOI 10.1038/ncomms6427
- Khodaparast et al (2013) Khodaparast S, Borhani N, Tagliabue G, Thome JR (2013) A micro particle shadow velocimetry (psv) technique to measure flows in microchannels. Experiments in Fluids 54(2):1474, DOI 10.1007/s00348-013-1474-x, URL https://doi.org/10.1007/s00348-013-1474-x
- Kinoshita et al (2007) Kinoshita H, Kaneda S, Fujii T, Oshima M (2007) Three-dimensional measurement and visualization of internal flow of a moving droplet using confocal micro-piv. Lab Chip 7:338–346, DOI 10.1039/B617391H, URL http://dx.doi.org/10.1039/B617391H
- Kobayashi et al (2006) Kobayashi J, Mori Y, Kobayashi S (2006) Multiphase organic synthesis in microchannel reactors. Chemistry, an Asian journal 1(1-2):22–35, DOI 10.1002/asia.200600058
- Kovalev et al (2018) Kovalev AV, Yagodnitsyna AA, Bilsky AV (2018) Flow hydrodynamics of immiscible liquids with low viscosity ratio in a rectangular microchannel with t-junction. Chemical Engineering Journal 352:120–132, DOI 10.1016/j.cej.2018.07.013
- Kralj et al (2007) Kralj JG, Sahoo HR, Jensen KF (2007) Integrated continuous microfluidic liquid-liquid extraction. Lab on a chip 7(2):256–263, DOI 10.1039/b610888a
- Krohn et al (2018) Krohn B, Manera A, Petrov V (2018) A novel method to create high density stratification with matching refractive index for optical flow investigations. Experiments in Fluids 59(4):434, DOI 10.1007/s00348-018-2522-3
- Lang et al (2012) Lang P, Hill M, Krossing I, Woias P (2012) Multiphase minireactor system for direct fluorination of ethylene carbonate. Chemical Engineering Journal 179:330 – 337, DOI https://doi.org/10.1016/j.cej.2011.11.015, URL http://www.sciencedirect.com/science/article/pii/S1385894711013945
- Liu et al (2017) Liu Z, Zhang L, Pang Y, Wang X, Li M (2017) Micro-piv investigation of the internal flow transitions inside droplets traveling in a rectangular microchannel. Microfluidics and Nanofluidics 21(12):180, DOI 10.1007/s10404-017-2019-z, URL https://doi.org/10.1007/s10404-017-2019-z
- Luis A. M. Rocha and João M. Miranda and Joao B. L. M. Campos (2017) Luis A M Rocha, João M Miranda and Joao B L M Campos (2017) Wide range simulation study of taylor bubbles in circular milli and microchannels. Micromachines 8(5):154, DOI 10.3390/mi8050154
- Ma et al (2014) Ma S, Sherwood JM, Huck WTS, Balabani S (2014) On the flow topology inside droplets moving in rectangular microchannels. Lab on a chip 14(18):3611–3620, DOI 10.1039/c4lc00671b
- Magnaudet and Eames (2000) Magnaudet J, Eames I (2000) The motion of high-reynolds-number bubbles in inhomogeneous flows. Annual Review of Fluid Mechanics 32(1):659–708, DOI 10.1146/annurev.fluid.32.1.659
- Mazutis et al (2013) Mazutis L, Gilbert J, Ung WL, Griffiths AD, Heyman JA (2013) Single-cell analysis and sorting using droplet-based microfluidics. Nature Protocols 8:870–891, DOI 10.1038/nprot.2013.046
- Miessner et al (2008) Miessner U, Lindken R, Westerweel J (2008) Velocity measurements in microscopic two-phase flows by means of micro piv. In: Proceedings of the 6th International Conference on Nanochannels, Microchannels and Minichannels - 2008, ASME, New York, NY, pp 1111–1118, DOI 10.1115/ICNMM2008-62093
- Najjari et al (2016) Najjari MR, Hinke JA, Bulusu KV, Plesniak MW (2016) On the rheology of refractive-index-matched, non-newtonian blood-analog fluids for piv experiments. Experiments in Fluids 57(6):1704, DOI 10.1007/s00348-016-2185-x
- Park and Kihm (2006) Park JS, Kihm KD (2006) Three-dimensional micro-ptv using deconvolution microscopy. Experiments in Fluids 40(3):491–499, DOI 10.1007/s00348-005-0090-9
- Piao et al (2015) Piao Y, Han DJ, Azad MR, Park M, Seo TS (2015) Enzyme incorporated microfluidic device for in-situ glucose detection in water-in-air microdroplets. Biosensors and Bioelectronics 65:220 – 225, DOI https://doi.org/10.1016/j.bios.2014.10.032
- R. G. LeBel and D. A. I. Goring (1962) R G LeBel and D A I Goring (1962) Density, viscosity, refractive index, and hygroscopicity of mixtures of water and dimethyl sulfoxide. Journal of Chemical and Engineering Data
- Rao and Wong (2018) Rao SS, Wong H (2018) The motion of long drops in rectangular microchannels at low capillary numbers. Journal of Fluid Mechanics 852:60–104, DOI 10.1017/jfm.2018.521
- Saksena et al (2015) Saksena R, Christensen KT, Pearlstein AJ (2015) Surrogate immiscible liquid pairs with refractive indexes matchable over a wide range of density and viscosity ratios. Physics of Fluids 27(8):087,103, DOI 10.1063/1.4928030
- Shi et al (2019) Shi H, Nie K, Dong B, Long M, Xu H, Liu Z (2019) Recent progress of microfluidic reactors for biomedical applications. Chemical Engineering Journal 361:635–650, DOI 10.1016/j.cej.2018.12.104
- Sinzato et al (2017) Sinzato YZ, Sousa Dias NJ, Cunha FR (2017) An experimental investigation of the interfacial tension between liquid-liquid mixtures in the presence of surfactants. Experimental Thermal and Fluid Science 85:370–378, DOI 10.1016/j.expthermflusci.2017.03.011
- Song et al (2006) Song H, Chen DL, Ismagilov RF (2006) Reactions in droplets in microfluidic channels. Angewandte Chemie International Edition 45(44):7336–7356, DOI 10.1002/anie.200601554, URL https://onlinelibrary.wiley.com/doi/abs/10.1002/anie.200601554, https://onlinelibrary.wiley.com/doi/pdf/10.1002/anie.200601554
- Tanimu et al (2017) Tanimu A, Jaenicke S, Alhooshani K (2017) Heterogeneous catalysis in continuous flow microreactors: A review of methods and applications. Chemical Engineering Journal 327:792 – 821, DOI 10.1016/j.cej.2017.06.161
- Weast (1989) Weast RC (ed) (1989) CRC handbook of chemistry and physics: A ready-reference book of chemical and physical data, 70th edn. CRC Press, Boca Raton
- Wilkinson (1972) Wilkinson M (1972) Extended use of, and comments on, the drop-weight (drop-volume) technique for the determination of surface and interfacial tensions. Journal of Colloid and Interface Science 40(1):14–26, DOI 10.1016/0021-9797(72)90169-5
- Wolf et al (2015) Wolf A, Hartmann T, Bertolini M, Schemberg J, Grodrian A, Lemke K, Förster T, Kessler E, Hänschke F, Mertens F, Paus R, Lerchner J (2015) Toward high-throughput chip calorimetry by use of segmented-flow technology. Thermochimica Acta 603:172 – 183, DOI 10.1016/j.tca.2014.10.021, chip Calorimetry
- Wright et al (2017) Wright SF, Zadrazil I, Markides CN (2017) A review of solid–fluid selection options for optical-based measurements in single-phase liquid, two-phase liquid–liquid and multiphase solid–liquid flows. Experiments in Fluids 58(9):357, DOI 10.1007/s00348-017-2386-y
- Zhao and Middelberg (2011) Zhao CX, Middelberg AP (2011) Two-phase microfluidic flows. Chemical Engineering Science 66(7):1394–1411, DOI 10.1016/j.ces.2010.08.038