Towards a Universal Approach for Identifying Cascading Failures of Power Grids
Abstract
Due to the evolving nature of power systems and the complicated coupling relationship of power devices, it has been a great challenge to identify the contingencies that could trigger cascading blackouts of power systems. This paper aims to develop a universal approach for identifying the initial disruptive contingencies that can result in the worst-case cascading failures of power grids. The problem of contingency identification is formulated in a unified mathematical framework, and it can be solved by the Jacobian-Free Newton-Krylov (JFNK) method in order to circumvent the Jacobian matrix and relieve the computational burden. Finally, numerical simulations are carried out to validate the proposed identification approach on the IEEE Bus System.
Index Terms:
Cascading failures, contingency identification, power grids, JFNK methodI Introduction
The past decades have witnessed several large blackouts in the world such as India Blackout (2012), US-Canada Blackout (2003), Italy Blackout (2003) and Southern Brazil Blackout (1999) to name just a few, which have left millions of residents without power supply and caused huge financial losses [1]. In such catastrophe events, the initial contingencies ( extreme weather, terrorist attack and operator error) play a crucial role in triggering the cascading outage of power systems. It is reported that the mal-operation of a protection relay is the key “trigger” of the final line outage sequence in most blackouts [2]. For instance, conventional relays may lead to unselective tripping under high load conditions, which could initiate the chain reaction of branch outages under certain conditions (e.g., a wrong relay operation of Sammis-Star line in the 2003 US-Canada Blackout [2]). The reliability and resilience of power grids are closely related to the proactive elimination of disruptive initial contingencies. Thus, it is vital to identify the initial contingency that causes the most severe blackouts and work out remedial schemes against cascading blackouts in advance.
In practice, electrical power devices such as FACTS devices, HVDC links and protective relays serve as the major protective barrier against cascading blackouts. To be specific, FACTS devices significantly contribute to the stability improvement of power systems, while HVDC links behave like a “firewall” to prevent the propagation of cascading outages. Actually, the FACTS devices have been widely installed in power transmission networks to improve the capability of power transmission, controllability of power flow, damping of power oscillation and post-contingency stability. As a series FACTS device, the thyristor-controlled series capacitor (TCSC) allows fast and continuous adjustments of branch impedance in order to control the power flow and improve the transient stability [3]. In addition, the HVDC links assist in preventing cascades propagation and restoring the power flow after faults. For example, Québec power system in Canada survived the cascades in the 2003 US-Canada Blackout due to its DC interconnection to the US power systems [2]. As the most common protection device, protective relays of power system react passively to the system oscillation and promptly remove the overloading elements without affecting the normal operation of the rest of the system. Meanwhile it allows for time delay of abnormal oscillations to neglect the trivial disturbances and avoid the overreaction to the transient state changes [4]. It is necessary to take into account the protection mechanism of power devices for the practical cascading process.
So far, cascading failures of power systems have been investigated through two distinct routes. Specifically, some researchers propose rigorous mathematical formulations for exploring vulnerable elements or contingencies in power grids [11, 13], while others focus on the accurate modeling of practical cascading failures [4, 12]. The identification approaches are developed to search for critical branches or initial malicious disturbances that can cause the large-scale disruptions [5, 6, 7, 8, 9, 10, 16]. For instance, the methods are proposed to identify the collections of contingencies based on the event trees [5], line outage distribution factor [6] and other optimization techniques [7, 8, 9]. Nevertheless, these optimization approaches are not efficient to identify the large collections of contingencies that result in cascading blackouts. To address this problem, a “random chemistry” algorithm is designed with the relatively low computational complexity [10]. In addition, an optimal control approach is adopted to identify the initial contingencies by treating these contingencies as the control inputs [16]. And this approach is able to determine the continuous changes of branch admittance other than direct branch outages as the initial contingencies. An adaptive algorithm based on multi-agent system is designed to prevent cascading failures of power grids subject to or contingencies without load shedding [17]. It is suggested that the structural characteristic of communication networks and the interaction between power grids and communication networks are closely related to the ability of power grids to prevent the cascades [18].
This work aims at a rigorous mathematical formulation of identifying the worst-case cascading failures, which is expected to allow for the practical physical characteristics of power system cascades. Compared to existing work, the key contributions of this paper are highlighted as follows
- 1.
Propose a general mathematical formulation for identifying the various contingencies that can trigger the power system cascades and result in the severe disruptions.
- 2.
Develop an efficient numerical algorithm based on the Jacobian-Free Newton-Krylov method to search for the critical contingencies with the guaranteed performance in theory.
- 3.
Validate the proposed approach on a large-scale power grid and investigate the effect of time delay in protective relays on the cascading failures.
The remainder of this paper is organized as follows. Section II presents the cascades model and optimization formulation, followed by the numerical solver and theoretical analysis in Section III. Next, the identification approach is validated in Section IV. Finally, we conclude the paper and discuss future work in Section V.
II Problem Formulation
II-A Cascades Process
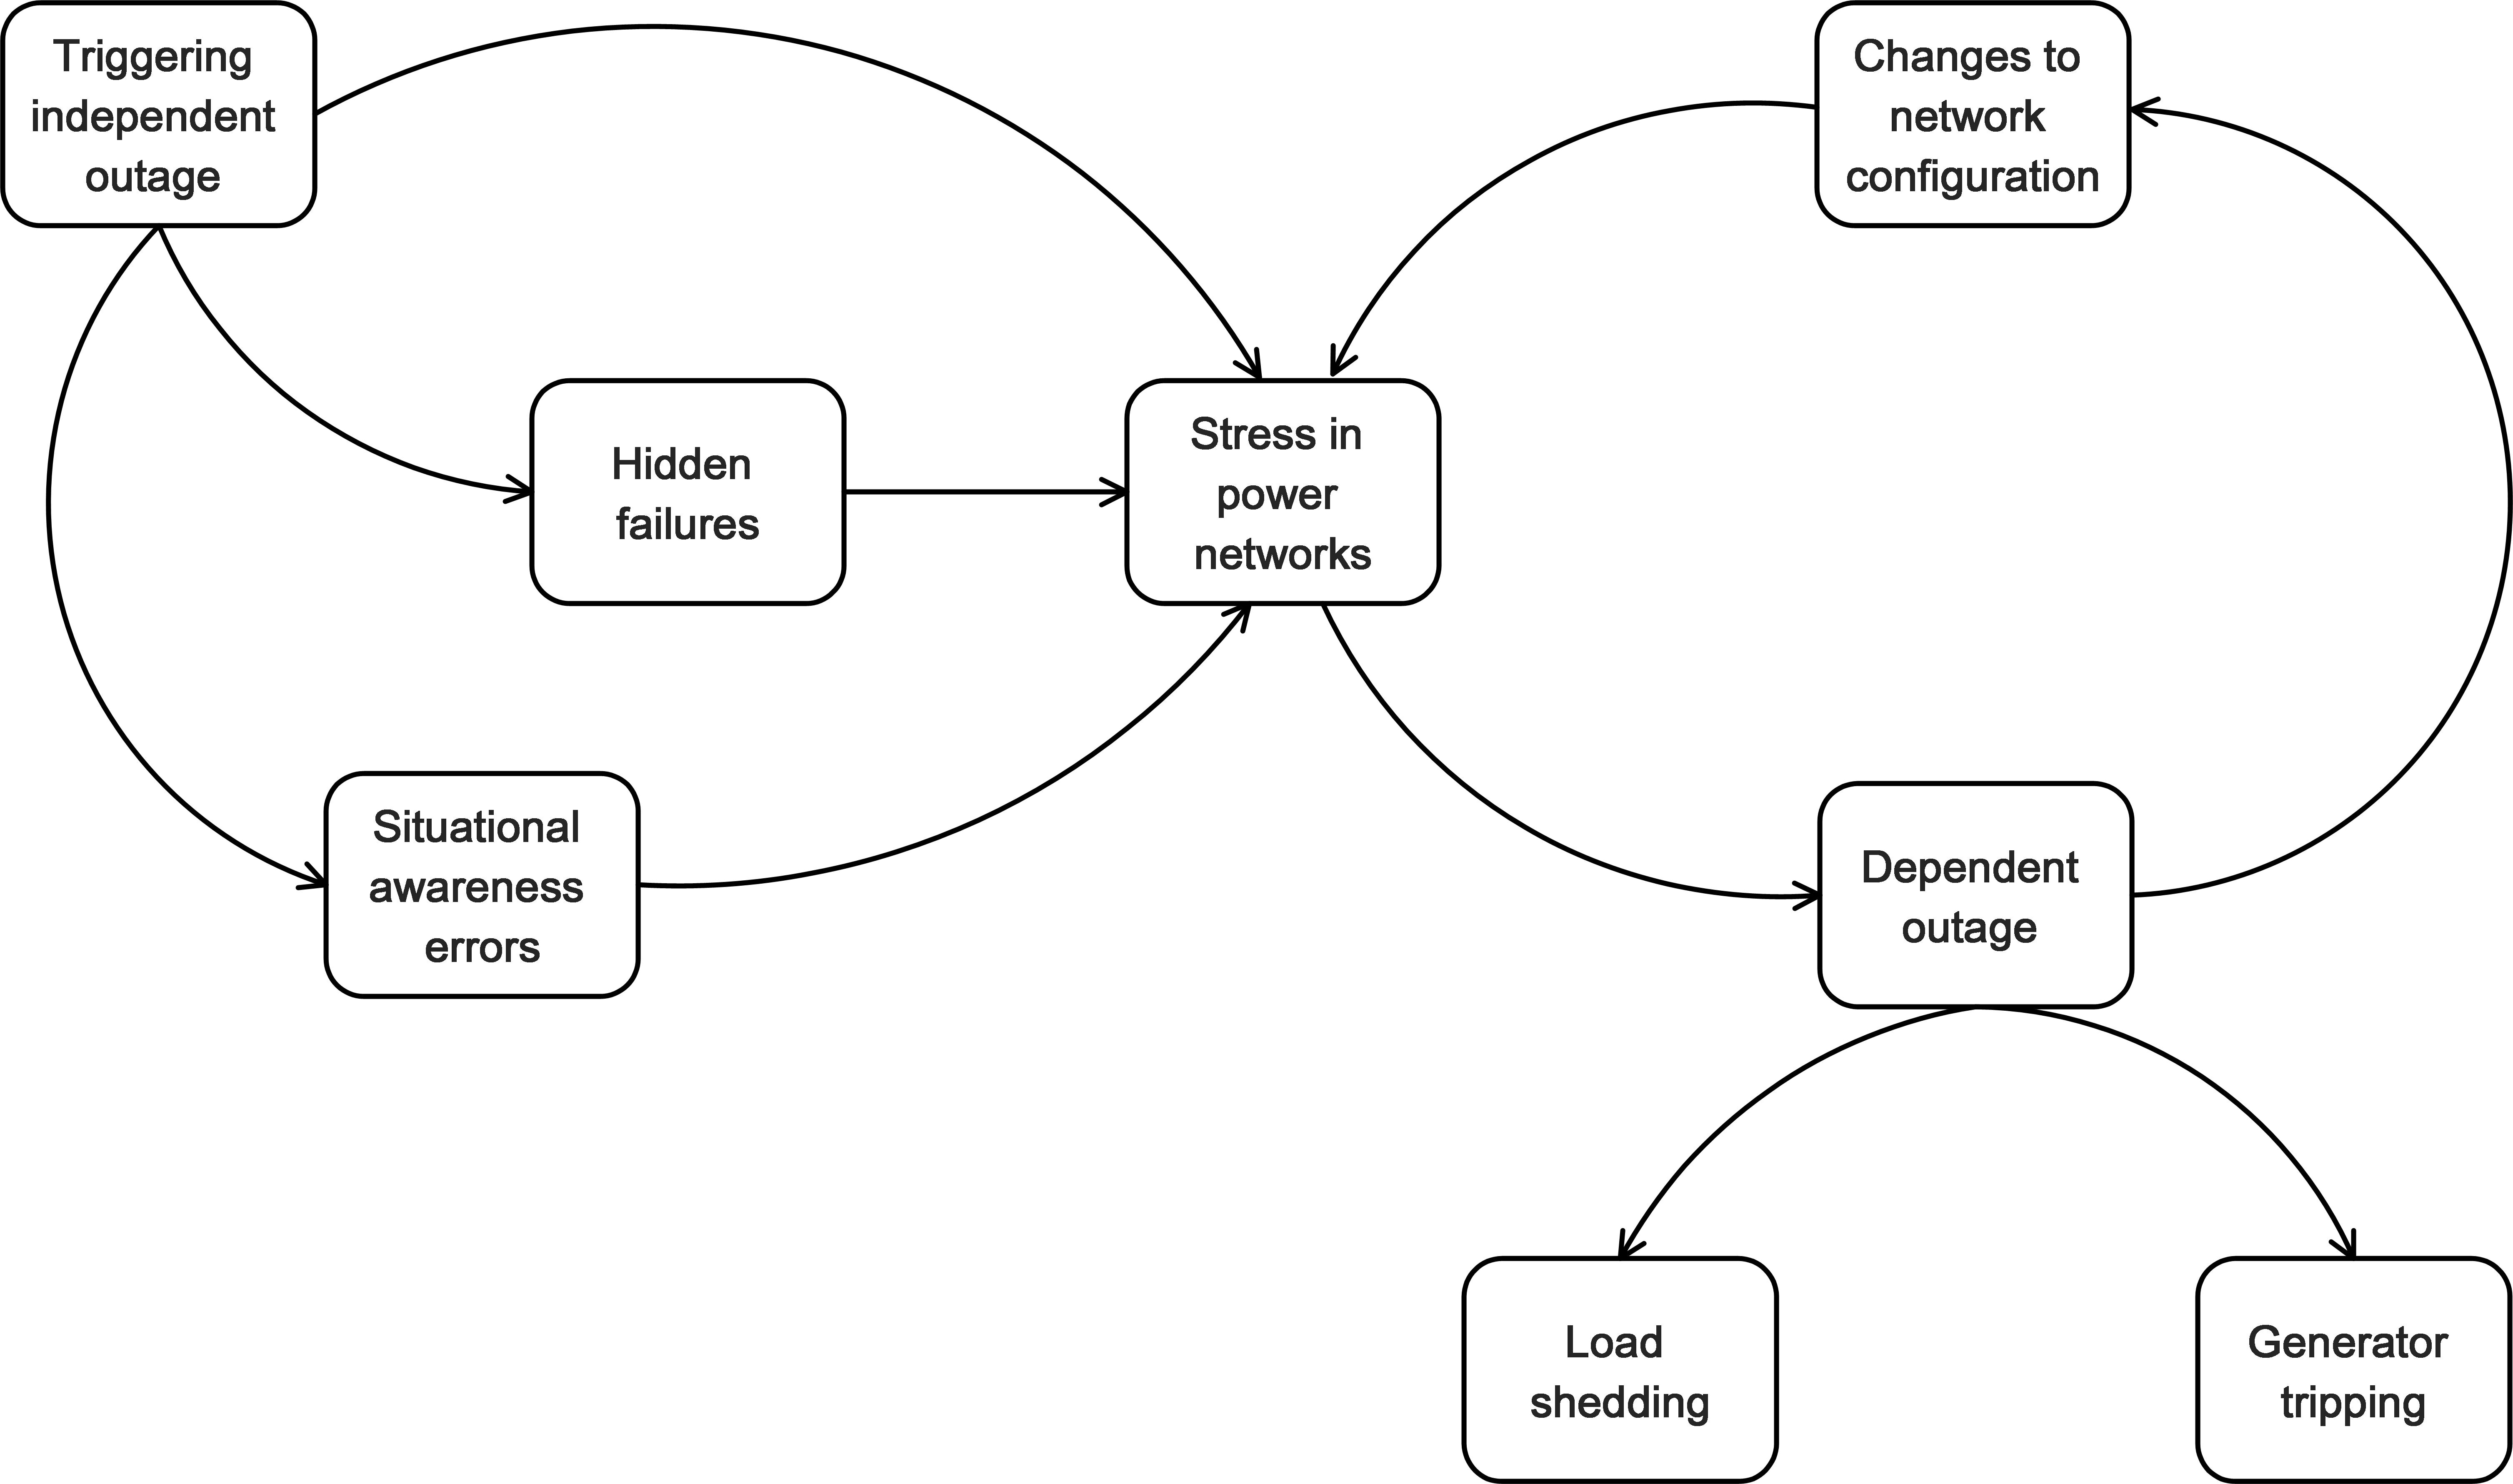
This section aims to characterize the cascading failure of power grids subject to the initial contingency and system stresses. Figure 1 presents the cascading process of power grids after the initial contingency or triggering event is added on the system. Specifically, the initial contingency or triggering event may result in the independent branch outages, which could cause hidden failures in power grids or situational awareness errors of operators in the control center. As a result, the stresses in power networks are aggravated by hidden failures, mis-operations of operators or the independent branch outages directly. Such stresses may give rise to dependent branch outages further and thus force power systems to take protective actions (e.g., load shedding or generator tripping). Moreover, the branch outages change the configuration of power networks (i.e., network topology), which in return aggravates the stress of power networks. Essentially, the above positive feedback process contributes to accelerating the cascading failures and ends up with the power systems blackout.
II-B Mathematical model
In terms of the practical cascades process, it is suggested that dynamic power networks can be modeled as a system of hybrid differential-algebraic equations [4].
| (1) |
where denotes a vector of continuous state variables subject to differential relationships, and represents a vector of continuous state variables under the constraints of algebraic equations. In addition, refers to a vector of discrete binary state variables (i.e., ). The set of differential equations in the system (1) characterize the dynamic response of machines, governors, exciters and loads in power grids. The algebraic components mainly describe the AC power flow equations, and the inequality terms reflect the discrete events (e.g., the automatic line tripping by protective relays, manual operations, lightning, etc) during cascading failures. In practice, the structure of power grids (e.g., network topology, component parameters) is affected once a discrete event occurs. Thus, the discrete events directly influence the dynamic response of relevant devices and the distribution of power flow in power grids. To incorporate the effect of discrete events at time instants , the time axis is divided into a series of time intervals , . At each time interval, the set of differential-algebraic equations is solved using the updated parameters and initial conditions of power system model due to discrete events. By solving the system (1) in each time interval, the vectors of state variables and at the terminal of each time interval can be obtained as follows
| (2) |
where , and , . And the iterated functions and describe the evolution process of state variables and , respectively.
II-C Optimization formulation
The cascading blackouts result in the severe damage of power networks and paralyze the service of power supply. Our goal is to search for the initial contingencies that cause the worst disruptions of power grids at the end of cascading blackouts. Therefore, the problem of identifying initial contingencies in power grids is formulated as
| (3) |
where denotes the initial contingencies in power grids that change the state variables , or in the initial time interval . And represents the set of physical constraints on the initial contingencies, and it can be described as with the inequality constraints . For simplicity, it is assumed that the triggering event or initial contingency occurs at time . Then we have , and the function characterizes the effect of the contingency on the state variables at time .
The objective function quantifies the disruptive level of power grids at the end of cascading failures. A smaller value of indicates a worse disruption of power grids due to cascading blackouts. Then it follows from the Karush-Kuhn-Tucker (KKT) conditions that the necessary conditions for optimal solutions to Optimization Problem (3) is presented as follows [22].
Proposition II.1.
The optimal solution to Optimization Problem (3) with the multipliers , satisfies the KKT conditions
| (4) |
where and , are the unknown variables.
Proof.
The KKT conditions for Optimization Problem (3) are composed of four components: stationary, primal feasibility, dual feasibility and complementary slackness. Specifically, stationary condition allows us to obtain
where
Moreover, the primal feasibility leads to , , which can be converted into equality constraints
with the unknown variables . Further, the dual feasibility corresponds to , which can be replaced by
with the unknown variables . Finally, the complementary slackness gives
This completes the proof. ∎
Remark II.1.
To reduce the computation burden, the gradient can be approximated by
| (5) |
with the sufficiently small and the unit vector with in the -th position and elsewhere. And the symbol denotes the dimension of the variable .
III Numeric Solver
To avoid the computation of partial derivatives in (5), the Jacobian Free Newton Krylov (JFNK) method is employed in this section to solve the system of nonlinear algebraic equations without computing the Jacobian matrix. Essentially, the JFNK methods are synergistic combinations of Newton methods for solving nonlinear equations and Krylov subspace methods for solving linear equations [23]. To facilitate the analysis, the system (4) is rewritten in matrix form
| (6) |
where the unknown vector is composed of , , , , . And refers to a zero vector with the proper dimension. To obtain the iterative formula for solving (6), the Taylor series of at is computed as follows
| (7) |
with . By neglecting the high-order term and setting , we obtain
| (8) |
where represents the Jacobian matrix and denotes the iteration index. Thus, solutions to Equation (6) can be approximated by implementing Newton iterations , where is obtained by Krylov methods. First of all, the Krylov subspace is constructed as follows
| (9) |
with , where is the initial guess for the Newton correction and is typically zero [23]. Actually, the optimal solution to is the linear combination of elements in Krylov subspace .
| (10) |
where , is obtained by minimizing the residual with the Generalized Minimal RESidual (GMRES) method with the constraint of step size [24]. In particular, matrix-vector products in (10) can be approximated by
| (11) |
where is a sufficiently small value [25]. In this way, the computation of Jacobian matrix is avoided via matrix-vector products in (11) while solving Equation (6). Actually, the accuracy of the forward difference scheme (11) can be estimated as follows.
Proposition III.1.
where denotes the second order derivative of with respect to the variable .
Proof.
Remark III.1.
| Initialize: , , , and |
| Goal: and |
| 1: for to |
| 2: |
| 3: while () |
| 4: Calculate the residual |
| 5: Construct the Krylov subspace in (9) |
| 6: Approximate in (10) using (11) |
| 7: Compute in (10) with the GMRES method |
| 8: Compute with (10) |
| 9: |
| 10: |
| 11: |
| 12: end while |
| 13: Update and |
| 14: if |
| 15: |
| 16: end if |
| 17: |
| 18: end for |
Table I presents the implementation process of Contingency Identification Algorithm (CIA) with the aid of the JFNK method. First of all, the initial values for some variables are specified as follow: and , , with the condition , and the maximum iterative step . Then the JFNK method is employed to obtain the optimal disturbance and the cost from Step to Step . Specifically, the residual is calculated in each iteration in order to construct the Krylov subspace . For elements in , the matrix-vector products are approximated by Equation (11) without forming the Jacobian. Next, the term for Newton iterations is obtained via the GMRES method. The tolerance and step number are updated after implementing the Newton iteration for . Afterwards, a new iteration loop is launched if the termination condition fails. After adopting the JFNK method, a disturbance value in (4) is saved if it results in a worse cascading failure (, ). The above algorithm does not terminate until the maximum iterative step is reached.
The following theoretical results allow us to roughly estimate the convergence accuracy of initial disturbances before implementing the CIA.
Proposition III.2.
With the Contingency Identification Algorithm in Table I, the increment is upper bounded by
where denotes the initial value for the unknown vector in the numerical algorithm, and refers to the maximum iteration steps.
Proof.
According to the Contingency Identification Algorithm, we have the following inequality
after adopting the JFNK method. In addition, it follows from the updating law that , which allows us to obtain
due to and . Moreover, it follows from that we have
which completes the proof. ∎
Remark III.2.
According to the CIA in Table I, the value of cost function decreases monotonically as the iteration step increases. Considering that is normally designed to have a lower bound (i.e., ), converges to a local minimum. This enables us to identify the corresponding initial disturbances .
IV Case Study
In this section, the proposed CIA in Table I is implemented to search for the disruptive disturbances on selected branches of IEEE 118 Bus System [28]. Numerical results on disruptive disturbances are validated by disturbing the selected branch with the magnitude of disturbance identified by the CIA.
IV-A Cascades model
In the simulations, a simple cascades model is taken into account and it includes FACTS devices, HVDC links and protective relays. The mathematical descriptions of these components are presented in the Appendix. In addition, the DC power flow equation is employed to ensure the computational efficiency and avoid the numerical non-convergence [4]. When power grids are subject to the malicious disturbances, the FACTS devices take effect to adjust the branch admittance and balance the power flow for relieving the stress of power networks. If the stress is not eliminated, protective relays will be activated to serve the overloading branches on the condition that the timer of circuit breakers runs out of the preset time. The outage of overloading branches may result in the severer stress of power transmission networks and end up with the cascading blackout. The evolution time of cascading failure is introduced to allow for the time factor of cascading blackouts. Essentially, the time interval between two consecutive cascading steps basically depends on the preset time of the timer in protective relays [4]. Thus, the evolution time of cascading failure is roughly estimated by at the -th cascading step.
IV-B Parameter setting
Per-unit system is adopted with the base value of MVA in numerical simulations, and the power flow threshold for each branch is larger than the normal power floe on each branch without any disturbances. The power flow on each branch is close to the saturation, although it does not exceed their respective thresholds. In this way, the power system is vulnerable to initial contingencies, and thus is likely to suffer from cascading blackouts. The cost function in (3) is designed as to minimize the total power flow on branches by identifying the initial disturbance . Here represents the vector of power flow on branches. and denote the vector of injected power on buses and that of branch admittance at the end of cascading failure, respectively. The maximum iterative step is equal to in the CIA. Other parameters are given as follows: in Equation (5), in the JFNK method. Branch (i.e., the red link connecting Bus to Bus in Fig. 2) is randomly selected as the disturbed element of power transmission networks. The lower and upper bounds of initial disturbances on Branch are given by and , respectively. Actually, the upper bound of initial disturbances directly leads to the branch outage. And the total number of cascading steps is . For simplicity, we specify the same values for the parameters of three HVDC links as follows: , and . Regarding the FACTS devices, we set , and for the TCSC, and , and for the PID controller. In addition, the reference power flow is equal to the threshold of power flow on the relevant branch.
IV-C Simulation and validation
Figure 2 shows the initial state of IEEE 118 Bus System in the normal condition, and this power system includes 53 generator buses, 64 load buses, 1 reference bus (i.e., Bus ) and 186 branches. And the HVDC links are denoted by blue lines, which include Branch 4 connecting Bus to Bus , Branch connecting Bus to Bus and Branch connecting Bus to Bus . Two preset values of the timer are taken into consideration in protective relays, , s and s. Contingency Identification Algorithm is carried out to search for the disturbance that results in the worst-case cascading failures of power systems (i.e., the minimum value of cost function ). For the IEEE 118 Bus System without the FACTS devices, the computed magnitude of disturbance on Branch is , which exactly leads to the outage of Branch 8. For the power system with the FACTS devices and the preset time of the timer s, the disturbance magnitude identified by the CIA is , while it is for s.
Next, we validate the proposed identification approach by adding the computed disturbances on Branch 8 of IEEE Bus Systems. Specifically, Figure 3 demonstrates the final state of IEEE 118 Bus System with no FACTS devices and with the preset time of circuit breaker s. The cascading process terminates with 95 outage branches and the value of cost function is after 16 seconds, and the system collapses with 42 islands in the end. These 42 islands include isolated buses and subnetworks encircled by the dashed lines. In contrast, Figure 4 presents the final configuration of IEEE 118 Bus Systems with the protection of the FACTS devices and with the preset time s. The cascading process ends up with 40 outage branches and the value of cost function is after 10 seconds, and the power system is separated into islands, which include subnetworks and isolated buses. Figure 5 gives the final state of power systems with FACTS devices and s. It is observed that the power network is eventually split into islands (Bus 14, Bus 16 and a subnetwork composed of all other buses) with only outage branches and the cost function of . Note that the initial disturbances identified by the CIA fail to cause the outage of Branch in the end for both s and s. The above simulation results demonstrate the advantage of the FACTS devices in preventing the propagation of cascading outages. A larger preset time of timer enables the FACTS devices to sufficiently adjust the branch admittance in response to the overload stress. As a result, the less severe damages are caused by the contingency for the larger preset time of timer.
Figure 6 presents the time evolution of branch outages in the IEEE 118 Bus System as a result of disturbing Branch in three different scenarios. The cyan squares denote the number of outage branches with no FACTS devices and s, while the green and blue ones refer to the numbers of outage branches with the FACTS devices and with s and s, respectively. The disturbances identified by the CIA are added to change the admittance of Branch at s. With no FACTS devices, the cascading outage of branches propagates quickly from s to s and terminates at s. When the FACTS devices are adopted and the preset time of timer is s, the cascading failure starts at s and speeds up till s and stops at s. For s, the cascading outage propagates slowly due to the larger preset time of timer and comes to an end with only outage branches at s. Together with protective relays and HVDC links, the FACTS devices succeed in protecting power systems against blackouts by adjusting the branch impedance in real time. More precisely, the number of outage branches decreases by with FACTS devices and s and decreases by with FACTS devices and s.
V Conclusions
In this paper, we investigated the problem of identifying the initial contingencies that lead to cascading blackout of power transmission networks equipped with FACTS devices, HVDC links and protective relays. A universal optimization formulation was proposed to identify the contingencies, and an efficient numerical method was presented to solve the optimization problem. Numerical simulations were carried out on the IEEE 118 Bus Systems to validate the proposed identification approach. Significantly, the proposed contingency identification algorithm allows us to detect some nontrivial disturbances that lead to the severe cascading failure of power transmission networks, other than directly severing the branch. It is demonstrated that the coordination of FACTS devices and protective relays greatly enhances the capability of power grids against blackouts. Future work may include the comparison of different cascades models and the validation of the identified disturbances with real data in power system blackouts.
Acknowledgment
This work is partially supported by the Future Resilience System Project at the Singapore-ETH Centre (SEC), which is funded by the National Research Foundation of Singapore (NRF) under its Campus for Research Excellence and Technological Enterprise (CREATE) program. It is also supported by Ministry of Education of Singapore under Contract MOE2016-T2-1-119.
Appendix: Component Models
V-A FACTS devices
FACTS devices can greatly enhance the stability and transmission capability of power systems. As an effective FACTS device, TCSC has been widely installed to control the branch impedance and relieve system stresses. The dynamics of TCSC is described by a first order dynamical model [19]
| (12) |
where refers to its reference reactance of Branch for the steady power flow. and are the lower and upper bounds of the branch reactance respectively and represents the supplementary control input, which is designed to stabilize the disturbed power system [20]. For simplicity, PID controller is adopted to regulate the power flow on each branch
| (13) |
where , and are tunable coefficients, and the error is given by
Here, and denote the reference power flow and the actual power flow on Branch , respectively. Note that TCSC fails to function when the transmission line is severed.
V-B HVDC links
HVDC links work as a protective barrier to prevent the propagation of cascading outages in practice, and it is normally composed of a transformer, a rectifier, a DC line and an inverter. Actually, the rectifier terminal can be regarded as a bus with real power consumption , while the inverter terminal can be treated as a bus with real power generation . The direct current from the rectifier to the inverter is computed as follows [21]
where denotes the ignition delay angle of the rectifier, and represents the extinction advance angle of the inverter. and refer to the equivalent communicating resistances for the rectifier and inverter, respectively. Additionally, denotes the resistance of the DC transmission line. Thus the power consumption at the rectifier terminal is
| (14) |
and at the inverter terminal is
| (15) |
Note that and keep unchanged when and are fixed.
V-C Protective relay
The protective relays are indispensable components in power systems protection and control. When the power flow exceeds the given threshold of the branch, the timer of circuit breaker starts to count down from the preset time [4]. Once the timer runs out of the preset time, the transmission line is severed by circuit breakers and its branch admittance becomes zero. Specifically, a step function is designed to reflect the physical characteristics of branch outage as follows
where is the preset time of the timer in protective relays, and denotes the counting time of the timer. In addition, denotes the power flow on Branch with the threshold .
References
- [1] J. McLinn, “Major Power Outages in the US, and around the World,” Annual Technology Report of IEEE Reliability Society, 2009.
- [2] B. Günther, D. Povh, D. Retzmann, and E. Teltsch, “Global blackouts-Lessons learned,” Power-Gen Europe, 28(30), 2005.
- [3] D. Jovcic, and G. N. Pillai, “Analytical modeling of TCSC dynamics,” IEEE Transactions on Power Delivery 20(2): 1097-1104, 2005.
- [4] J. Song, et al, Dynamic modeling of cascading failure in power systems. IEEE Transactions on Power Systems, 31(3): 2085-2095, 2016.
- [5] Q. Chen and J. McCalley, “Identifying high risk n-k contingencies for online security assessment,” IEEE Trans. Power Syst., vol. 20, no. 2, pp. 823-834, May 2005.
- [6] C. M. Davis and T. J. Overbye, “Multiple element contingency screening,” IEEE Trans. Power Syst., vol. 26, no. 3, pp. 1294-1301, Aug. 2011.
- [7] V. Donde, V. Lopez, B. Lesieutre, A. Pinar, C. Yang, and J.Meza, “Severe multiple contingency screening in electric power systems,” IEEE Trans. Power Syst., vol. 23, no. 2, pp. 406¨C417, May 2008.
- [8] D. Bienstock and A. Verma, “The n-k problem in power grids: New models, formulations, and numerical experiments,” SIAM J. Optimiz., vol. 20, no. 5, pp. 2352¨C2380, 2010.
- [9] C. Rocco, J. Ramirez-Marquez, D. Salazar, and C. Yajure, “Assessing the vulnerability of a power system through a multiple objective contingency screening approach,” IEEE Trans. Reliab., vol. 60, no. 2, pp. 394¨C403, 2011.
- [10] M. J. Eppstein, and P. D. Hines, “A ¡°random chemistry¡± algorithm for identifying collections of multiple contingencies that initiate cascading failure,” IEEE Transactions on Power Systems, vol. 27, no. 3, pp. 1698-1705, 2012.
- [11] M. R. Almassalkhi, and I. A. Hiskens, “Model-predictive cascade mitigation in electric power systems with storage and renewables-Part I: Theory and implementation,” IEEE Transactions on Power Systems, 30(1), 67-77, 2015.
- [12] J. Yan, Y. Tang, H. He, and Y. Sun, Cascading failure analysis with DC power flow model and transient stability analysis. IEEE Transactions on Power Systems, 30(1), 285-297, 2015.
- [13] K. Taedong, S. J. Wright, D. Bienstock, and S. Harnett, “Analyzing vulnerability of power systems with continuous optimization formulations,” IEEE Transactions on Network Science and Engineering 3(3): 132-146, 2016.
- [14] P. D. Hines, and P. Rezaei, Cascading failures in power systems, Smart Grid Handbook, pp. 1-20, 2016.
- [15] G. W. Stagg, and A. H. El-Abiad., Computer Methods in Power System Analysis, McGraw-Hill, 1968.
- [16] C. Zhai, H. Zhang, G. Xiao and T. Pan, “Modeling and identification of worst cast cascading failures in power systems,” arXiv preprint at https://arxiv.org/abs/1703.05232.
- [17] A. A. Babalola, R. Belkacemi, and S. Zarrabian, “Real-time cascading failures prevention for multiple contingencies in smart grids through a multi-agent system,” IEEE Transactions on Smart Grid, 9(1): 373-385, 2018.
- [18] Y. Cai, Y. Cao, Y. Li, T. Huang, and B. Zhou, “Cascading failure analysis considering interaction between power grids and communication networks,” IEEE Transactions on Smart Grid, 7(1): 530-538, 2016.
- [19] J. Paserba, et al, “A thyristor controlled series compensation model for power system stability analysis,” IEEE Transactions on Power Delivery, 10(3): 1471-1478, 1995.
- [20] K. M. Son, and Jong K. Park, “On the robust LQG control of TCSC for damping power system oscillations,” IEEE Transactions on Power Systems, 15(4): 1306-1312, 2000.
- [21] P. Kundur, N. J. Balu, and M. G. Lauby. Power system stability and control, Vol. 7, New York: McGraw-hill, 1994.
- [22] O. L. Mangasarian, Nonlinear programming, SIAM, 1994.
- [23] D. A. Knoll, and D. E. Keyes, “Jacobian-free Newton-Krylov methods: a survey of approaches and applications,” Journal of Computational Physics, 193(2): 357-397, 2004.
- [24] Y. Saad, and H. S. Martin, “GMRES: A generalized minimal residual algorithm for solving nonsymmetric linear systems,” SIAM Journal on Scientific and Statistical Computing, 7(3): 856-869, 1986.
- [25] P. N. Brown, and Y. Saad, “Hybrid Krylov methods for nonlinear systems of equations,” SIAM Journal on Scientific and Statistical Computing, 11(3): 450-481, 1990.
- [26] J. M. Ortega, and W. C. Rheinboldt, Iterative Solution of Nonlinear Equations in Several Variables, SIAM, Philadelphia, 2000
- [27] T. F. Chan, K. R. Jackson, Nonlinearly preconditioned Krylov subspace methods for discrete Newton algorithms, SIAM J. Sci. Stat. Comput. 5 (1984) 533¨C542.
- [28] R. D. Zimmerman, C. E. Murillo-Sánchez, and R. J. Thomas, “Matpower: Steady-state operations, planning and analysis tools for power systems research and education,” IEEE Transactions on Power Systems, vol. 26, no. 1, pp. 12-19, Feb. 2011.
| Chao Zhai |
| Gaoxi Xiao |
| Hehong Zhang |
| Tso-Chien Pan |