The Dependence of Convective Core Overshooting on Stellar Mass:
Reality Check, and Additional Evidence
Abstract
Overshooting from the convective cores of stars more massive than about 1.2 has a profound impact on their subsequent evolution. And yet, the formulation of the overshooting mechanism in current stellar evolution models has a free parameter ( in the diffusive approximation) that remains poorly constrained by observations, affecting the determination of astrophysically important quantities such as stellar ages. In an earlier series of papers we assembled a sample of 37 well-measured detached eclipsing binaries to calibrate the dependence of on stellar mass, showing that it increases sharply up to a mass of roughly 2 , and remains constant thereafter out to at least 4.4 . Recent claims have challenged the utility of eclipsing binaries for this purpose, on the basis that the uncertainties in from the model fits are typically too large to be useful, casting doubt on a dependence of overshooting on mass. Here we reexamine those claims and show them to be too pessimistic, mainly because they did not account for all available constraints — both observational and theoretical — in assessing the true uncertainties. We also take the opportunity to add semi-empirical determinations for 13 additional binaries to our previous sample, and to update the values for 9 others. All are consistent with, and strengthen our previous conclusions, supporting a dependence of on mass that is now based on estimates for a total of 50 binary systems (100 stars).
Subject headings
stars: evolution; stars: interiors; stars: core overshooting; stars: eclipsing binariesI. Introduction
In recent years there has been a resurgence of interest in the phenomenon of convective core overshooting in stars. Empirical constraints of different kinds have been brought to bear on the problem of calibrating the free parameters of the two most often used prescriptions for overshooting, which are for the classical step-function implementation, and for the diffusive approximation (Freytag et al. 1996; Herwig et al. 1997). In the classical formulation the extension of the core beyond the boundary set by the Schwarzschild criterion is , whereas in the alternate prescription the mixing is modeled as a diffusive process with a diffusion coefficient at a radial distance from the boundary given by , in which is the coefficient inside the boundary and the pressure scale height. In a series of papers over the last three years (Claret & Torres 2016; Claret & Torres 2017; Claret & Torres 2018, hereafter Paper I, Paper II, and Paper III) we employed a total of 37 double-lined eclipsing binaries (DLEBs) with well-measured masses, radii, effective temperatures, and in some cases metallicities, to examine the dependence of the strength of overshooting on stellar mass. The measurements were compared against current stellar evolution models to infer semi-empirical values for the overshooting parameter for each star.
It was found that and increase sharply starting at 1.2 to a maximum at 2 , after which they show little or no change up to the 4.4 limit of our sample. The peak value for is about 0.016. The mass behavior was found to be independent of the element mixtures we tested (Grevesse & Sauval 1998; Asplund et al. 2009), and was qualitatively the same for and , except for a scaling factor between the two of (Paper II).
In recent work Constantino & Baraffe 2018 (hereafter CB2018) have revisited the issue with the goal of assessing the degree to which observations for DLEBs constrain the overshooting parameter. They focused specifically on , and selected a subsample of eight of our binaries for their experiments, which they considered to be representative of the range of stellar masses and evolutionary states of the parent population. Their modeling led them to claim that in most cases the range of values permitted by the observations is very large (often the full interval they explored, typically –0.040), such that it is very difficult to discern any dependence at all on stellar mass. They concluded therefore that the method of using DLEBs for this type of calibration is of limited utility. Overall they found that a constant value of the overshooting parameter around 0.013 or 0.014 seems adequate to fit all eight of the systems they studied, given that they have such large uncertainties. Values of of this order would be consistent with the degree of overshooting we found in our previous work for masses larger than about 2 (Paper II, Paper III), but not for lower mass stars.
Intrigued by the CB2018 claims that seem to conflict with our own experience, as a first goal we set out here to examine their results more closely, and to repeat their experiments following their grid-based approach to the extent possible. We depart from their basic procedure only in that we use the same stellar evolution models and physical ingredients that we employed in our previous series of papers, to ensure consistency with our earlier results. To our surprise we find significant disagreements with CB2018 for most of the systems, which in some cases may be explained by the differences in the models. Furthermore, we believe their assessments are overly pessimistic in part because they did not consider other available constraints, some empirical and some rooted in theory, that significantly reduce the formal uncertainties in for some systems. In particular, we review physical arguments that set a maximum size for the convective cores of stars in the low- and intermediate-mass regime (), effectively making values of as large as some of those proposed by CB2018 unrealistic. We believe these arguments, along with our own grid experiments for the eight binaries studied by CB2018, show that in many cases DLEB observations do indeed have enough discriminating power to discern a variation of with mass.
As a second goal of this paper we take the opportunity to report semi-empirical determinations of for an additional set of eclipsing binaries we have identified that are suitable for this type of analysis. As we will show, those results are consistent with and strengthen the general trend found earlier.
We have organized our paper as follows. In Section II we summarize our procedures for exploring the range of acceptable values of for the systems studied by CB2018. Descriptions of these grid experiments are presented and discussed individually in Section III along with a comparison against the results CB2018, highlighting the disagreements. Our conclusions regarding the claims by CB2018 are given in Section IV. In Section V we expand our previous sample of 37 binaries and determine semi-empirical values of for another 13 DLEBs. We also revise the values for 9 of them, based on improvements to their stellar parameters that have appeared recently in the literature. This section also reports our updated vs. mass relation in a new rendering that more fairly displays the uncertainties in our determinations. We conclude with a discussion in Section VI. Appendix A describes in some detail important physical arguments suggesting that the degree of overshooting cannot be as large as claimed by CB2018 for stars of low and intermediate mass.
II. Grid search methodology
CB2018 based their study on eight DLEBs listed in their Table 1. Three have component masses smaller than 2 and are therefore of particular interest (AY Cam, HD 187669, and BK Peg), and the other five are more massive. In most cases the primary and secondary stars are fairly similar in terms of their mass. For each binary they explored a range of values of the overshooting parameter , the standard mixing-length parameter , and the system metallicity [Fe/H], all of which they report in the same table. They assumed both and to be identical for the two components. The stellar evolution models they used are based on the MONSTAR code (Campbell & Lattanzio 2008), with physical ingredients described therein. In particular, these models result in a mixing length parameter for the Sun of , somewhat lower than ours (see below).
To maintain consistency with the results of Paper II and Paper III, our stellar evolution tracks used to fit the binaries were calculated here with the Modules for Experiments in Stellar Astrophysics package (Paxton et al. 2011; Paxton et al. 2013; Paxton et al. 2015, MESA;) version 7385, with the physical ingredients given in our previous work, and ignoring the effects of rotation. The solar-calibrated value of the mixing length parameter for these models and our setup is . All our calculations have included microscopic diffusion. CB2018 did not explicitly say whether they took this effect into account, and we are unable to determine this from an examination of the literature sources for their stellar evolution code. We return to this issue later (Subsection III.9). The element mixture adopted here is that of Asplund et al. 2009, which is the same as used by CB2018. The corresponding mass fraction of metals for the Sun is . The helium abundance in our model grids follows the enrichment law , as in our earlier work. CB2018 used fixed values of or 0.26.
In general we have chosen to explore the same ranges in , , and [Fe/H] as did CB2018, though in a few instances we expanded them somewhat. Our grids for each system are uniform and complete in and . CB2018 did not specify the step sizes they used for or , and from their description it does not appear that their grids are uniformly spaced or complete. Instead, in most cases we presume they sampled the range manually at a few representative values of and , as well as [Fe/H]. For the metallicity we typically explored values within the range allowed by the measured abundances, when available, or else we used the intervals listed by CB2018.
We note also that while three of the binaries in their Table 1 show a range for the mixing length parameter, the other five appear to have been treated with a single value, usually , which is the mixing length for the Sun according to the MONSTAR models of CB2018. Holding fixed at a value appropriate for the Sun carries the risk of biasing the fits for stars that are significantly different from the Sun. Particularly in those cases, but also in others, we have expanded the range of values to account for the theoretical expectation, based on 3D simulations, that may depend on the evolutionary state of the star or on its metallicity (Magic et al. 2015, see, e.g.,).11 1 Due to the different input physics of MESA (mainly the equation of state and the opacities), a direct comparison of our values with those generated by 3D simulations is not straightforward. Our ranges typically extend toward larger values than CB2018, based on the difference seen in the mixing length parameter for the Sun between MESA and MONSTAR. The larger range of values we explore will tend to allow a larger spread of values. Doing this is therefore more conservative when it comes to assigning uncertainties to the overshooting parameter.
CB2018 considered a fit to be acceptable when the model predictions for the two components computed at their measured masses are consistent with the measured radii and temperatures within their reported uncertainties. We used the same criterion here. As in our previous work, to be conservative we accounted for possible errors in the models themselves by allowing an age difference of up to 5% between the components, which again has the effect of allowing a larger range in both and . CB2018 did not explicitly say whether they did something similar, or whether they required the two stars to have precisely the same age in all cases. A further “common sense” rule we have adopted concerns systems for which the observations admit solutions with one of the components in a rapid phase of evolution, and also solutions in a slower phase with a different and/or . As the star can only be in one evolutionary state at a time, in these situations we have chosen the slower phase because that scenario is more likely a priori. CB2018 allowed both types of solutions at the same time, which results in larger ranges of permitted values.
As we will see below, for several systems it is also the case that values for the primary are better constrained than the secondary because it is a more evolved star. When the mass ratio is close to unity, it is not unreasonable to expect the two stars will also have similar degrees of overshooting, which can effectively constrain the otherwise large range that the secondary on its own would permit. In the next section we show how these reasonable assumptions can be applied to some of the CB2018 systems.
III. Results of our grid experiments
We examine each of the eight DLEBs studied by CB2018 in order of decreasing primary mass. The figures accompanying each system below are all drawn to the same scale to permit a direct comparison. A red diagonal line is shown to indicate the intervals that CB2018 claim are allowable, which are always identical for the two components. Note that while a first glance at their Table 1 may suggest that all primary/secondary combinations within their reported ranges give acceptable fits, strictly speaking they have only explored the diagonal of those 2D regions, as shown in the figures that follow. For our own determinations we display the 2D regions to illustrate the sometimes weaker constraint on for the less evolved secondaries, and to identify which combinations of unequal values provide acceptable fits.
III.1. OGLE-LMC-ECL-CEP-0227
Our grid of evolutionary tracks for this system covers the and intervals 0.010–0.020 and 1.80–2.20, respectively, with step sizes of 0.002 and 0.10. Both ranges extend beyond those considered by CB2018, who used a single value of 2.00. To our knowledge there is no available spectroscopic metallicity for this binary. CB2018 adopted , for which we find no acceptable solutions with MESA that accomodate both component radii and both temperatures within the observational errors, for ages differing by no more than 5%. We do find good fits for the metal fraction of used by Claret & Torres 2017, corresponding to with the Asplund et al. 2009 element mixture, so we adopted that value here. The acceptable fits are shown in Figure 1a (dots and crosshatched area), and restrict more than indicated by CB2018 despite the freedom we allowed for and the fact that we did not constrain the primary and secondary values of to be identical. As we cannot make a direct comparison using the same metallicity they adopted, we have at least made it for the same value they chose (2.00). Under these conditions we find a single satisfactory solution, indicated in the right panel.
 |
 |
III.2. LMC-562.059009
 |
 |
For this binary our grids were computed over the range of 0.008–0.016, with a step size of 0.002, and a range in of 2.20–3.00, in intervals of 0.10. Again these are both slightly larger than those of CB2018. This is another system lacking a spectroscopic metallicity measurement, so we adopted a value of (), close to the CB2018 choice. The solutions reported by CB2018 for this binary are quite similar to ours, and are shown in Figure 2a. One significant difference, however, is that they allowed values of as high as 3.00, which exceeds the maximum values predicted by the models of Magic et al. 2015, based on full 3D radiative hydrodynamic calculations. In the right panel of the figure we have restricted to more moderate values between 2.20 and 2.40, which results in a smaller range of allowed values of than reported by CB2018.
III.3. Hya
This particularly interesting binary system features rather unequal masses (Torres et al. 2010, and ;). CB2018 used the same values for the primary and secondary. Our models for each star were computed over the same range as theirs (0.000–0.050) in steps of 0.005, and the values we explored are between 1.60 and 2.20 with our usual step size of 0.10. CB2018 considered a single mixing length parameter of 1.60 for both components (the MONSTAR ). No metallicity determination is available for Hya, so we investigated the [Fe/H] range explored by CB2018 between and the solar composition. The MESA models give no acceptable solutions at either extreme, but we do find good fits for an intermediate value , shown in Figure 3a. At primary values of 0.035 the model predictions are barely within observational errors for that star, and only for mixing length parameters , which are considerably higher than the value adopted by CB2018. For the primary is in a rapid evolutionary phase; we disregard those solutions in favor of those at slower, more likely phases that are permitted at higher values of . The full range of values that the observations allow for the primary and secondary is indicated by the crosshatched region.
 |
 |
 |
 |
If we consider only the single mixing length value adopted by CB2018 (1.60), the acceptable solutions span smaller ranges in for both components (Figure 3b), indicating stronger constraints on overshooting than reported by CB2018 under similar conditions. However, given that our solar value of is considerably larger than theirs, for a more fair comparison with CB2018 we show in this latter figure the good fits for (square symbols), which is the closest in our grid to the MESA solar-calibrated value of . We find slightly more extended ranges in for both stars than with , but still appreciably smaller than indicated by CB2018.
Hya is special in that it has a well measured temperature ratio of from the work of Clausen & Nordström 1978, which sets a strong additional constraint. This quantity is closely related to the difference in the eclipse depths, and is usually much more accurate than the individual absolute temperatures. We find that adding the requirement that the predicted temperature ratio be within the observational error restricts even further. This is shown in Figure 3c for grids over the same range as before, and in Figure 3d for fixed values of 1.60 and 1.80.
Regarding the secondary component of Hya, it is worth pointing out that even though models formally allow them, overshooting parameters as low as zero or 0.005 are probably unrealistic for a star of this mass (). To our knowledge there is no empirical evidence of such small values of for similar stars (Schröder et al. 1997; Stancliffe et al. 2015; Torres et al. 2015; Moravveji et al. 2015; Moravveji et al. 2016; Valle et al. 2017, see, e.g.,). With this consideration, the uncertainty in would be reduced even further.
III.4. OGLE-LMC-ECL-26122
The stellar parameters adopted by CB2018 for this binary are the same as we used in Paper II, based on the work of Pietrzyński et al. 2013. Slight improvements have recently been reported by Graczyk et al. 2018, who also changed the designation to OGLE-LMC-SC9-230659. Here we continue to use the original values for a proper comparison with CB2018, as well as the original designation to avoid confusion. An updated analysis is presented below in Section V.

For this system our grids cover a broader interval in than explored by CB2018 (0.005–0.024, step size = 0.002), and the same range in (1.90–2.20, step size = 0.10). Pietrzyński et al. 2013 reported a spectroscopic metallicity estimate for the binary of . It is worth noting, however, that CB2018 chose to use considerably lower values reaching .22 2 CB2018 stated that this value “is only marginally more metal-poor than the best fit from Claret & Torres 2017, ”. The value we reported in Paper II is actually , corresponding to , which is much closer to the lower limit of the measured value. It is possible that CB2018 mistakenly quoted the value from our earlier Paper I (0.0050), which is based on a different element mixture. That lower value was found in Paper II to be biased too low due to the use of an outdated value for the primordial helium abundance. Restricting ourselves to the measured range only, we find no satisfactory solutions at the upper limit of , but do find them at the lower limit, . These fits are shown in Figure 4 with filled circles, and indicate the observations provide very strong constraints on the primary value of , which can only run between 0.020 to 0.024. For the secondary component, values smaller than about 0.014 place it in a rapid phase of evolution that we consider less likely than allowable slower phases corresponding to a higher degree of overshooting. These more likely fits are indicated by the crosshatched area in the figure. Once again the relatively similar masses of the components (Pietrzyński et al. 2013, and ;) would enable us to restrict the secondary interval even further by requiring its to be similar to that of the primary, as CB2018 assumed. In conclusion, we find that the range of values permitted by the observations of OGLE-LMC-ECL-26122 is considerably smaller than proposed by CB2018.
III.5. SZ Cen
The grids were computed for values between 0.0125 and 0.0300 in steps of 0.0025, and values between 1.60 and 2.20 every 0.10. CB2018 used only their solar-calibrated mixing length parameter of , and considered a very narrow metallicity range between and . There is no measured metallicity available for this binary. The acceptable solutions we find for are shown in Figure 5a, where we include those with for the secondary even though they barely satisfy the observations within observational errors (and only for well above 1.60). Selecting only the fits with , to match what CB2018 did, results in a reduced range of permitted values (Figure 5b, circles), which is smaller than reported by CB2018. Solutions with , close to our own solar-calibrated value, are shown with squares. Hatched regions cover the full range for the primary and secondary in each case.
 |
 |
 |
 |
 |
 |
 |
 |
SZ Cen is another system with a highly precise measurement of the temperature ratio: (Grønbech et al. 1977). If we apply this additional observational constraint under the same conditions as before, we obtain the viable solutions shown in Figures 5c (full range of ) and 5d (restricted ). In the latter panel there are no acceptable fits with , and only a single one with , showing how much better can be determined.
III.6. AY Cam
Our grids of stellar evolution tracks span the full interval of values considered by CB2018 (0.000–0.040), and were calculated with a step of 0.005. Our range in is 1.60–2.00 in steps of 0.10, whereas CB2018 used only the fixed value . AY Cam lacks a spectroscopic metallicity estimate, and the [Fe/H] range considered by CB2018 is fairly small. We find no acceptable fits at their lower limit (solar composition) despite scanning a larger range in , but do find solutions for the upper end, . These fits may be visualized in the left panel of Figure 6, in which each acceptable solution is marked with a dot and may correspond to a different mixing length parameter within the limits we explored. Solutions with place the primary in a rapid stage of evolution, so we have chosen to accept only values of 0.005 or larger, corresponding to slower phases. The full ranges for the primary and secondary are indicated by the crosshatched region.
 |
 |
The right panel of Figure 6 displays the allowed ranges when we hold the mixing length parameter fixed at the value of used by CB2018 for both components. This shrinks the allowed region somewhat, as expected, which now becomes considerably smaller than reported by CB2018, particularly for the primary. As before, the permitted interval for the secondary is larger than the primary because it is relatively unevolved. As done previously for Hya, we considered also solutions with , near our value for the Sun. In this case the primary values are confined between 0.010 and 0.020 (squares). The sections of parameter space allowed by these two choices of are shown by the hatched areas.
CB2018 constrained the values for the AY Cam components to be the same, although the mass difference is actually non-negligible (Williamon et al. 2004, and , ;). If we were to apply the same constraint and force the two stars to have the same , the ranges permitted by the observations at a fixed value of (as per CB2018) would be even smaller. Thus, under similar conditions as CB2018, we find the degree of overshooting to be considerably better defined for this system than indicated by those authors.
III.7. HD 187669
In this case we computed models over the full range in specified by CB2018 (0.000–0.040, with a step of 0.005), and allowed to vary between 1.60 and 2.20 every 0.10. CB2018 held the mixing length parameter fixed at their solar-calibrated value of for both stars. We adopted the same metallicity as CB2018, , which is the measured value for this object (Hełminiak et al. 2015). The models that match the observations within errors are marked in Figure 7a with circles. We find no viable solutions for the value adopted by CB2018, but do find them for . These may be seen in Figure 7b.
 |
 |
For this binary star the full range of viable values (in both panels of the figure) is as large as that found by CB2018 for both components, i.e., 0.000–0.040. Note also that our grids show a tendency for the good fits to cluster along the diagonal of the area, consistent with the fact that the two components of HD 187669 have essentially identical masses (Hełminiak et al. 2015, and ;).
III.8. BK Peg
Our grids in , with a fine step size of 0.002, span the same range as CB2018 (0.000–0.040). For we explored values of 1.20–2.20 in steps of 0.10, which is much wider than the interval of 1.23–1.35 used by CB2018. The measured metallicity of BK Peg is (Clausen et al. 2010). CB2018 explored models in the [Fe/H] range between and that goes beyond the observational errors. We explored an even wider range between and , and find acceptable solutions only for the upper limit, . We display them in Figure 8a, where it can be seen that the values for the primary are better constrained than reported by CB2018. Restricting for both stars to the small interval 1.23–1.35 results in no viable solutions, except combinations with one star in that range and the other far outside it (). Mixing length parameters as low as those considered by CB2018 are rather unusual. In Figure 8b we show the good fits with for both stars. The parameter space for becomes marginally smaller than before in the case of the primary star.
 |
 |
We point out, finally, that CB2018 constrained the values for the BK Peg components to be identical despite noting that the mass difference is actually non-negligible (Clausen et al. 2010, and , ;), and that this could imply the “correct” values of should be different if depends on mass. Here we have not made that assumption.
III.9. Summary of results
The figures in the preceding subsections (right panels) show that for most systems we obtain allowable ranges in for the primary and/or secondary that are consistently smaller than reported by CB2018, even though we did not constrain the overshooting to be the same for the two stars, as they did. Doing so would shrink our permitted ranges even more (see below). We believe that in some cases (LMC-562.05-9009, BK Peg) the CB2018 intervals for are larger partly because they allowed the mixing length parameters to reach values beyond what is typically considered realistic for similar stars, whereas we find perfectly acceptable fits without the need for such extreme values. In the case of OGLE-LMC-ECL-26122 the metallicities allowed by CB2018 also deviated considerably from the measured composition, whereas we have always kept the models within the observational errors in [Fe/H], when available, or explored the same range as CB2018 otherwise. The systems for which we tend to agree the most are ones in which CB2018 did not fix the mixing length parameter to their solar-calibrated value (OGLE-LMC-ECL-CEP-0227, LMC-562.05-9009, OGLE-LMC-ECL-26122).
While all our calculations have included the effects of microscopic diffusion, it is not clear whether or not CB2018 did the same in their work. The influence of diffusion can be very important, particularly for low and intermediate mass stars. It enhances the heavy element content of the core, increasing its size as the star evolves. Thus, to some degree it plays a similar role as overshooting, and can affect the determination of (Michaud et al. 2004; Deheuvels et al. 2016, see, e.g.,). If CB2018 did not include diffusion, then there would be a tendency for them to allow higher values of in their fits, such as they report. Additionally, diffusion alters the surface abundances (i.e., the abundances accessible to observation) to a degree that depends on metallicity and evolutionary state (Dotter et al. 2017; Deal et al. 2018, see, e.g.,). Enforcing the measured (surface) abundances when fitting models while at the same time ignoring diffusion can therefore bias the results, including the inferred and values.
We emphasize here again that our calculations do not take into account the influence of stellar rotation, which can also lead to extra mixing and is therefore degenerate with the effect of overshooting, to some extent (Ekström et al. 2012, see, e.g.,). Including rotation in the modeling would tend to result in lower values of . However, we do not expect rotation to change the overall shape of any dependence there may be between the overshooting parameter and mass.
IV. Assessment of the constraint on from double-lined eclipsing binaries
If we now restrict (along with ) to be the same for the two components of each binary to place our results on the same footing as those of CB2018, the intervals become smaller in several cases. Figure 9 displays a comparison of our uncertainties (gray shaded rectangles) with theirs (open rectangles) for all eight DLEBs in their sample. In one case (OGLE-LMC-ECL-CEP-0227) our grid search returns a single acceptable value of . On the other hand, for LMC-562.05-9009, SZ Cen, and HD 187669 we find good fits over essentially the same ranges as CB2018. There are, however, additional considerations that should not be ignored and that rule out some of the fits, making the formal uncertainties in smaller.

One of those considerations is the tight constraint on the temperature ratio that is available for Hya and SZ Cen, which CB2018 did not use. The impact of this was discussed in the previous section, and is indicated again in Figure 9 with an arrow for these two systems. It shows that for Hya the viable range in is reduced to one tenth the size reported by CB2018, and for SZ Cen it is confined to a single point from our grid.
In five of the eight DLEBs studied by CB2018 the authors claimed the observations are formally consistent with values of exceeding 0.025, and even as high as 0.050 in the case of Hya. Aside from the fact that there is no credible empirical evidence for such a large degree of overshooting as this for stars in the mass range of this sample (1.2–4 ), we believe a more serious issue is that these extreme values run counter to common sense limits grounded in theory. For stars under about 2.0 that have small convective cores it is well known that typical values of the overshooting parameter coupled with a direct dependence between the expansion of the core and the pressure scale height would lead to core sizes that become unrealistically large for such stars because of the sharp increase in the pressure scale height (Wuchterl & Feuchtinger 1998; Woo & Demarque 2001; Pietrinferni et al. 2004; Demarque et al. 2004, see, e.g.,). A more detailed discussion of this issue and its consequences may be found in the Appendix. Roxburgh 1992 established that for stars with small cores the extension due to overshoot cannot exceed about 18% of the size of the classical core set by the Schwarzschild criterion (Woo & Demarque 2001, see also). This maximum core size effectively limits to values much smaller than those allowed by CB2018, and matters the most for the three lowest-mass stars in the sample, AY Cam, HD 187669, and BK Peg. These are precisely the ones that led CB2018 to claim a lack of evidence for a dependence of on mass. Referring back to Figures 6–8 for these three systems, we have highlighted with large open circles the grid points that satisfy the Roxburgh upper limit. The corresponding ranges allowed for have also been transcribed to Figure 9, and are indicated with an arrow. They are between four and eight times smaller than the CB2018 uncertainties.
Thus, based on our grid experiments and the discussion above, we feel that the general conclusion reached by CB2018 regarding the lack of utility of DLEBs for estimating is overly pessimistic, and perhaps somewhat misleading. From their work it is apparent that their approach to the issue of estimating error bars for was strictly statistical in nature, with no other consideration. The situation is more nuanced, as we have shown, and there are other empirical as well as theoretical constraints that should be taken into account if the uncertainties are to be physically realistic. We have been mindful of these constraints in our previous work, even if not stated explicitly, particularly of the theoretical upper limit on the size of the convective cores for lower-mass stars that seems fairly obvious to us.
However, it is clear — and in this we agree with CB2018 — that the constraint on is much weaker for some of the stars, particularly the secondaries of Hya, AY Cam, and BK Peg because they are less evolved, as well as both components in HD 187669 for the reasons mentioned by CB2018. For the unevolved stars this is hardly unexpected, of course, and we have indicated as much in our previous papers. We concur also that while the strength of the constraint on can vary significantly from system to system, there is value in an approach such as ours that draws on a large sample of binaries, adding together whatever information each system is able to contribute for the purpose of investigating how the overshooting parameter may depend on mass.
We point out also that in our previous studies the typical error bars adopted for the estimates from the eclipsing binaries were 0.003 for giants and 0.004 for dwarfs, which we still believe to be quite reasonable when all constraints are taken into account, as described above. Nevertheless, based on the much more detailed examination of the eight systems in the present study as well as additional experiments with new binaries presented below, we consider it prudent to adjust our earlier error estimates to 0.004 for giants and 0.006 for unevolved stars so as to be more conservative. We adopt these uncertainties also in the following.
V. New determinations
Since our most recent study the properties of several of the DLEBs studied in Paper II have been updated by Graczyk et al. 2018, in some cases significantly. Additionally, we have identified 12 more well-measured detached binary systems (mass and radius uncertainties less than 2%) in which one or both components are sufficiently evolved to be useful for estimating . Most have metallicity estimates. Almost all the new binaries are giants, and in five cases one or both stars are less massive than 2 , and are therefore especially valuable for investigating the dependence of on mass. We have also added Hya to the list, which we investigated in detail above as part of the CB2018 sample. This system had been dropped from our previous studies because we had been unable to obtain a good fit to the observations at sufficiently similar ages for the two components using a different set of models (see Paper I), but we have now been able to do so with MESA.
The revised physical parameters for the nine DLEBs from Paper II33 3 Note that in revising the properties of OGLE-LMC-ECL-26122 Graczyk et al. 2018 have also changed its designation to OGLE-LMC-SC9-230659; for consistency we continue to use the old name here. and for the 13 new binaries including Hya are collected in Table 1. Each block of the table has the systems sorted in decreasing order of the primary mass. In two of the new systems, KIC 10031808 and KIC 9246715 (Hełminiak et al. 2019), the spectroscopic abundance analysis also yielded a measure of [/Fe], which we have accounted for below in fitting the evolutionary tracks.
| Name | Mass () | Radius () | (K) | [Fe/H] | Source |
|---|---|---|---|---|---|
| Revised parameters for binaries in our Paper II sample | |||||
| OGLE-LMC-ECL-06575 | 1 | ||||
| OGLE-LMC-ECL-26122aaThe new designation introduced by Graczyk et al. 2018 is OGLE-LMC-SC9-230659; we retain the old name for consistency with our earlier work. | 1 | ||||
| OGLE-LMC-ECL-01866 | 1 | ||||
| OGLE-LMC-ECL-10567 | 1 | ||||
| OGLE-LMC-ECL-09114 | 1 | ||||
| OGLE-LMC-ECL-09660 | 1 | ||||
| OGLE-LMC-ECL-25658 | 1 | ||||
| OGLE-LMC-ECL-03160 | 1 | ||||
| OGLE-LMC-ECL-15260 | 1 | ||||
| New binary systems | |||||
| OGLE-LMC-ECL-13360 | 1 | ||||
| Hya | 2 | ||||
| OGLE-LMC-ECL-21873 | 1 | ||||
| OGLE-LMC-ECL-24887 | 1 | ||||
| OGLE-LMC-ECL-18836 | 1 | ||||
| OGLE-LMC-ECL-13529 | 1 | ||||
| V4089 Sgr | 3 | ||||
| OGLE-LMC-ECL-09678 | 1 | ||||
| KIC 9246715 | bbKIC 9246715 has a measured [/Fe] , and KIC 10031808 has [/Fe] . | 4 | |||
| OGLE-LMC-ECL-12669 | 1 | ||||
| OGLE-LMC-ECL-12875 | 1 | ||||
| KIC 10031808 | bbKIC 9246715 has a measured [/Fe] , and KIC 10031808 has [/Fe] . | 4 | |||
| OGLE-LMC-ECL-12933 | 1 | ||||
Note. — The first line for each system corresponds to the more evolved star. Sources are: (1) Graczyk et al. 2018; (2) Torres et al. 2010. (3) Veramendi & González 2015; (4) Hełminiak et al. 2019.
Our new determinations of and were carried out with the same MESA models described in Section II, following the same procedure as in our previous studies. Briefly, we made use of coarse grids of evolutionary tracks calculated for the measured component masses and spanning a range of and values. These grids served to guide subsequent manual adjustments toward the final estimates of the overshooting and mixing length parameters for each star, making use of all observational and theoretical constraints. The values reported here are those giving the smallest chi-squared value, with the main observables typically being the absolute radii and temperatures. The ages for the two components in each system were allowed to differ by no more than 5%. Adopted uncertainties in are 0.004 for giants and 0.006 for dwarfs (see above). The values have typical errors of 0.20. For full details we refer the reader to our earlier studies (e.g., Section 3 of Paper II, or Section 3 of Paper III). The results are presented in Table 2, along with the best-fit heavy element abundance and the mean age of each system.
| Primary | Secondary | |||||
|---|---|---|---|---|---|---|
| ———————— | ———————— | Mean age | ||||
| Name | aaBulk initial composition from our fits. | (Myr) | ||||
| Revised parameters for binaries in our Paper II sample | ||||||
| OGLE-LMC-ECL-06575 | 0.0160 | 2.20 | 0.0160 | 2.03 | 0.0048 | 151 |
| OGLE-LMC-ECL-26122 | 0.0160 | 1.80 | 0.0160 | 2.05 | 0.0070 | 233 |
| OGLE-LMC-ECL-01866 | 0.0160 | 1.92 | 0.0150 | 1.97 | 0.0070 | 228 |
| OGLE-LMC-ECL-10567 | 0.0155 | 1.95 | 0.0160 | 2.01 | 0.0050 | 251 |
| OGLE-LMC-ECL-09114 | 0.0160 | 2.00 | 0.0180 | 1.70 | 0.0040 | 253 |
| OGLE-LMC-ECL-09660 | 0.0160 | 2.18 | 0.0170 | 2.05 | 0.0040 | 341 |
| OGLE-LMC-ECL-25658 | 0.0160 | 2.09 | 0.0160 | 2.09 | 0.0044 | 786 |
| OGLE-LMC-ECL-03160 | 0.0070 | 1.87 | 0.0070 | 1.98 | 0.0033 | 1102 |
| OGLE-LMC-ECL-15260 | 0.0040 | 2.20 | 0.0040 | 2.09 | 0.0033 | 2070 |
| Fitted parameters for the new binary systems in this work | ||||||
| OGLE-LMC-ECL-13360 | 0.0160 | 1.80 | 0.0140 | 1.80 | 0.0080 | 174 |
| Hya | 0.0200 | 1.80 | 0.0150 | 1.80 | 0.0120 | 204 |
| OGLE-LMC-ECL-21873 | 0.0165 | 1.85 | 0.0160 | 1.95 | 0.0053 | 332 |
| OGLE-LMC-ECL-24887 | 0.0160 | 2.20 | 0.0160 | 2.30 | 0.0080 | 397 |
| OGLE-LMC-ECL-18836 | 0.0160 | 2.03 | 0.0160 | 1.95 | 0.0053 | 357 |
| OGLE-LMC-ECL-13529 | 0.0160 | 2.08 | 0.0160 | 2.15 | 0.0053 | 378 |
| V4089 Sgr | 0.0170 | 2.00 | 0.0060 | 2.10 | 0.0160 | 525 |
| OGLE-LMC-ECL-09678 | 0.0150 | 2.00 | 0.0150 | 1.90 | 0.0040 | 549 |
| KIC 9246715 | 0.0140 | 1.80 | 0.0140 | 1.80 | 0.0130 | 824 |
| OGLE-LMC-ECL-12669 | 0.0160 | 2.10 | 0.0180 | 1.95 | 0.0053 | 1124 |
| OGLE-LMC-ECL-12875 | 0.0140 | 2.00 | 0.0140 | 2.00 | 0.0048 | 1181 |
| KIC 10031808 | 0.0140 | 1.90 | 0.0140 | 1.90 | 0.0125 | 1283 |
| OGLE-LMC-ECL-12933 | 0.0045 | 2.20 | 0.0045 | 2.20 | 0.0048 | 1882 |

With the present determinations along with those reported in Paper II (updated here for 9 cases; see Table 1) and Paper III we now have estimates for a total of 50 DLEBs (100 stars), all based on the same MESA models with the same element mixture (Asplund et al. 2009). The new and revised values are consistent with the results from our earlier studies, and support the existence of a dependence with mass. A representation of this relation that provides a sense of the overall uncertainties is shown in Figure 10 in the form of a “heatmap”, in which each measurement was replaced with a distribution of 10,000 random draws from a Gaussian distribution with or 0.006 depending on whether the star is evolved or not. To achieve smoothness in the horizontal direction we also perturbed the masses in the same way with % of their individual values. Each pixel in the diagram is colored according to the number of random draws it contains. The actual measurements are shown as well.
VI. Discussion
The challenging problem of calibrating the convective core overshooting parameter has been approached in different ways over the last two or three decades using a variety of empirical data. These include color-magnitude diagrams of open clusters and associations, binary stars, rotational velocities of massive stars, and more recently also asteroseismic constraints. Due in large part to observational limitations (measurement errors, sample size, etc.), many of these determinations have reported estimates of a mean or typical value of or for a given population of stars, but have generally lacked the sensitivity to explore changes as a function of mass or other stellar properties. As a result, there is conflicting evidence in the literature: some studies support a variation of the overshooting parameter with mass, while others find that a constant value is perfectly adequate.
For example, Schaller et al. 1992 adopted a fixed overshooting parameter ( in the step-function approximation) for stars of all masses, on the basis of a comparison of their models and earlier ones with the morphology of the turnoff of several dozen open clusters (Maeder & Mermilliod 1981; Mermilliod & Maeder 1986, see also). Demarque et al. 2004 also used clusters, but favored a gradual increase in overshooting for masses above 1.2 somewhat analogous to what we have found here, with an additional dependence on metallicity. An independent study by VandenBerg et al. 2006 comparing their own models with color-magnitude diagrams of open clusters reached a qualitatively similar conclusion, proposing that overshooting increases between about 1.15 and 1.7 . Further evidence also in the direction of a change in overshooting with mass was found by Ekström et al. 2012 and Georgy et al. 2013 from an investigation of the width of the terminal-age main-sequence for stars in the range 1.35–9 . On the other hand, in their recent paper presenting a large grid of MESA models Choi et al. 2016 took a different view and adopted a fixed value of for stars of all masses, determined from isochrone fits to the color-magnitude diagram of M67. On the asteroseismic side Aerts 2015 reported seeing no significant trend of the strength of overshooting with mass for a set of mostly OB stars, whereas the study of Deheuvels et al. 2016 did find a hint of a possible increase with mass over the range 1.1–1.5 , although their sample was small.
While it seems undisputed that overshooting is required in most (if not all) stars above about 2 (Moravveji et al. 2015; Moravveji et al. 2016; Valle et al. 2017, and others), the evidence is just as compelling that other less massive stars such as the components of the eclipsing binary AI Phe ( and 1.19 ) can only be fit properly without overshooting (Higl & Weiss 2017). This imples some sort of transition in the values of or between high- and low-mass stars. In fact, in a sign of a general tendency we see in the literature toward acceptance of such a transition, many current series of stellar evolution models (but not all) already incorporate a dependence of overshooting on mass (Demarque et al. 2004; Pietrinferni et al. 2004; VandenBerg et al. 2006; Mowlavi et al. 2012; Bressan et al. 2012; Georgy et al. 2013; Spada et al. 2017; Hidalgo et al. 2018, e.g.,), although the adopted functional form of the trend has so far been largely arbitrary.
Early studies based on binaries (Schröder et al. 1997; Ribas et al. 2000; Claret 2007) also suggested a variation of overshooting with mass, but were generally afflicted by small samples and/or large uncertainties. Other more recent binary studies such as those of Meng & Zhang 2014 and Stancliffe et al. 2015 have not found clear signs of a change, but also dealt with few systems. The present investigation, which continues and expands our previous work in Paper II and Paper III, uses by far the largest sample of binaries (50) with accurately measured parameters and presents strong evidence (Figure 10) for a gradual change in as a function of mass, with a break point near 2 .
Given the history of claims and counterclaims regarding this issue, the study of CB2018 comes as no surprise and is in fact welcome, as it has motivated us to reexamine our own work more critically. They contend, based on their model fits for a subset of 8 representative DLEBs they selected from our previous samples, that the formal uncertainties in the fitted values are so large as to make the more unevolved binaries essentially useless for calibrating overshooting. Our replication of those experiments with the MESA models under the same conditions as theirs, to the extent possible, finds considerably smaller uncertainties in many cases, especially when taking into account the constraint from the temperature ratio available for some systems, which CB2018 ignored. Moreover, the implausibly large values allowed by them in several cases are the result of not taking into account physical arguments that limit the maximum overshooting distance in stars with small convective cores, specifically, the Roxburgh criterion. This is particularly relevant below 2 , which is precisely the regime in which we (and others) have found that varies with mass (see also Figure 13). The purely statistical approach of CB2018 for estimating is of course expected to lead to larger formal uncertainties, but is too simplistic if the goal is to extract overshooting parameters and uncertainties that make physical sense. Their assumption of a single value in binaries with components of appreciably different mass ( Hya, AY Cam, BK Peg) also appears questionable to us, even more so if the goal is to detect a trend of with mass.
Beyond the notion that there is a maximum permissible extension of the convective core due to overshooting, our current understanding of the phenomenon does not yet allow us to predict the value of the overshooting parameter from first principles with any certainty. Nevertheless, we note that recent theoretical work by Jermyn et al. 2018 has led them to postulate that the parameter depends on mass in much the same way as indicated by the semi-empirical evidence we have presented here. Their Figure 8 for versus mass bears a striking resemblance to our Figure 10 for (Claret & Torres 2017, once the scale factor is accounted for;), except that their peak value of seems about 25% higher than indicated by the observations. Through similar theoretical arguments they find an analogous mass dependence for the diffusive parameter (see their Figure 9), although in this case their scale is a factor of 5.5 too large.
We mention in closing that a similar trend of overshooting with mass can be inferred theoretically (Jermyn et al. 2018, and independently of the work by) from the homology arguments presented by Claret & Torres 2017. This follows from Equation (7) of their Appendix, which gives an expression for the fractional increase in the mass of the convective core. Details of this derivation will be published elsewhere.
References
- Aerts (2015) Aerts, C. 2015, New windows on massive stars: asteroseismology, interferometry, and spectropolarimetry, IAU Symp. 307, eds. G. Meynet, C. Georgy, J. H. Groh & Ph. Stee (Cambridge, UK, CUP), 154
- Asplund et al. (2009) Asplund, M., Grevesse, N., Sauval, A. J., & Scott, P. 2009, ARA&A, 47, 481 (A09)
- Baker & Kuhfuss (1987) Baker, N. H., & Kuhfuss 1987, A&A, 185, 117
- Bonaca et al. (2012) Bonaca, A., Tanner, J. D., Basu, S. et al. 2012, ApJ, 755, L12
- Bressan et al. (2012) Bressan, A., Marigo, P., Girardi, L., Salasnich, B., Dal Cero, C., Rubele, S., & Nanni, A. 2012, MNRAS, 427, 127
- Campbell & Lattanzio (2008) Campbell, S. W., & Lattanzio, J. C. 2008, A&A, 490, 769
- Canuto (1997) Canuto, V. M. 1997, ApJ, 489, L71
- Choi et al. (2016) Choi, J., Dotter, A., Conroy, C., et al. 2016, ApJ, 823, 102
- Claret (2007) Claret, A. 2007, A&A, 475, 1019
- Claret & Torres (2016) Claret, A., & Torres G. 2016, A&A, 592, A15 (Paper I)
- Claret & Torres (2017) Claret, A., & Torres G. 2017, ApJ, 849, 18 (Paper II)
- Claret & Torres (2018) Claret, A., & Torres G. 2018, ApJ, 859, 100 (Paper III)
- Clausen & Nordström (1978) Clausen, J. V., & Nordström, B. 1978, A&A, 67, 15C
- Clausen et al. (2010) Clausen, J. V., Frandsen, S., Bruntt, H., et al. 2010, A&A, 516, A42
- Constantino & Baraffe (2018) Constantino, T., & Baraffe, I., 2018, A&A, 618, 177 (CB2018)
- Deal et al. (2018) Deal, M., Alecian, G., Lebreton, Y., et al. 2018, A&A, 618, A10
- Demarque et al. (2004) Demarque, P., Woo, J.-H., Kim, Y.-C., & Yi, S. K. 2004, ApJS, 155, 667
- Deheuvels et al. (2016) Deheuvels, S., Brandao, I., Silva Aguirre, V., et al. 2016, A&A, 589, A93
- Dotter et al. (2017) Dotter, A., Conroy, C., Cargile, P., & Asplund, M. 2017, ApJ, 840, 99
- Ekström et al. (2012) Ekström, S., Georgy, C., Eggenberger, P., et al. 2012, A&A, 537, A146
- Freytag et al. (1996) Freytag, B., Ludwig, H.-G., & Steffen, M. 1996, A&A, 313, 497
- Georgy et al. (2013) Georgy, C., Ekström, S., Eggenberger, P. et al. 2013, A&A, 558, A103
- Graczyk et al. (2018) Graczyk, D., Pietrzynski, G., Thompson, I. B. et al. 2018, ApJ, 860, 1
- Grevesse & Sauval (1998) Grevesse, N., & Sauval, A. J. 1998, Space Sci. Rev., 85, 161 (GS98)
- Grønbech et al. (1977) Grønbech, B., Gyldenkerne, K., & Jorgensen, H. E. 1977, A&A, 55, 401
- Hełminiak et al. (2015) Hełminiak, K. G., Graczyk, D., Konacki, M., et al. 2015, MNRAS, 448, 1945
- Hełminiak et al. (2019) Hełminiak, K. G., Konacki, M., Maehara, H., et al. 2019, MNRAS, 484, 451
- Herwig et al. (1997) Herwig, F., Bloecker, T., Schoenberner, D., & El Eid, M. 1997, A&A, 324, L81
- Hidalgo et al. (2018) Hidalgo, S. L., Pietrinferni, A., Cassisi, S. et al. 2018, ApJ, 856, 125H
- Higl & Weiss (2017) Higl, J., & Weiss, A. 2017, A&A, 608, A62
- Jermyn et al. (2018) Jermyn, A. S., Tout, C. A., & Chitre, S. M. 2018, MNRAS, 480, 5427.
- Kupka & Muthsam (2017) Kupka, F., & Muthsam, H. J. 2017, Living Rev Comput Astrophys,3, 1
- Kuhfuss (1987) Kuhfuss, R. 1987, in Nuclear Astrophysics, (W. Hillebrandt , R. Kuhfuss, E. Mueller, J. W. Truran eds.), Springer-Verlag, Berlin, 222
- Maeder (2009) Maeder, A. 2009 in Physics, Formation and Evolution of Rotating Stars, Springer-Verlag Berlin Heidelberg
- Maeder & Mermilliod (1981) Maeder, A., & Mermilliod, J. C. 1981, A&A, 93, 136
- Magic et al. (2015) Magic, Z., Weiss, A., & Asplund, M. 2015, A&A, 573, A89
- Meng & Zhang (2014) Meng, Y., & Zhang, Q. S. 2014, ApJ, 787, 127
- Mermilliod & Maeder (1986) Mermilliod, J.-C., & Maeder, A. 1986, A&A, 158, 45
- Michaud et al. (2004) Michaud, G., Richard, O., Richer, J., & VandenBerg, D. A. 2004, ApJ, 606, 452
- Moravveji et al. (2016) Moravveji, E., Townsend, R. H. D., Aerts, C., & Mathis, S. 2016, ApJ, 823, 130
- Moravveji et al. (2015) Moravveji, E., Aerts, C., Pápics, P. I., Triana, S. A., & Vandoren, B. 2015, A&A, 580, A27
- Mowlavi et al. (2012) Mowlavi, N., Eggenberger, P., Meynet, G., Ekström, S., Georgy, C., Maeder, A., Charbonnel, C., & Eyer, L. 2012, A&A, 541, 41
- Paxton et al. (2011) Paxton, B., Bildsten, L., Dotter, A. et al. 2011, ApJS, 192, 3
- Paxton et al. (2013) Paxton, B., Cantiello, M., Arras, P., et al. 2013, ApJS, 208, 4
- Paxton et al. (2015) Paxton, B., Marchant, P., Schwab, J., et al. 2015, ApJS, 220, 15
- Pietrinferni et al. (2004) Pietrinferni, A., Cassisi, S., Salaris, M., & Castelli, F. 2004 ApJ, 612, 168
- Pietrzyński et al. (2013) Pietrzyński, G., Graczyk, D., Gieren, W. et al. 2013, Nature, 495, 76
- Ribas et al. (2000) Ribas, I., Jordi, C., & Giménez, Á. 2000, MNRAS, 318, L55
- Roxburgh (1978) Roxburgh, I. 1978 A&A, 65, 281
- Roxburgh (1989) Roxburgh, I. 1989 A&A, 211, 361
- Roxburgh (1992) Roxburgh, I. 1992 A&A, 266, 291
- Roxburgh & Kupka (2006) Roxburgh, I. 2006, in Proceedings IAU Symposium No. 239, eds. F. Kupka, I. W. Roxburgh & K. L. Chan), 98
- Schaller et al. (1992) Schaller, G., Schaerer, D., Meynet, G., & Maeder, A. 1992, A&AS, 96, 269
- Schröder et al. (1997) Schröder, K.-P., Pols, O. R., & Eggleton, P. P. 1997, MNRAS, 285, 696
- Spada et al. (2017) Spada, F., Demarque, P., Kim, Y.-C., Boyajian, T. S., & Brewer, J. M. 2017, ApJ, 838, 161
- Stancliffe et al. (2015) Stancliffe, R. J., Fossati, L., Passy, J.-C., & Schneider, F. R. N. 2015, A&A, 575, A117
- Torres et al. (2010) Torres, G., Andersen, J., & Giménez, A. 2010, A&A Rev., 18, 67
- Torres et al. (2015) Torres, G., Claret, A., Pavlovski, K., & Dotter, A. 2015, ApJ, 807, 26
- Valle et al. (2017) Valle, G., Dell’Omodarme, M., Prada Moroni, P. G., & Degl’Innocenti, S. 2017, A&A, 600, A41
- VandenBerg et al. (2006) VandenBerg, D. A., Bergbusch, P. A., & Dowler, P. 2006, ApJS, 162, 375
- Veramendi & González (2015) Veramendi, M. E., & González, J. F. 2015, New A, 34, 266
- Williamon et al. (2004) Williamon, R. M., Sowell, J. R., & Van Hamme, W. 2004, AJ, 128, 1319
- Woo & Demarque (2001) Woo, J-H., Demarque, P. 2001, AJ, 122, 102
- Wuchterl & Feuchtinger (1998) Wuchterl, G., & Feuchtinger, M. U. 1998, A&A, 340, 419
- Zahn (1991) Zahn, J.-P. 1991 A&A, 252, 179
Appendix A Theoretical considerations: upper limits on overshooting
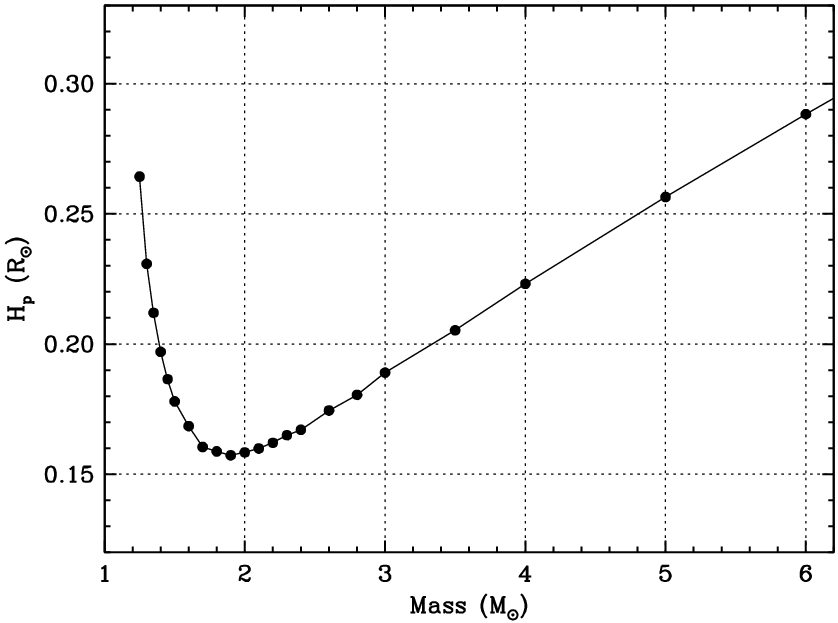
It is helpful to begin our discussion of this issue by considering the behavior of the key quantity for calculating the overshooting distance in both the classical step-function approximation (with free parameter ) and the diffusive approximation (), which is the pressure scale height . Using the same MESA code as before, we computed models over a range of masses and extracted the values of at the edge of the standard convective core set by the Schwarzschild criterion. These values are plotted in Figure 11. For this illustration we used solar-metallicity zero-age main-sequence (ZAMS) models44 4 We define the ZAMS in our models as the stage at which the central hydrogen content drops to 99.4% of its initial value. with and no rotation, overshooting, or microscopic diffusion, and we adopted again the Asplund et al. 2009 element mixture.
Interestingly, the trend shows a pronounced minimum at about 1.8 , resulting in values for low-mass stars that are large and comparable to those of much higher mass stars. This behavior follows from the expression that defines the pressure scale height at the radial distance as:
| (A1) |
where is the pressure, the local gravity, and the density. As the convective core becomes very small and decreases, the result is . Thus, as Figure 11 shows, a star of 1.25 has a value of approximately the same as one of 5 . Therefore, adopting the same values of or for these two very different stars would result in the cores being increased in size by the same amount.
The top panel of Figure 12, generated with the same models as above and , illustrates the change in the mass of the convective core normalized to its value in the absence of overshooting, as a function of the overshooting parameter . For a reference value of such as that indicated by CB2018 (, dotted line), a star of 1.20 (roughly the lowest mass at which convective cores appear) would develop a core that is a full seven times more massive than the classical core, which seems physically implausible. Even more extreme cores would result for as large as some of the values considered by CB2018 (e.g., 0.040). For higher mass stars the core enlargements are more modest, and take on an asymptotic behavior beyond about 1.8 . An equivalent representation is seen in the bottom panel of Figure 12, now for the change in the physical size (radius) of the core relative to that of the classical core with no overshooting. At the CB2018 value of our 1.20 star would see its core increased in size by nearly a factor of two.
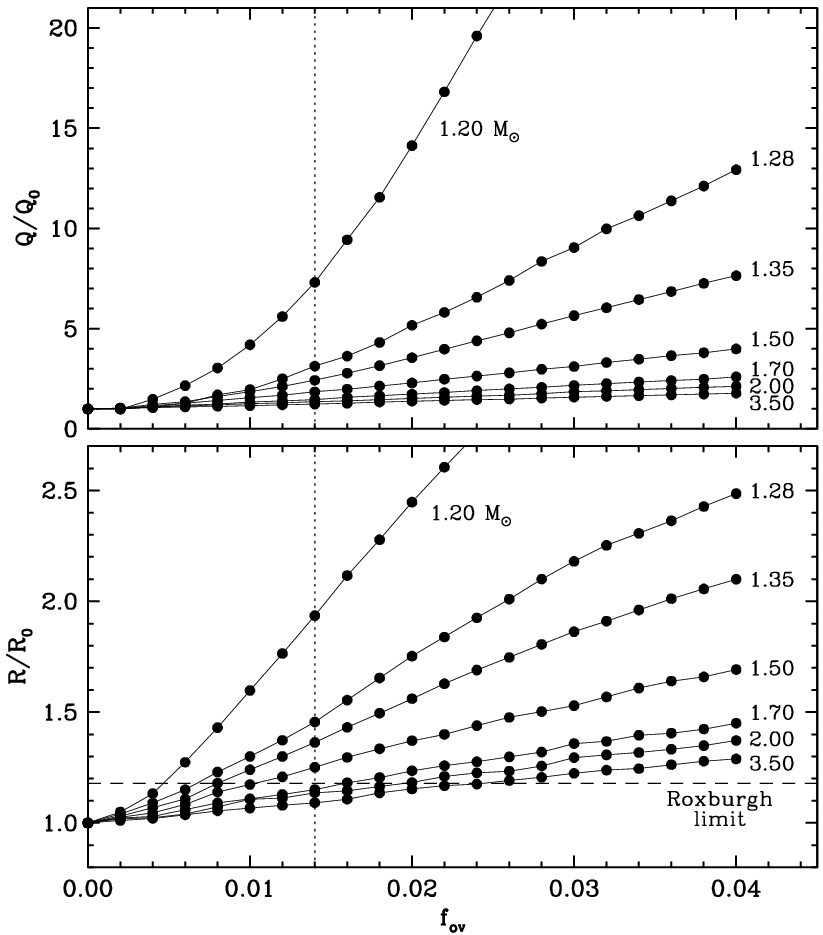
This basic physical argument makes it immediately clear that the formal error bars for reported by CB2018 should be reduced significantly at the upper end, and can hardly reach values as large as 0.040 for relatively low-mass stars with small cores. This conclusion is quite aside from the fact that there is no empirical evidence supporting such large values of for stars under about 2 , as pointed out earlier.
Both the step-function and the diffusive formulations of overshooting are largely ad hoc in nature and lack any predictive power to set or from first principles. A valuable attempt in this direction was carried out more than 40 years ago by Roxburgh 1978, who established a criterion to estimate the overshooting distance based on an integral involving the difference between the luminosities due to nuclear and radiative processes. The integrand evaluated at the lower and upper limits of the convective plus overshoot region ( and , respectively) changes sign at some intermediate radius , permitting a definition of the overshooting distance as .
As a device for estimating the overshooting distance itself the Roxburgh criterion was initially called into question by Baker & Kuhfuss 1987, but has since been shown to be valid as an upper limit to that distance (Kuhfuss 1987; Zahn 1991; Roxburgh 1992; Canuto 1997, see, e.g.,). In particular, Roxburgh 1992 estimated that for stars with small cores the maximum overshooting distance is approximately 0.18 times the size of the classical core, independently of the details of energy generation and opacity. Woo & Demarque 2001 arrived at a similar estimate. For useful discussions about the validity of the Roxburgh criterion, and more generally about the modeling of convection, we refer the reader to the reviews by Maeder 2009 and Kupka & Muthsam 2017.
The Roxburgh 1992 upper limit to the extension of the core is shown in bottom panel of Figure 12 as a dashed line. This naturally sets a maximum value of for stars with small convective cores. We illustrate this more directly in Figure 13, which reproduces our previous estimates of from Claret & Torres 2017; Claret & Torres 2018. The Roxburgh limit is seen to be consistent with the semi-empirical determinations of .

This upper limit from theory is most relevant for the three binaries in the CB2018 sample with the lowest mass: AY Cam, HD 187699, and BK Peg. For these three systems we have marked in Figures 6–8 with an open circle the solutions with values for the primary and secondary that satisfy the Roxburgh criterion (or slightly exceed it, to be conservative). This constraint reduces the range of allowable values quite significantly, and should not be ignored.