Vol.0 (200x) No.0, 000–000
AstroSat observation of GX 5-1: Spectral and timing evolution
Abstract
We report on the first analysis of AstroSat observation of the Z-source GX 5-1 on February 26-27, 2017. The hardness-intensity plot reveals that the source traced out the horizontal and normal branches. The 0.8-20 keV spectra from simultaneous SXT and LAXPC data at different locations of the hardness-intensity plot can be well described by a disk emission and a thermal Comptonized component. The ratio of the disk flux to the total i.e. the disk flux ratio increases monotonically along the horizontal to the normal one. Thus, the difference between the normal and horizontal branches is that in the normal branch, the disk dominates the flux while in the horizontal one it is the Comptonized component which dominates. The disk flux scales with the inner disk temperature as and not as , suggesting that either the inner radii changes dramatically or that the disk is irradiated by the thermal component changing its hardness factor. The power spectra reveal a Quasi Periodic Oscillation whose frequency changes from 30 Hz to 50 Hz. The frequency is found to correlate well with the disk flux ratio. In the 3-20 keV LAXPC band the r.m.s of the QPO increases with energy (r.m.s ), while the harder X-ray seems to lag the soft ones with a time-delay of a milliseconds. The results suggest that the spectral properties of the source are characterized by the disk flux ratio and that the QPO has its origin in the corona producing the thermal Comptonized component.
keywords
accretion, accretion disc — stars: neutron star — X-rays: binaries— X-rays: individual: GX 5-11 Introduction
X-ray Binaries are the class of binaries that emit X-rays radiations. An X-ray Binary system has a normal star or a white dwarf transferring mass onto a compact object such as a neutron star (NS) or a Black Hole (BH). These systems can be classified into two categories, i.e., low-mass X-ray binaries (LMXB) and high-mass X-ray binaries (HMXB), based on the mass of the companion star (Hasinger & van der Klis 1989). In LMXBs the low mass companion star is usually a late type star and matter accretes through Roche lobe overflow e.g. (Konar & Bhattacharya 1999; Paul & Naik 2011).
LMXB harbouring neutron stars can be characterized into two classes called “Atoll” and “Z” based on the shapes they track out in their X-ray hardness intensity diagram (HID)[e.g. Atoll type : 4U 1608-52 (Lei et al. 2015), GX 3+1 (Kuulkers & van der Klis 2000), 4U 1735-44 (Lei et al. 2013), 4U 1728-34 (Migliari et al. 2003), 4U 1820-30 (Díaz Trigo et al. 2017), GX 9+1 (Wang 2016) & Z type : Cyg X-2 (Lei et al. 2013), GX 17+2 (Kuulkers et al. 2002), GX 349+2 (Iaria et al. 2004) Sco X-1 (Titarchuk et al. 2001), GX 340+0 (Seifina et al. 2013), GX 5-1 (Jackson et al. 2009)] (Hasinger & van der Klis 1989). The HID is a plot of hard colour as a function of total X-ray count rates. The HID plot representations are useful to understand the variations in spectra and the spectral components.
The Z-type sources are characterised by having three main branches in a HID. From top-left to bottom-right is the horizontal branch (HB), and then the normal branch (NB) and the bottom flaring branch (FB). The transition between the NB and HB is called the Hard Apex (HA) and between the FB and NB is called Soft Apex (Blom et al. 1993; Agrawal & Bhattacharyya 2003). Z-type sources are further subdivided into two subcategories: Those with a somewhat vertical or short HB , but with an extended long FB are called “Sco like sources”, (e.g., Sco X-1, GX 17+2 and GX 349+2) while those sources that have a proper horizontal HB and weak FB are called “Cyg like sources”, (e.g., Cyg X-2, GX 340+0, GX 5-1)(Penninx et al. 1991; Kuulkers et al. 1994; Church et al. 2012).
Theoretically, for NS-LMXBs the X-ray emission may originate from the accretion disk and a boundary layer between the disk and the neutron star surface (Hanawa 1989; Popham & Sunyaev 2001; Gilfanov et al. 2003). Observationally, the spectra of these sources are dominated by a Comptonized component and a soft one. There has been controversy regarding the origin of these components. In one interpretation, the soft component is due to a multi-colored disk and the Comptonized one due to the boundary layer (Mitsuda et al. 1984; Makishima et al. 1986; Mitsuda et al. 1989; Barret et al. 1999; Agrawal & Misra 2009) while the alternative is that the soft component is a black body emission from the boundary layer and the Comptonized one is due to a corona (Church & Bałucińska-Church 2004; Kong et al. 2006; Lavagetto et al. 2008). In fact some spectral analysis suggest the more natural situation that the seed photons arise from two components (i.e. a black body and a disk emission) or that one can dominate at different regions of the Z-track (Raichur et al. 2011; Sakurai et al. 2012; Armas Padilla et al. 2017). The spectral parameters vary along the track but are subject to which interpretation is chosen (Falanga et al. 2006; White et al. 1988; Titarchuk et al. 1998; Agrawal & Sreekumar 2003). It has been argued that changes in the mass accretion rate, , are responsible for a source changing its spectral state or moving along its branches in the HID, as proposed by Priedhorsky et al. 1986 . Support for an increase of from the HB to the NB, and then along the FB, came from a multi-wavelength study of Cyg X-2 by Hasinger et al. (1990). In the past decade, however, it has been shown that the variability of Z sources is not so simple as this (Church et al. 2012). For example, spectral analysis along the Z-track suggests that the accretion rate maybe constant (Lin et al. 2009).
Another debate in the literature has been the location and size of the region producing the Comptonizing component. For eclipsing sources, the time taken for the companion star to eclipse the X-ray producing region suggest a large size of cms (Church & Bałucińska-Church 2004) and hence the spectra of these sources have been interpreted in terms of the extended accretion disk corona model (Church et al. 2014). An extended hot region is also required to produce the ionized emission lines seen in high resoultion spectra (Schulz et al. 2009). However it is not clear how the gravitational energy which is released close to the neutron star is transported to power in such an extended corona. More importantly, as discussed below, these sources exhibit high frequency quasi periodic oscillations which demand a highly compact origin of the Comptonized component instead of an extended one.
Timing studies are an important, possible way to constrain the geometry and interpret the changes along the Z-track. These studies are generally undertaken by computing the power density spectra (PDS) which is the amplitude square of the Fourier transform of the source light curve. Its generally consist of broad features along with narrow peaks with the latter being called Quasi-Periodic Oscillations (QPOs) (Méndez & van der Klis 1999; van der Klis 2000; Méndez 2000; Méndez et al. 2001; Barret et al. 2005; Mondal et al. 2018). It should be noted that most of these studies are based on analysis of data from the Rossi X-ray Timing Explorer (RXTE). QPOs have been observed in the horizontal and normal branches and are named as horizontal branch oscillations (HBOs) and normal branch oscillations (NBOs) respectively (van der Klis et al. 1985; Lamb 1991; Lewin et al. 1992). The frequencies of the HBO lie in the range of 15 - 60 Hz while for NBO they lie between 5 - 20 Hz (Jonker et al. 2002; Homan et al. 2007). It is also known that the frequencies evolve along the track i.e. the HBO frequency decreases from the hard apex as the source moves along the horizontal branch and the frequency is correlated with the intensity. These sources also show very rapid variability in the form of kHz QPOs which are seen when the source in the normal and flaring branches(Kuulkers et al. 1996; Wijnands et al. 1998).
GX 5-1 is the second brightest (after Sco X-1, (Giacconi et al. 1962)) persistent NS LMXB. The source is classified as Z-track LMXB and is located near to the Galactic center. It radiates nearly at or exceeding the Eddington limit with typical Eddington fraction = 1.6-2.3 assuming a distance of 9.0 kpc (Jackson et al. 2009; Sriram et al. 2011; Homan et al. 2018). It is a Cyg-like source having an extended horizontal branch (Kuulkers et al. 1994).The source exhibits NBO and HBO along with kHz QPOs (Wijnands & van der Klis 1999; Jonker et al. 2002). The frequency of its HBO ranges from 13 to 50 Hz and is known to correlated with X-ray luminosity (van der Klis et al. 1985). Hard time lags (i.e. the hard photons are delayed w.r.t to the soft ones) of the order of milliseconds, have been detected for both HBOs and NBOs (van der Klis et al. 1987; Vaughan et al. 1994; Sriram et al. 2011).
RXTE spectral analysis of GX 5-1 was conducted by Jackson et al. 2009 , who favored a blackbody and Comptonized components (which they refer to as an extended accretion disk corona model) over one where the emission is from a multi-color disk and Comptonization. However, Sriram et al. 2011 found by analyzing RXTE data that the multi-color disk and Comptonization component provided an acceptable fit and found evidence for the variation in the inner disk radius. They also showed the r.m.s of the QPOs observed in both the normal and horizontal branches increase with energy suggesting a origin in the inner regions. A more extensive work involving a larger number of RXTE observations confirmed these basic results (Sriram et al. 2012). However, we note that such analysis were hampered by the absence of data below 3 keV. NuSTAR observation (again limited to energies above 3 keV) of GX 5-1 also showed a black-body component with temperature 2.5 keV at the horizontal branch, which was interpreted as a boundary layer component (Homan et al. 2018).
AstroSat is the first Indian Multi-wavelength satellite. The Large Area X-ray Proportional Counters (LAXPC) consists of 3 identical proportionals counter units (PCUs) having a total effective area 6000 at 15 keV and provides event data list which can be used effectively to compute PDS for different energy bands (Yadav et al. 2016a; Agrawal et al. 2017; Antia et al. 2017). The LAXPC is well complimented by the Soft X-ray Telescope (SXT) providing simultaneous coverage in the soft energy band (Singh et al. 2017). The LAXPC has already provided unprecedented data to study the rapid temporal behaviour of black hole systems (Yadav et al. 2016b; Misra et al. 2017; Bhargava et al. 2017; Pahari et al. 2018). It has detected kHz QPOs and burst oscillation from the neutron star system 4U 1728-34 (Verdhan Chauhan et al. 2017) and has provided detailed information on the source’s thermo-nuclear bursts (Bhattacharyya et al. 2018). Spectral and timing properties of the Atoll Source 4U 1705-44 along the banana track have been characterized by LAXPC (Agrawal et al. 2018). One of the primary advantage of studying neutron star systems such as GX 5-1 by AstroSat is the simultaneous broad band spectral data ( keV provided by LAXPC and SXT) with high resolution timing data. This provides an unique opportunity to study the connection between the temporal (long and short term) properties of the source with the spectral components.
In this work, we present results of AstroSat data analysis of the Z-source GX 5-1. To the best of our knowledge this is the first time that both LAXPC and SXT data have been used to track a neutron star source as it evolves in its hardness diagram. The timing information from LAXPC is combined with the wide band spectra of the LAXPC/SXT to model the spectral and temporal evolution of this source.


2 Observations and data analysis
GX 5-1 was observed by AstroSat from February 26, 2017 17:34:56 till February 27, 2017 06:45:17 for an effective exposure time of 35 ks. The LAXPC data were analysed using the LAXPCsoftware (http://astrosat-ssc.iucaa.in/?q=laxpcData) to obtain background subtracted light curves, photon spectra, power density spectra and frequency dependent time-lags. To take into account LAXPC response uncertainties a systematic error of 3% was used for spectral fitting. The LAXPC spectra were fitted from 3-20 keV since the data was background dominated at higher energies. The SXT spectra and lightcurves were extracted using XSELECT (XSELECT V2.4d) from level-2 data. A circular region with a 12’ radius was used for source extraction. Due to uncertainties in the effective area and response, the SXT spectra were considered in the energy range 0.8-6 keV and a gain fit correction was included. Simultaneously spectral fitting for both the instruments were carried out using XSPEC version 12.9.1.
Figure 1 shows the LAXPC and SXT background lightcurves binned to 2.3778 seconds i.e at the SXT time resolution. The LAXPC lightcurve is the sum of all three detectors and is for the energy range 3-20 keV while for SXT it is 0.8-6 keV. Data gaps are due to SAA passages, earth occult and instrument shutdowns. SXT operation are at night time and hence its efficiency in viewing is less than that of LAXPC. The vertical lines mark the common time for the two instruments and as described in the next section, spectral analysis has been done for strict simultaneous data.
We define hardness as the ratio between the LAXPC count rates in 8-20 keV range divided by that in the 3-8 keV. The hardness was computed for 60 second time bins and is plotted against the total count rate (or intensity) in the 3-20 keV band in Figure 2. In such a hardness intensity diagram (HID), portions of the Z-track are clearly distinguished. The source shows an extended horizontal branch, a hard apex and a normal branch. No flaring branch is seen for this observation. The normal branch corresponds to the start of the observation when in a time-scale of a few ksecs the source traced out the entire branch. For most of the observation the source was in the hard apex and horizontal branch.
For spectral and timing analysis we split the Z-track into six distinct regions. The horizontal branch was split into three regions named them HB-1, HB-2 and HB-3. The hard apex region was named HA and the normal branch was split into two: lower (LNB) and upper (UNB) normal branch. The selected regions for the horizontal and normal branches are shown as rectangular boxes in Figure 2. The remaining part of the HID was marked as hard apex HA. The regions have been chosen to roughly span the Z-track and the effective exposure times for simultaneous LAXPC and SXT data of the LNB, UNB, HA, HB-1,HB-2 and HB-3 are 1080, 2140 ,3557, 490, 484 and 304 seconds respectively.
| Location | |||||||||
|---|---|---|---|---|---|---|---|---|---|
| LNB | 1.35/523 | ||||||||
| ∗∗UNB | 17.31 | 0.82/24 | |||||||
| HA | 1.67/546 | ||||||||
| HB1 | 1.15/547 | ||||||||
| HB2 | 1.13/523 | ||||||||
| HB3 | 1.07/428 |


3 Spectral analysis and results
Spectral fitting was undertaken for each of the six different locations along the Z-track. For each location only that time-segment which was strictly simultaneous with an SXT observation was taken into consideration. This is illustrated in Figure 1, where the vertical lines mark the time for which spectra were analyzed. The exception was for the upper normal branch (UNB) where there are no corresponding SXT observation and thus for this segment, only the LAXPC data was considered.
We first fitted a two component model consisting of a Comptonized component and a blackbody one represented by the XSPEC routine “nthcomp” and “bbodyrad” respectively. The absorption was taken into account by the XSPEC routine “tbabs”. The black body was assumed to be the seed photon source of the Comptonizing medium i.e. the temperature of the blackbody was tied to the input seed photon temperature during fitting and the shape of the seed photon was taken to be blackbody. While the fit produced reasonable , the normalization of the blackbody component was extremely high. Since the normalization of the routine “bbodyrad” represents the radius of the black body sphere (), we found that for a distance of kpc, the radius turned out to have an unphysically large value of 2000 km or more. This is true for all the segments considered with SXT data.
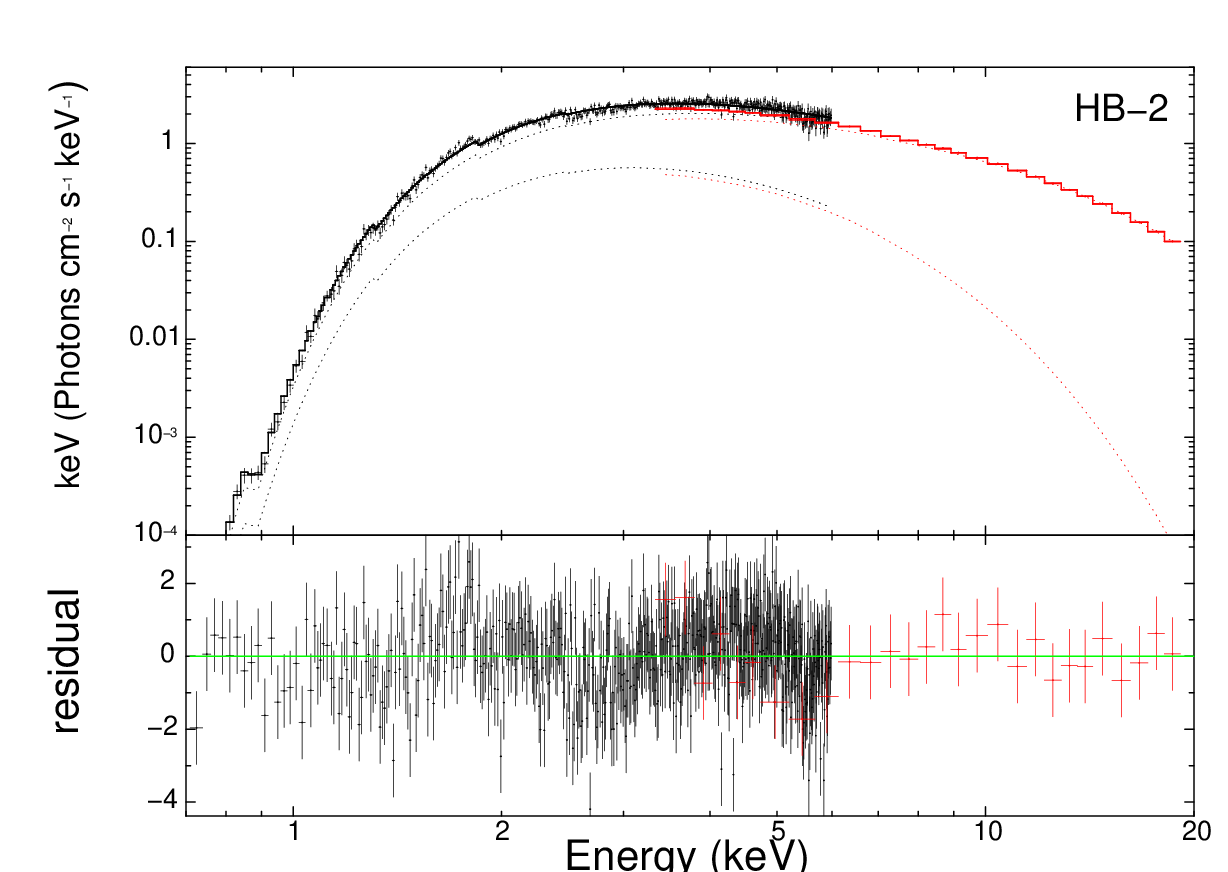
Our favoured model is the one where the blackbody is replaced by a multi-colour disk blackbody(XSPEC routine: “diskbb”) and the form of the seed photon for the Comptonization is taken to be such a disk emission. The best fit parameters for the model are tabulated in Table 1 and a typical unfolded spectra with residuals is shown in Figure 3. The parameters are the normalization of the disk component , the inner disk temperature , the temperature of the Comptonizing medium and the photon index of the Comptonized component. The disk normalization is related to inner disk radius (in kms) by , where is the distance to the source in units of 10 kpc and is the inclination angle of the disk. The best fit values of the normalization are , indicating reasonable values of the inner disk radius of kms. Note that the disk normalization and the absorption column density could not be constrained for the UNB due to absence of SXT data and for that spectrum the normalization and column density was fixed. Hence the UNB has been excluded from further analysis.
We note that there have been several works where more complex models have been invoked to fit the spectra from such sources (Homan et al. 2018; Lin et al. 2009, e.g.). In general, these models have three components instead of the two used here and hence we tested the possibility of including another component. Specifically, we added an additional blackbody emission in the model consisting of disk emission and thermal Comptonization. We find that for all the spectra considered the decrease in is less than 3 and hence the data does not justify the inclusion of a third component. We have also tried other variations of the three component model, such as assuming that the seed photon for the thermal component is due to the blackbody instead of the disk, but again find no significant improvement in the fitting. We note that despite having a broader energy coverage than RXTE, we are unable to justify the use of more complex three component models as used by Lin et al. 2009. We suspect that the 3% systematic that is included for the LAXPC and SXT spectra, does not allow for more complex model to be constrained and discuss the implication of this in the last section.
The unabsorbed bolometric fluxes (in the 0.001-100 keV range) was computed using the XSPEC function “cflux” for the total and for the disk component. The total flux and the ratio of the disk flux to the total and (which we call the disk flux ratio) are tabulated in Table 1. While the total flux varies non-uniformly, the disk flux ratio has a remarkable monotonous behaviour as increasing along the horizontal and the normal branch in a uniform manner. This is illustrated more clearly in the left panel of Figure 4, where the hardness ratio (8-20 keV by 3-8 keV) of the segment is plotted against the disk flux ratio. Thus, the location of the source in the horizontal and normal branches is determined by the value of the disk flux ratio making it the single parameter determining the spectral state of the system. We also note that the disk flux itself is found to be proportional to the disk flux ratio as shown in the right panel of Figure 4. The disk flux itself maybe the main driver behind the variability, a point which is discussed in the last section. There is no significant qualitative variation in the Comptonization parameters namely the electron temperature, and photon index, .
The inner disk radius shows variability, which is more clearly exhibited by plotting the inner disk temperature versus the disk flux as shown in Figure 5. For a constant inner radius the flux should scale as , but instead the flux scales more steeply as . It may also be possible and perhaps more likely that the colour factor of the disk is changing (perhaps due to irradiation) causing this steeper variation, while the inner disk radius is more or less constant. On the other hand, this may also indicate that the model used here is simple and a more complex spectral model may be needed.
| Location | HA | HB-1 | HB-2 | HB-3 | |
|---|---|---|---|---|---|
| 0 | 0 | 0 | 0 | 0 | |
| - | - | - | |||
| - | - | - | |||
| - | - | - | |||
| - | - | ||||
| - | - | ||||
| - | - |


4 Timing analysis
Power density spectra (PDS) were computed for each of the Z-track sections in the 3-20 keV band. All three LAXPC counters were used in the timing analysis and the expected dead time corrected Poisson noise level was subtracted from each power spectra which were normalized such that the integration of the power spectra gave the fractional root mean square (r.m.s) variation. The top panel of Figure 6 shows the power spectra for the three sections of the horizontal branch. A clear QPO is detected which dominates the power spectra. The power spectra were fitted using three Lorentzians corresponding to the QPO, its harmonic and a zero centered low frequency broad band noise for the horizontal Branch sections. For the Hard Apex and normal branch, the harmonic is not seen while another broad feature at Hz is required by the data. The best fit values of the fitting are tabulated in Table 2. For the normal Branch, the QPO was not detected in the individual two sections, due to the shorter exposure time and hence we combined the two section into one and the power spectrum is shown in the right bottom panel of Figure 6. We note that the low frequency component has significantly increased during the normal branch. The QPO frequency increases monotonically along the horizontal to the normal branch as can be seen in top panel of Figure 9, where the frequency is plotted against disk flux ratio. However, its fractional r.m.s decreases (bottom panel of Figure 9).
The Event mode data of LAXPC allows for computing the temporal properties in several energy bins. Power spectra were analysed for different energy bins and the fractional r.m.s obtained from fitting a Lorentzian to the QPO was estimated for the different energy bins. Figure 7 shows the variation of the fractional r.m.s with energy for the three sections of the horizontal Branch and the Hard Apex. The statistics for the normal branch was not good enough to do such an analysis. The variation of r.m.s with energy is similar for all the sections. It increases with energy and its functional dependence can be described as .
LAXPC data also allows the computation of the time-lag as a function of energy. To compute the time-lag the Fourier transforms were undertaken with a frequency bin equal to the FWHM of the QPO and lags were computed at the QPO frequency with respect to the reference energy band of 5-7 keV. Figure 8 shows the time-lag as a function of energy for the different sections of the horizontal branch and the Hard Apex. It seems that the horizontal branch segments show positive hard time-lag (i.e. the high energy photons are delayed compared to the soft) while for the Hard Apex it is the opposite. The positive time-lag seen in the HB does not seem not seem to be correlated with the position in the Z-track. However, since the statistics are not good this may not be significant and we caution against over interpretation. What is clear is that the magnitude of the time-lags are less than a few milli-seconds.
5 Summary and discussion
We present the analysis of an AstroSAT observation of the Z-track source GX 5-1. We used the strictly simultaneous SXT and LAXPC data to track the spectrum of a neutron star source as it moves along its Hardness intensity diagram (HID) and at the same time quantify the rapid temporal variability of the source. During the observation, GX 5-1 tracked out the normal and horizontal branches in its HID which was divided into six segments and analyzed separately.
The primary results are:-
The broad band SXT/LAXPC spectra from 0.8-20 keV was fitted with an absorbed black body and thermal component, but the radius of the blackbody turned out to be unphysically large 2000 kms. On the other hand an absorbed disk emission and a thermal Comptonized component fitted the data well and the inner disk radii turned out to be reasonable i.e. kms. Thus the latter model was preferred.
The disk flux ratio defined as the ratio of the bolometric unabsorbed disk flux to the total unabsorbed flux, decreased monotonically along the horizontal branch to the normal one, indicating that this may be the primary driver which determines the location of the source in the Z diagram. However, we note that the disk flux itself is correlated with the disk flux ratio. The disk flux varies as indicative of a varying inner radius or changes in the colour factor.
The power spectra for all sections of the Z-track shows a QPO at Hz. The QPO is dominant in the horizontal branch while its strength decreases in the normal one, where the power spectrum also has a pronounced low frequency component. The QPO frequency increases, while its r.m.s decreases with disk flux ratio. The r.m.s of the QPO increases with energy ( ) for all sections of the Z-track. The time lags between different energy bins are constrained to be less than a few milliseconds.
One of the important clues regarding the temporal behaviour of these systems is to identify the physical parameter (or at least the spectral parameter) that determines the source’s position in the HID diagram. Our results suggest that this may be related to the disk flux ratio. Thus the difference in hardness for horizontal and normal branches (at the same intensity level) is the contribution of the disk to the total flux. It is interesting to note that there is also a correlation between the disk flux and the disk flux ratio, perhaps indicating that the disk flux itself is the primary driver. If that is the case, and if we assume that the inner disk radii do not vary much, then the disk flux would be proportional to the accretion rate, and one could get back the physically attractive proposition, that the accretion rate itself determines the state of the system. However, this implies that the total flux, and in particular, the flux of the thermal Comptonization component does not scale with the accretion rate. For a neutron star system with a surface, one expects the total flux to be proportional to the accretion rate since unlike a black hole, the accretion efficiency cannot be small due to advection. On the other hand, if a significant amount of energy or matter is given out to a jet or wind, then the radiative flux may indeed not be proportional to the accretion rate. Such a speculation needs to be followed up with evidence for jet or wind activity perhaps in non X-ray wavebands.
The spectral analysis undertaken in this work seems to imply that there are only two spectral components, namely the disk emission and a thermal component. This is in contrast to other works (Lin et al. 2009, e.g), where a third blackbody component has been included even though the energy band used in this work keV is broader than that of the RXTE analysis keV. Note that for spectral analysis of RXTE data, the column density was taken to be fixed, while here the presence of low energy data allows us to constrain it. It is not clear, whether the broader energy band constrains the fitting to have lesser number of components or if the systematics used for the fitting (3%) is too large to discriminate between complex models. This may be the reason why in this analysis the disk flux does not scale as temperature to the fourth power, while the analysis of Lin et al. 2009 showed such a scaling for the three component model. Low energy spectral coverage from data from other instruments like NICER will be useful to determine whether the spectra is a simple or complex one.
The rapid temporal behaviour of the source shows a strong QPO at Hz whose frequency increases, while its r.m.s decreases with the disk flux ratio. Energy dependent analysis of the QPO reveals that the r.m.s is an increasing function of energy and time-lags between high and low energy photons are less than a few milliseconds. This implies that the QPO originates in the thermal Comptonized component and it weakens when the component is less dominant as has been shown earlier using RXTE data (Sriram et al. 2011). Detailed radiative modelling of the these energy dependent properties will shed light on the driver and the geometry of the system. The QPO frequency should be associated with some characteristic time-scale of the system, which in turn may be related to come characteristic radius. Since the time-scale should decrease with radius, the frequency should be inversely proportional to such a radius. It is tempting to associate this radius with the inner disk one. While the inner disk radius estimated in the spectral fitting maybe subjected to several uncertainties like the spectral model used, color factor etc, it is interesting to see the correlation between the frequency and disk flux ratio. This is qualitatively expected if the disk flux ratio is inversely related to the inner disk radius.
The broad band spectral coverage provided by SXT/LAXPC along with the rapid timing capabilities of the LAXPC has provided a unique opportunity to study these neutron star systems. Note for example, that when there was no simultaneous SXT spectrum for the upper section of the normal Branch, the disk normalization and absorption column density was not constrained, which highlights the importance of SXT for such analysis. Indeed, other observations by AstroSat of GX 5-1 and other such sources will provide insight into their temporal behaviour.
6 Acknowledgments
We thanks to members of LAXPC instrument team for their contribution to the development of the LAXPC instrument. We also acknowledge contributions of the AstroSat project team at ISAC. This paper makes use of data from the AstroSat mission of the Indian Space Research Organisation (ISRO), archived at the Indian Space Science Data Centre (ISSDC). We also acknowledge support of LAXPC POC as well as SXT POC at TIFR.
References
- Agrawal et al. (2017) Agrawal, P. C., Yadav, J. S., Antia, H. M., et al. 2017, Journal of Astrophysics and Astronomy, 38, 30
- Agrawal & Bhattacharyya (2003) Agrawal, V. K., & Bhattacharyya, S. 2003, A&A, 398, 223
- Agrawal & Misra (2009) Agrawal, V. K., & Misra, R. 2009, MNRAS, 398, 1352
- Agrawal et al. (2018) Agrawal, V. K., Nandi, A., Girish, V., & Ramadevi, M. C. 2018, MNRAS, 477, 5437
- Agrawal & Sreekumar (2003) Agrawal, V. K., & Sreekumar, P. 2003, MNRAS, 346, 933
- Antia et al. (2017) Antia, H. M., Yadav, J. S., Agrawal, P. C., et al. 2017, ApJS, 231, 10
- Armas Padilla et al. (2017) Armas Padilla, M., Ueda, Y., Hori, T., Shidatsu, M., & Muñoz-Darias, T. 2017, MNRAS, 467, 290
- Barret et al. (1999) Barret, D., Grindlay, J. E., Harrus, I. M., & Olive, J. F. 1999, A&A, 341, 789
- Barret et al. (2005) Barret, D., Olive, J.-F., & Miller, M. C. 2005, MNRAS, 361, 855
- Bhargava et al. (2017) Bhargava, Y., Rao, A. R., Singh, K. P., et al. 2017, ApJ, 849, 141
- Bhattacharyya et al. (2018) Bhattacharyya, S., Yadav, J. S., Sridhar, N., et al. 2018, arXiv:1805.05393
- Blom et al. (1993) Blom, J. J., Int-Zand, J. J. M., Heise, J., et al. 1993, A&A, 277, 77
- Church & Bałucińska-Church (2004) Church, M. J., & Bałucińska-Church, M. 2004, MNRAS, 348, 955
- Church et al. (2014) Church, M. J., Gibiec, A., & Bałucińska-Church, M. 2014, MNRAS, 438, 2784
- Church et al. (2012) Church, M. J., Gibiec, A., Bałucińska-Church, M., & Jackson, N. K. 2012, A&A, 546, A35
- Díaz Trigo et al. (2017) Díaz Trigo, M., Migliari, S., Miller-Jones, J. C. A., et al. 2017, A&A, 600, A8
- Falanga et al. (2006) Falanga, M., Goetz, D., Goldoni, P., et al. 2006, VizieR Online Data Catalog, 345
- Giacconi et al. (1962) Giacconi, R., Gursky, H., Paolini, F. R., & Rossi, B. B. 1962, Physical Review Letters, 9, 439
- Gilfanov et al. (2003) Gilfanov, M., Revnivtsev, M., & Molkov, S. 2003, A&A, 410, 217
- Hanawa (1989) Hanawa, T. 1989, ApJ, 341, 948
- Hasinger & van der Klis (1989) Hasinger, G., & van der Klis, M. 1989, A&A, 225, 79
- Homan et al. (2018) Homan, J., Steiner, J. F., Lin, D., et al. 2018, ApJ, 853, 157
- Homan et al. (2007) Homan, J., van der Klis, M., Wijnands, R., et al. 2007, ApJ, 656, 420
- Iaria et al. (2004) Iaria, R., Di Salvo, T., Robba, N. R., et al. 2004, ApJ, 600, 358
- Jackson et al. (2009) Jackson, N. K., Church, M. J., & Bałucińska-Church, M. 2009, A&A, 494, 1059
- Jonker et al. (2002) Jonker, P. G., van der Klis, M., Homan, J., et al. 2002, MNRAS, 333, 665
- Konar & Bhattacharya (1999) Konar, S., & Bhattacharya, D. 1999, MNRAS, 308, 795
- Kong et al. (2006) Kong, A. K. H., Charles, P. A., Homer, L., Kuulkers, E., & O’Donoghue, D. 2006, MNRAS, 368, 781
- Kuulkers et al. (2002) Kuulkers, E., Homan, J., van der Klis, M., Lewin, W. H. G., & Méndez, M. 2002, A&A, 382, 947
- Kuulkers & van der Klis (2000) Kuulkers, E., & van der Klis, M. 2000, in Rossi2000: Astrophysics with the Rossi X-ray Timing Explorer, ed. T. E. Strohmayer, 72
- Kuulkers et al. (1994) Kuulkers, E., van der Klis, M., Oosterbroek, T., et al. 1994, A&A, 289, 795
- Kuulkers et al. (1996) Kuulkers, E., van der Klis, M., & Vaughan, B. A. 1996, A&A, 311, 197
- Lamb (1991) Lamb, D. Q. 1991, PASP, 103, 760
- Lavagetto et al. (2008) Lavagetto, G., Iaria, R., D’Ai, A., di Salvo, T., & Robba, N. R. 2008, Chinese Journal of Astronomy and Astrophysics Supplement, 8, 325
- Lei et al. (2013) Lei, Y.-J., Zhang, H.-T., Zhang, C.-M., et al. 2013, AJ, 146, 60
- Lei et al. (2015) Lei, Y., Zhang, H., & zhang, Y. 2015, IAU General Assembly, 22, 2257059
- Lewin et al. (1992) Lewin, W. H. G., Lubin, L. M., Tan, J., et al. 1992, MNRAS, 256, 545
- Lin et al. (2009) Lin, D., Remillard, R. A., & Homan, J. 2009, in American Astronomical Society Meeting Abstracts, Vol. 213, American Astronomical Society Meeting Abstracts #213, 603.03
- Makishima et al. (1986) Makishima, K., Maejima, Y., Mitsuda, K., et al. 1986, ApJ, 308, 635
- Méndez (2000) Méndez, M. 2000, Nuclear Physics B Proceedings Supplements, 80, 15
- Méndez & van der Klis (1999) Méndez, M., & van der Klis, M. 1999, ApJ, 517, L51
- Méndez et al. (2001) Méndez, M., van der Klis, M., & Ford, E. C. 2001, ApJ, 561, 1016
- Migliari et al. (2003) Migliari, S., Fender, R. P., Rupen, M., et al. 2003, MNRAS, 342, L67
- Misra et al. (2017) Misra, R., Yadav, J. S., Verdhan Chauhan, J., et al. 2017, ApJ, 835, 195
- Mitsuda et al. (1989) Mitsuda, K., Inoue, H., Nakamura, N., & Tanaka, Y. 1989, PASJ, 41, 97
- Mitsuda et al. (1984) Mitsuda, K., Inoue, H., Koyama, K., et al. 1984, PASJ, 36, 741
- Mondal et al. (2018) Mondal, A. S., Dewangan, G. C., Pahari, M., & Raychaudhuri, B. 2018, MNRAS, 474, 2064
- Pahari et al. (2018) Pahari, M., Yadav, J. S., Verdhan Chauhan, J., et al. 2018, ApJ, 853, L11
- Paul & Naik (2011) Paul, B., & Naik, S. 2011, Bulletin of the Astronomical Society of India, 39, 429
- Penninx et al. (1991) Penninx, W., Lewin, W. H. G., Tan, J., et al. 1991, MNRAS, 249, 113
- Popham & Sunyaev (2001) Popham, R., & Sunyaev, R. 2001, X-ray Astronomy: Stellar Endpoints, AGN, and the Diffuse X-ray Background, 599, 870
- Priedhorsky et al. (1986) Priedhorsky, W., Hasinger, G., Lewin, W. H. G., et al. 1986, ApJ, 306, L91
- Raichur et al. (2011) Raichur, H., Misra, R., & Dewangan, G. 2011, MNRAS, 416, 637
- Sakurai et al. (2012) Sakurai, S., Yamada, S., Torii, S., et al. 2012, PASJ, 64, 72
- Schulz et al. (2009) Schulz, N. S., Huenemoerder, D. P., Ji, L., et al. 2009, ApJ, 692, L80
- Seifina et al. (2013) Seifina, E., Titarchuk, L., & Frontera, F. 2013, ApJ, 766, 63
- Singh et al. (2017) Singh, K. P., Stewart, G. C., Westergaard, N. J., et al. 2017, Journal of Astrophysics and Astronomy, 38, 29
- Sriram et al. (2012) Sriram, K., Choi, C. S., & Rao, A. R. 2012, ApJS, 200, 16
- Sriram et al. (2011) Sriram, K., Rao, A. R., & Choi, C. S. 2011, ApJ, 743, L31
- Titarchuk et al. (2001) Titarchuk, L. G., Bradshaw, C. F., Geldzahler, B. J., & Fomalont, E. B. 2001, ApJ, 555, L45
- Titarchuk et al. (1998) Titarchuk, L., Lapidus, I., & Muslimov, A. 1998, ApJ, 499, 315
- van der Klis (2000) van der Klis, M. 2000, ARA&A, 38, 717
- van der Klis et al. (1987) van der Klis, M., Hasinger, G., Stella, L., et al. 1987, ApJ, 319, L13
- van der Klis et al. (1985) van der Klis, M., Jansen, F., van Paradijs, J., et al. 1985, IAU Circ., 4140
- Vaughan et al. (1994) Vaughan, B., van der Klis, M., Lewin, W. H. G., et al. 1994, ApJ, 421, 738
- Verdhan Chauhan et al. (2017) Verdhan Chauhan, J., Yadav, J. S., Misra, R., et al. 2017, ApJ, 841, 41
- Wang (2016) Wang, J. 2016, International Journal of Astronomy and Astrophysics, 6, 82
- White et al. (1988) White, N. E., Stella, L., & Parmar, A. N. 1988, ApJ, 324, 363
- Wijnands et al. (1998) Wijnands, R., Méndez, M., van der Klis, M., et al. 1998, ApJ, 504, L35
- Wijnands & van der Klis (1999) Wijnands, R., & van der Klis, M. 1999, ApJ, 514, 939
- Yadav et al. (2016a) Yadav, J. S., Misra, R., Verdhan Chauhan, J., et al. 2016a, ApJ, 833, 27
- Yadav et al. (2016b) Yadav, J. S., Agrawal, P. C., Antia, H. M., et al. 2016b, in Proc. SPIE, Vol. 9905, Space Telescopes and Instrumentation 2016: Ultraviolet to Gamma Ray, 99051D