Constraining the Active Galactic Nucleus and Starburst Properties of the IR-luminous Quasar Host Galaxy APM 082795255 at Redshift 4 with SOFIANote: Accepted to ApJ
Abstract
We present far-IR photometry and infrared spectrum of the = 3.9114 quasar/starburst composite system APM 082795255 obtained using the Stratospheric Observatory for Infrared Astronomy (SOFIA)/HAWC and the Spitzer Space Telescope Infrared Spectrograph (IRS). We decompose the IR-to-radio spectral energy distribution (SED), sampled in 51 bands, using (i) a model comprised of two-temperature modified blackbodies (MBB) and radio power-laws and (ii) a semi-analytic model, which also accounts for emission from a clumpy torus. The latter is more realistic but requires a well-sampled SED, as possible here. In the former model, we find temperatures of = 296 K and = 110 K for the warm and cold dust components, respectively. This model suggests that the cold dust component dominates the FIR energy budget (66%) but contributes only 17% to the total IR luminosity. Based on the torus models, we infer an inclination angle of = 15 and the presence of silicate emission, in accordance with the Type-1 active galactic nucleus nature of APM 082795255. Accounting for the torus’ contribution to the FIR luminosity, we find a lensing-corrected star formation rate of SFR = yr-1. We find that the central quasar contributes 30% to the FIR luminosity but dominates the total IR luminosity (93%). The 30% correction is in contrast to the 90% reported in previous work. In addition, the IR luminosity inferred from the torus model is a factor of two higher. These differences highlight the importance of adopting physically motivated models to properly account for IR emission in high- quasars, which is now possible with SOFIA/HAWC+.
Subject headings
infrared: galaxies – galaxies: high-redshift – galaxies: ISM – galaxies: evolution – galaxies: quasars – galaxies: starburstI. Introduction
Active galactic nucleus (AGN)-starburst galaxies at high redshifts are powerful probes of the early evolution of black holes (BH) and galaxy assembly, and they may be the progenitors of present-day massive spheroidal galaxies. Circumstantial evidence such as the tight BH mass-host properties relations observed in the nearby universe (e.g., and ) and the similar trends found between the cosmic star formation rate (SFR) and BH accretion rate histories suggest that the growth of supermassive BHs (SMBHs) and their host galaxies are tightly linked (and possibly causally linked; see reviews by Alexander & Hickox 2012; Heckman & Best 2014; Madau & Dickinson 2014, and, e.g., Sparre et al. 2015 for evidence from simulations). The leading SMBH-host co-evolution picture suggests that galaxies evolve via hierarchical galaxy mergers, in which massive galaxies evolve from a starburst-dominated phase to a quasar-dominated phase and finally settle as ‘red and dead’ spheroidal galaxies (Sanders et al. 1988; Di Matteo et al. 2005; Hopkins & Beacom 2006; Hopkins et al. 2008; Treister et al. 2010; Narayanan et al. 2010; Page et al. 2012, e.g.,). Recent studies report that many of the most luminous AGNs at high redshift appear to be offset from the local BH-host relations, where high- AGNs appear to have more massive black holes than expected given their host galaxy properties (e.g., Walter et al. 2004; Riechers et al. 2008a; Riechers et al. 2008b; Merloni et al. 2010; Wang et al. 2013). This offset suggests that AGNs and their host galaxies may not grow “in tandem”, especially during their peak phases of activity ( = 14). Currently, we still lack a clear picture relating the interplay between AGN activity and star formation in their host galaxies at early cosmic epochs, which is essential for understanding their formation and evolution. In theory, useful insights can be gained by determining how the far-infrared (FIR) luminosity (which depends on the AGN accretion rate and SFR), the interstellar medium (ISM) conditions, and morphology of AGN host galaxies differ between the quasar phase ( 1 4) and the present-day epoch and between the different phases of the starburst-quasar evolutionary sequence in the proposed SMBH-host co-evolution picture.
Previous studies indicate that 30% of high- quasars exhibit strong emission at (sub-)millimeter wavelengths (Chapman et al. 2005; Alexander et al. 2008; Coppin et al. 2008, e.g.,), indicating large quantities of dust contributing to IR luminosities of . The large IR luminosities in these quasars are commonly attributed to cold dust heated by their star formation, corresponding to SFRs of 1000 yr-1 (e.g., Wang et al. 2008). One of the key challenges in improving our understanding of the AGN-host co-evolution picture stems from the limited number of comprehensive studies that have measurements covering the rest-frame mid-IR parts of the dust spectral energy distributions (SEDs) of high- AGN-starburst systems, with only a few detections attained with The Infrared Astronomical Satellite (IRAS), the Spitzer Space Telescope, and the Herschel Space Observatory (Rowan-Robinson et al. 1991; Rowan-Robinson et al. 1993; Barvainis et al. 1995; Polletta et al. 2008, e.g.,). Thus, the fraction of the cold dust heated by young stars (and thus the SFR) in high- quasar hosts remains uncertain (Omont et al. 2003; Carilli et al. 2005; Netzer et al. 2014, e.g.,). By probing the hot and warm dust heated by the AGN in high- quasars, one can better understand the co-eval growth of SMBHs and their host galaxies in their early stages of evolution. In addition, determining the geometry of the dusty torus together with the host properties, one can investigate whether dust-obscured and unobscured AGNs in the early Universe represent quasars at different stages of evolution (Netzer 2015, see the review by) or whether they are simply a manifestation of different viewing geometries under the well-known AGN unification framework (Antonucci 1993; Urry & Padovani 1995, i.e., Type-1 versus Type-2 AGN; e.g.,).
In this paper, we demonstrate the new capabilities of the Stratospheric Observatory for Infrared Astronomy (SOFIA) enabled by the new sensitive FIR instrument, the High-resolution Airborne Wideband Camera (HAWC; Dowell et al. 2013; Harper et al. 2018), together with ancillary IR photometry, to constrain the AGN contribution to the IR luminosity of APM 082795255. The target is among the most apparently IR-luminous, gas-rich, strongly lensed AGN-starburst systems known to date, at a redshift of 3.91 (RA, Dec J2000 = 08h31m417, 5245′175; Egami et al. 2000; Weiß et al. 2007). Existing studies suggest that APM 082795255 is a rare starbursting quasar, in which both the AGN and host galaxy are undergoing extremely active phases, with an SFR of 5000 and an Eddington ratio of = 0.4 (Saturni et al. 2018). Since APM 082795255 is magnified by 4100 (Egami et al. 2000; Riechers et al. 2009), it has an apparent bolometric luminosity of = 7 (Irwin et al. 1998) and IR luminosity of 1015 -1 , making it one of the most ideal high- galaxies for a demonstration study for SOFIA/HAWC. Due to its extreme brightness, it is one of the best-studied high- objects and thus is currently one of the rare cases with a rich set of photometry. This enables more realistic SED modeling for this source for the first time, motivating our work presented here. Applying complex and realistic models to 0 AGNs has been done previously, but mainly out to 2 (Williams et al. 2018; Zhuang et al. 2018). While Leipski et al. 2014 and Lyu et al. 2016 use similar approaches to decompose the SEDs of 6 AGNs, these sources have less complete SED coverage than APM 082795255. In most cases, their IR SEDs are constrained by less than ten data points. By combining new SOFIA/HAWC+ photometry and a Spitzer/Infrared Spectrograph (IRS) spectrum with ancillary data covering multiple IR bands (Table 1), we improve constraints on the IR SED of APM 082795255 relative to previous work and model its SED with different AGN torus models to infer its torus properties.
This paper is structured as follows. In §II, we summarize the observations and procedures used to reduce the data. We also report ancillary data used in our analysis. In §III, we present the results. In §IV, we detail the SED modeling analysis. Finally, we discuss the results and implication of our findings in §V, and we summarize the main results and present our conclusions in §VI. Throughout this paper, we use a concordance CDM cosmology with parameters from the WMAP9 results: = km s-1 Mpc-1, = , and = (Hinshaw et al. 2013).
II. New Observations and Ancillary Data
II.1. New Data: Spitzer/IRS
Observations of APM 082795255 were carried out with the Infrared Spectrograph (IRS) onboard the Spitzer Space Telescope on 2008 December 4 for a total observing time of 4.5 hr (Program ID: 50784; PI: Riechers). The first order of the long wavelength, low resolution module (LL1: 19.538.0 ) was used, covering the rest-frame 6.7 polycyclic aromatic hydrocarbons (PAH) feature. These observations were obtained in spectral mapping mode, wherein the target was placed at six positions along the slit. The slit was positioned relative to a reference star using ‘‘high accuracy blue peak-up’’11 1 https://irsa.ipac.caltech.edu/data/SPITZER/docs/irs/irsinstrumenthandbook/85/.
The Basic Calibrated Data (BCD) files were produced by the Spitzer pipeline, which includes ramp fitting, dark sky subtraction, droop correction, linearity correction, flat-fielding, and wavelength calibration. Before spectral extraction, the two-dimensional dispersed frames were corrected for “rogue” (unstable) pixels using irsclean, latent charge removal and residual sky subtraction22 2 https://irsa.ipac.caltech.edu/data/SPITZER/docs/dataanalysistools/cookbook/23/. Sky frames at each map position is created by combining the corrected frames separately. Uncertainty frames associated with the combined frames were produced based on the variance of each pixel as a function of time in the sky frames. One-dimensional spectra were extracted at the position of the continuum emission using the (spice) software. A final spectrum was obtained by averaging over all map positions. Based on the residual sky background, the median noise of the final spectrum is 5.0 mJy per = 0.169 wavelength bin (observed-frame).
II.2. New Data: SOFIA/HAWC
Observations of APM 082795255 with SOFIA/HAWC were performed on 2017 October 18 at an altitude of 43,000 ft during cycle 5 (Program ID: 05_0165; PI: Riechers). A single pointing was used to observe at 53 (Band A), 89 (Band C), and 154 (Band D). Total Intensity observing in On-the-fly Mapping mode was used, producing a continuous telescope motion with 1.5 min Lissajous scans, covering (regions slightly smaller than) the standard HAWC fields-of-view (FoVs) of 27 17 (Band A), 42 26 (Band C), and 73 45 (Band D). Five scans corresponding to a total integration time of 333 s were obtained in Band A, 12 scans totaling 870 s in Band C, and 12 scans totaling to 936 s in Band D. The scans were centered in the middle of the R0/T0 subarrays. As such, the maps are made from R0/T0 only.
The observations were performed at elevation angles between 3037. No direct measure of Precipitable Water Vapor (PWV) was used in the calibration. Instead, the HAWC pipeline uses a standard atmospheric model (the ATRAN model; Lord 1992) to compute the predicted water vapor overburden at the zenith. The assumed zenith opacities are = 0.11, 0.21, 0.24 for Bands A, C, and D, respectively.
The data were reduced and processed using the crush33 3 http://www.sigmyne.com/crush/ software, in which an atmospheric correction based on the ATRAN model was applied. For flux calibration, we applied a fixed instrumental conversion factor to convert readout counts to janskys per pixel. The conversion factor was determined by comparing the readout counts to the true fluxes of the primary and secondary flux calibrators, Uranus and Neptune, using the Bendo et al. 2013 temperature model. In the post-processed images, the PSF FWHMs are 71, 110, and 195 at 53, 89, and 154 , respectively. After reduction, the pixel scales are 100, 155, and 275 for Bands A, C, and D, respectively.
II.3. Ancillary Data
In the analysis, we include photometry published in the literature, as listed in Table 1. These include photometry covering observed-frame NIR-to-radio wavebands.
We also report unpublished Spitzer Space Telescope/IRAC and MIPS photometry based on the Spitzer Enhanced Imaging Products (SEIP), which are available through the NASA/IPAC Infrared Science Archive (IRSA). The photometry in all IRAC bands reported in Table 1 was extracted using a 38 diameter aperture, with aperture corrections applied. The MIPS photometry at 24 was extracted through PSF-fitting to the high-S/N detection. We retrieved the Spitzer images from the Spitzer Heritage Archive.
We also report Herschel/PACS photometry, which are tabulated in the Herschel/PACS Point source catalog (HPPSC; Marton et al. 2017). PACS photometric maps were generated using the JScanam task within the Herschel Interactive Processing Environment (HIPE version 13.0.0; Ott 2010). Sources were identified using sussextractor, and the flux densities were obtained by performing aperture photometry.
Extraction of the Herschel/SPIRE photometry at 250, 350, and 500 (Table 1) was performed using sussextractor within HIPE version 15.0.1 on Level 2 SPIRE maps obtained from the Herschel Science Archive. These maps were reduced and processed using the SPIRE pipeline version SPGv14.1.0 within HIPE, with calibration tree SPIRE_CAL_14_3. The sussextractor task estimates the flux density from an image convolved with a kernel derived from the SPIRE beam. The flux densities measured by sussextractor were confirmed using the Timeline Fitter, which performs photometry by fitting a 2D elliptical Gaussian to the Level 1 data at the source position given by the output of sussextractor. The fluxes obtained from both methods are consistent within the uncertainties.
| Wavelength/Band | Frequency | Flux Density | Instrument/Band | Reference |
|---|---|---|---|---|
| () | (GHz) | (mJy) | ||
| 1.03 | 291060 | 5.00 0.16 | HST/NICMOS | 1 |
| 1.25 | 239834 | 7.19 0.20 | Keck I/NIRC | 2 |
| 1.55 | 193414 | 7.53 0.19 | HST/NICMOS | 1 |
| 1.65 | 181692 | 8.97 0.25 | Palomar/P200 InSb | 2 |
| 1.90 | 157786 | 7.81 0.96 | HST/NICMOS | 1 |
| 2.15 | 139438 | 9.40 0.26 | Palomar/P200 InSb | 2 |
| 3.4 | 88174 | 11.01 0.23 | WISE/W1 | 3† |
| 3.5 | 85650 | 27.3 1.0 | Palomar/P200 InSb | 2 |
| 3.8 | 79433 | 9.50 1.22 | Subaru/IRCS | 4 |
| 3.6 | 83275 | 10.74 0.0023 | Spitzer/IRAC | 3† |
| 4.5 | 66620 | 7.88 0.0021 | Spitzer/IRAC | 3† |
| 4.7 | 63994 | 7.20 1.98 | Subaru/IRCS | 4 |
| 4.6 | 65172 | 10.86 0.20 | WISE/W2 | 3† |
| 5.8 | 51688 | 15.49 0.007 | Spitzer/IRAC | 3† |
| 12 | 24983 | 62.92 0.927 | WISE/W3 | 3† |
| 12 | 24983 | 101 | IRAS | 5 |
| 12.5 | 24000 | 74 11 | Keck II/MIRLIN | 2 |
| 17.9 | 16750 | 103 50 | Keck II/MIRLIN | 2 |
| 22 | 13626 | 187.6 4.84 | WISE/W4 | 3† |
| 24 | 12491 | 186.8 0.779 | Spitzer/MIPS | 3† |
| 25 | 12000 | 226.1 16.2 | IRAS | 5 |
| 53 | 5656 | 567 71 | SOFIA/HAWC | 3 |
| 60 | 5000 | 511.1 51.1 | IRAS | 5 |
| 70 | 4283 | 654.1 8.745 | Herschel/PACS | 3 |
| 89 | 3368 | 682 50 | SOFIA/HAWC | 3 |
| 100 | 3000 | 951.1 228 | IRAS | 5 |
| 154 | 1947 | 696 43 | SOFIA/HAWC+ | 3 |
| 160 | 1874 | 758.8 13.2 | Herschel/PACS | 3 |
| 250 | 1200 | 627.2 8.1 | Herschel/SPIRE | 3 |
| 350 | 857 | 431.4 6.3 | Herschel/SPIRE | 3 |
| 350 | 850 | 386 32 | CSO/SHARC II | 6 |
| 450 | 660 | 342 26 | CSO/SHARC II | 6 |
| 450 | 660 | 285 11 | JCMT/SCUBA | 7 |
| 450 | 660 | 211 47 | JCMT/SCUBA | 8 |
| 500 | 600 | 249.6 8.1 | Herschel/SPIRE | 3 |
| 850 | 350 | 84 3 | JCMT/SCUBA | 7 |
| 850 | 350 | 75 4 | JCMT/SCUBA | 8 |
| 1194 | 251 | 34 0.55 | PdBI | 9 |
| 1219 | 245.905 | 31.4 2.0 | PdBI | 10 |
| 1266 | 236.797 | 26.6 1.3 | PdBI | 10 |
| 1350 | 225 | 24 2 | JCMT/SCUBA | 8 |
| 1400 | 214.0 | 17.0 0.5 | PdBI | 11 |
| 1400 | 211.1 | 16.9 2.5 | PdBI | 12 |
| 1490 | 201.166 | 16.5 0.8 | PdBI | 10 |
| 1958 | 153.132 | 5.4 0.3 | PdBI | 10 |
| 2710 | 110.7 | 2.17 0.19 | CARMA | 13 |
| 2760 | 108.6 | 2.08 0.22 | CARMA | 13 |
| 2840 | 105.4 | 2.04 0.08 | CARMA | 13 |
| 3200 | 94.3 | 1.2 0.3 | PdBI | 11 |
| 3200 | 93.879 | 1.3 0.2 | PdBI | 12 |
| 3200 | 93.856 | 1.1 0.02 | NOEMA | 14 |
| 3300 | 90.2 | 1.3 0.2 | PdBI | 12 |
| 3300 | 90.2 | 0.66 0.18 | PdBI | 15 |
| 7000 | 43.3 | 0.90 | VLA | 16 |
| 13000 | 23.4649 | 0.30 0.05 | VLA | 16 |
| 13000 | 23.4649 | 0.41 0.07 | VLA | 17 |
| 13000 | 23.4649 | 0.38 0.02 | VLA | 18 |
| 20000 | 14.9399 | 0.30 0.09 | VLA | 18 |
| 36000 | 8.4601 | 0.45 0.02 | VLA | 18 |
| 36000 | 8.4601 | 0.45 0.03 | VLA | 1 |
| 60000 | 4.5276 | 0.55 0.04 | VLA | 18 |
| 200000 | 1.400 | 1.16 0.03 | VLA | 18 |
| 200000 | 1.400 | 0.92 0.13 | VLA | 19 aaVLA FIRST Catalog Database version 2014dec17. |
| 900000 | 0.334 | 5.10 0.80 | VLA | 20 |
Note. — Uncertainties on the SPIRE flux densities include those due to confusion noise. Uncertainties quoted here for the radio and mm interferometric measurements do not include those from absolute flux calibration, but they are accounted for in the SED modeling.
References. — 1: Ibata et al. 1999; 2: Egami et al. 2000; 3: This work; 4: Oya et al. 2013; 5: Irwin et al. 1998; 6: Beelen et al. 2006; 7: Barvainis & Ivison 2002; 8: Lewis et al. 1998; 9: Lis et al. 2011; 10: van der Werf et al. 2011; 11: Downes et al. 1999; 12: Weiß et al. 2007; 13: Riechers et al. 2010; 14: Feruglio et al. 2017; 15: Wagg et al. 2005; 16: Papadopoulos et al. 2001; 17: Lewis et al. 2002; 18: Riechers et al. 2009; 19: Becker et al. 1994; 20: Ivison 2006
III. Results
We detect emission in all three bands covered by SOFIA/HAWC at high significance (Figure 1). Point-source photometry were extracted using PSF-fitting and are listed in Table 1. Fitting a power-law to the IRS spectrum yields .
The PAH feature at 6.2 covered by our IRS observations remains undetected down to a limit of 3.4 W cm-2 (Figure 2). This limit was calculated by considering the residual flux density after removing the continuum and assuming a linewidth covering rest-frame wavelengths from 5.96.5 . The continuum level was calculated by fitting a power-law over rest-frame wavelengths of 5.56.7 .

IV. Analysis: SED Modeling
IV.1. Analytic: Two-temperature MBB + Radio Power-laws
The IR-to-radio SED of APM 082795255 has been modeled previously by, e.g., Rowan-Robinson 2000, Beelen et al. 2006, Weiß et al. 2007, and Riechers et al. 2009; some of these models have their dust-emitting sizes () constrained through large velocity gradient (LVG) modeling of the multi- CO and HCN line ratios and spatially resolved CO imaging. Existing models show that the observed dust SED can only be adequately described by a model with at least two dust components — a warmer and a cooler dust component.
Weiß et al. 2007 adopted a model assuming that the overall size of the dust-emitting region is similar to that of the CO line emission, with relative area filling factors of = 0.75 and 0.25 for the warmer and cooler components, respectively, and a dust absorption coefficient of
| (1) |
where = 0.4 cm2/g, = 250 GHz, and the emissivity spectral index is fixed to . They find that the warmer component contributes 85% to the FIR luminosity ( = 2 1014 -1 ) and suggest that this component is heated by the central AGN. However, in these previous models, the parameters describing the warm dust peak relied heavily on the constraints imposed by the IRAS measurement at 100 , which has a 25% uncertainty due to the limited S/N and the very large IRAS beam and pixel sizes. Here, we update the SED by including our recently obtained SOFIA/HAWC data and additional photometry (e.g., Herschel) obtained after the Riechers et al. 2009 study, which extended the Weiß et al. 2007 study by also modeling the radio SED. We note an outlier44 4 This outlier is unlikely to result from contamination due to bright rest-frame optical lines, such as H, [N ii], [S ii], and [Ar iii], given that the broadband WISE/W1 flux would also be contaminated. at 3.5 of = 27.3 1.0 mJy, which was obtained with the Palomar Telescope (Egami et al. 2000).
Following Riechers et al. 2009, we first fit a simplified four-component model (two-temperature dust, free-free, and synchrotron) to the rest-frame FIR-to-radio photometry, covering observed frame 53 cm, to illustrate how well the previously employed functional form fits all of the data obtained to date. The functional form is expressed as follows:
| (2) |
where is the frequency in GHz, is a coefficient, is a spectral index, and represents either the flat (free-free) or steep (synchrotron) power-law components. The first term takes the functional form of a two-temperature MBB model, with each dust temperature component described by
| (3) |
where is the apparent solid angle (the magnification factor is absorbed into this parameter). The optical depth of each component is parameterized through the dust mass () and area filling factor ():
| (4) |
The area filling factor clearly takes a value in the interval [0, 1]. We define to reduce the extra dimension and degeneracies between and . For the second term of Equation 2, we adopt the best-fitting results from Riechers et al. 2009 since no new constraints are added to the radio SED in this work.
We impose uniform priors on the model parameters as follows: 10 K, K, F, F, 107 pc pc-2, and 104 pc1010 pc-2. We also impose the criterion that . These conditions are physically motivated based on previous results of Beelen et al. 2006 and Weiß et al. 2007. We find the best-fit model by sampling the posterior probability distributions (PDF) using a Markov Chain Monte Carlo (MCMC) approach.
After discarding the first 2000 iterations in the burn-in phase, we thin the chains via 40 iterations based on the auto-correlation time to obtain independent samples from the posterior PDFs, yielding a best-fit model with = 110 K, = 296 K, = 0.9, = 2.5 pc-2, and = 1.4 pc-2. The best-fit values and their uncertainties are quoted based on the 16th, 50th, and 84th percentiles of the PDFs (See Appendix). The best-fit SED is shown in Figure 3, where we overplot the model presented by Riechers et al. 200955 5 The apparent difference in the 59 fit shown here compared to Riechers et al. 2009 results from the fact that we adopt a source size of = 1150 pc, following Weiß et al. 2007. The 59 fit here therefore appears to undershoot the photometry at 100 . (hereafter, 59 fit) for comparison.
IV.2. Semi-analytic: Including Clumpy Torus Models
Previous works suggest that APM 082795255 is a typical example of a co-existing starburst and quasar in a galaxy, where its strong FIR luminosity due to cold dust emission has been attributed to the presence of a dust-obscured starburst, with a lensing-corrected SFR of 5000 yr-1. In such AGN host galaxies, hot dust emission with a characteristic temperature of K (e.g., Barvainis 1987; Deo et al. 2011) due to reprocessed X-ray-to-optical AGN radiation is expected to peak in the NIR between 1 and 3 , whereas warm dust emission from a dusty torus near the central AGN with characteristic temperature of K (Schartmann et al. 2005; Burtscher et al. 2015) should peak between 3 and 40 . Based on the observed SED (Figure 3), hot/warm dust emission due to a putative torus in APM 082795255 is likely an important contributor to its IR emission (since its IR SED clearly peaks around rest-frame 20 ). We thus describe the SED of APM 082795255 (including the IRS spectrum) using a physically motivated model, with the UV-to-MIR part corresponding to emission from the accretion disk and and clumpy torus around it, the FIR part described by a single-temperature MBB function, and the radio part corresponding to free-free and synchrotron emission. The cold dust and radio components are described using the same parameterization as Equations 2 and 3. For the dust component, we assume an opacity defined using Equation 1. The spectral index is fixed to 2.0, following Priddey & McMahon 2001, to minimize the number of free parameters. For the AGN/torus component, we employ SED grids derived by performing radiative transfer calculations of three-dimensional clumpy tori (Hönig & Kishimoto 2010). In this model, the optical depths and sizes of the dust clouds depend on their distance from the central source. The clouds are randomly placed according to a spatial distribution function. The torus SED is then calculated by summing the direct and indirect emission of the clumps. More specifically, the model parameterizes the distribution of dust clouds in the tori using five parameters: the radial dust-cloud distribution power-law index, ; the half-opening angle, (describing the vertical distribution of clouds); the average number of clouds along an equatorial line-of-sight, ; the total V-band optical depth, ; and the inclination angle, . The MIR SED is redder if more dust clouds are distributed at larger distances. Therefore, the power-law index is mostly constrained by the MIR photometry (a more negative would imply a more compact dust distribution; see Hönig et al. 2010 for details). The total number of clouds within the torus is thus related to through
| (5) |
where describes the cloud distribution in the -, -, and -space; is the sublimation radius of a given cloud; and is the volume of the torus. The torus models are scaled based on a luminosity factor (), which is the luminosity of the accretion disk. Physically, this determines the sublimation radius of the accretion disk/torus where dust clumps are distributed, according to the following scaling properties:
| (6) |
where is the sublimation temperature (Barvainis 1987, e.g.,). The numerical values in the denominators are the physical properties assumed in the model. In the fitting process, we rescale the model flux to the distance of APM 082795255. We initialize based on the apparent X-ray luminosity (210 keV; not lensing-corrected) of APM 082795255, which is = 49.4 (Gofford et al. 2015).
Since the Hönig et al. 2010 templates are calculated based on discrete model parameters, we interpolate the SED grids such that each parameter can be sampled as a continuous variable. This is done in order to determine the PDFs of the parameters and thus obtain reliable uncertainties on the model parameters. The parameters are interpolated in six dimensions (including the dimension of wavelength) within the following boundaries: [0, 10], , , [15, 90], and .
We place priors on the model parameters to ensure they are physically sensible. We place flat priors of on the dust mass and K on the dust temperature. The luminosity scaling factor is allowed to vary between . In addition to unobscured torus emission, stellar emission from the host galaxy may be significant shortward of rest-frame . Modeling the stellar emission would require introducing multiple additional free parameters and properly accounting for potential differential magnification of each of the components. Thus, for simplicity, we fit the models to the photometry longward of 1 m only.
The above model fails to yield a good fit to the NIR photometry — the torus component is skewed to the rest-frame NIR wavebands and over-predicts the fluxes observed in near- and mid-IR bands (top panel of Figure 4). Motivated by the work of Leipski et al. 2014, we add an additional hot dust component to the overall model. For this hot dust component, we place flat priors of pc on its emitting radius, on its dust mass, and K on its temperature.
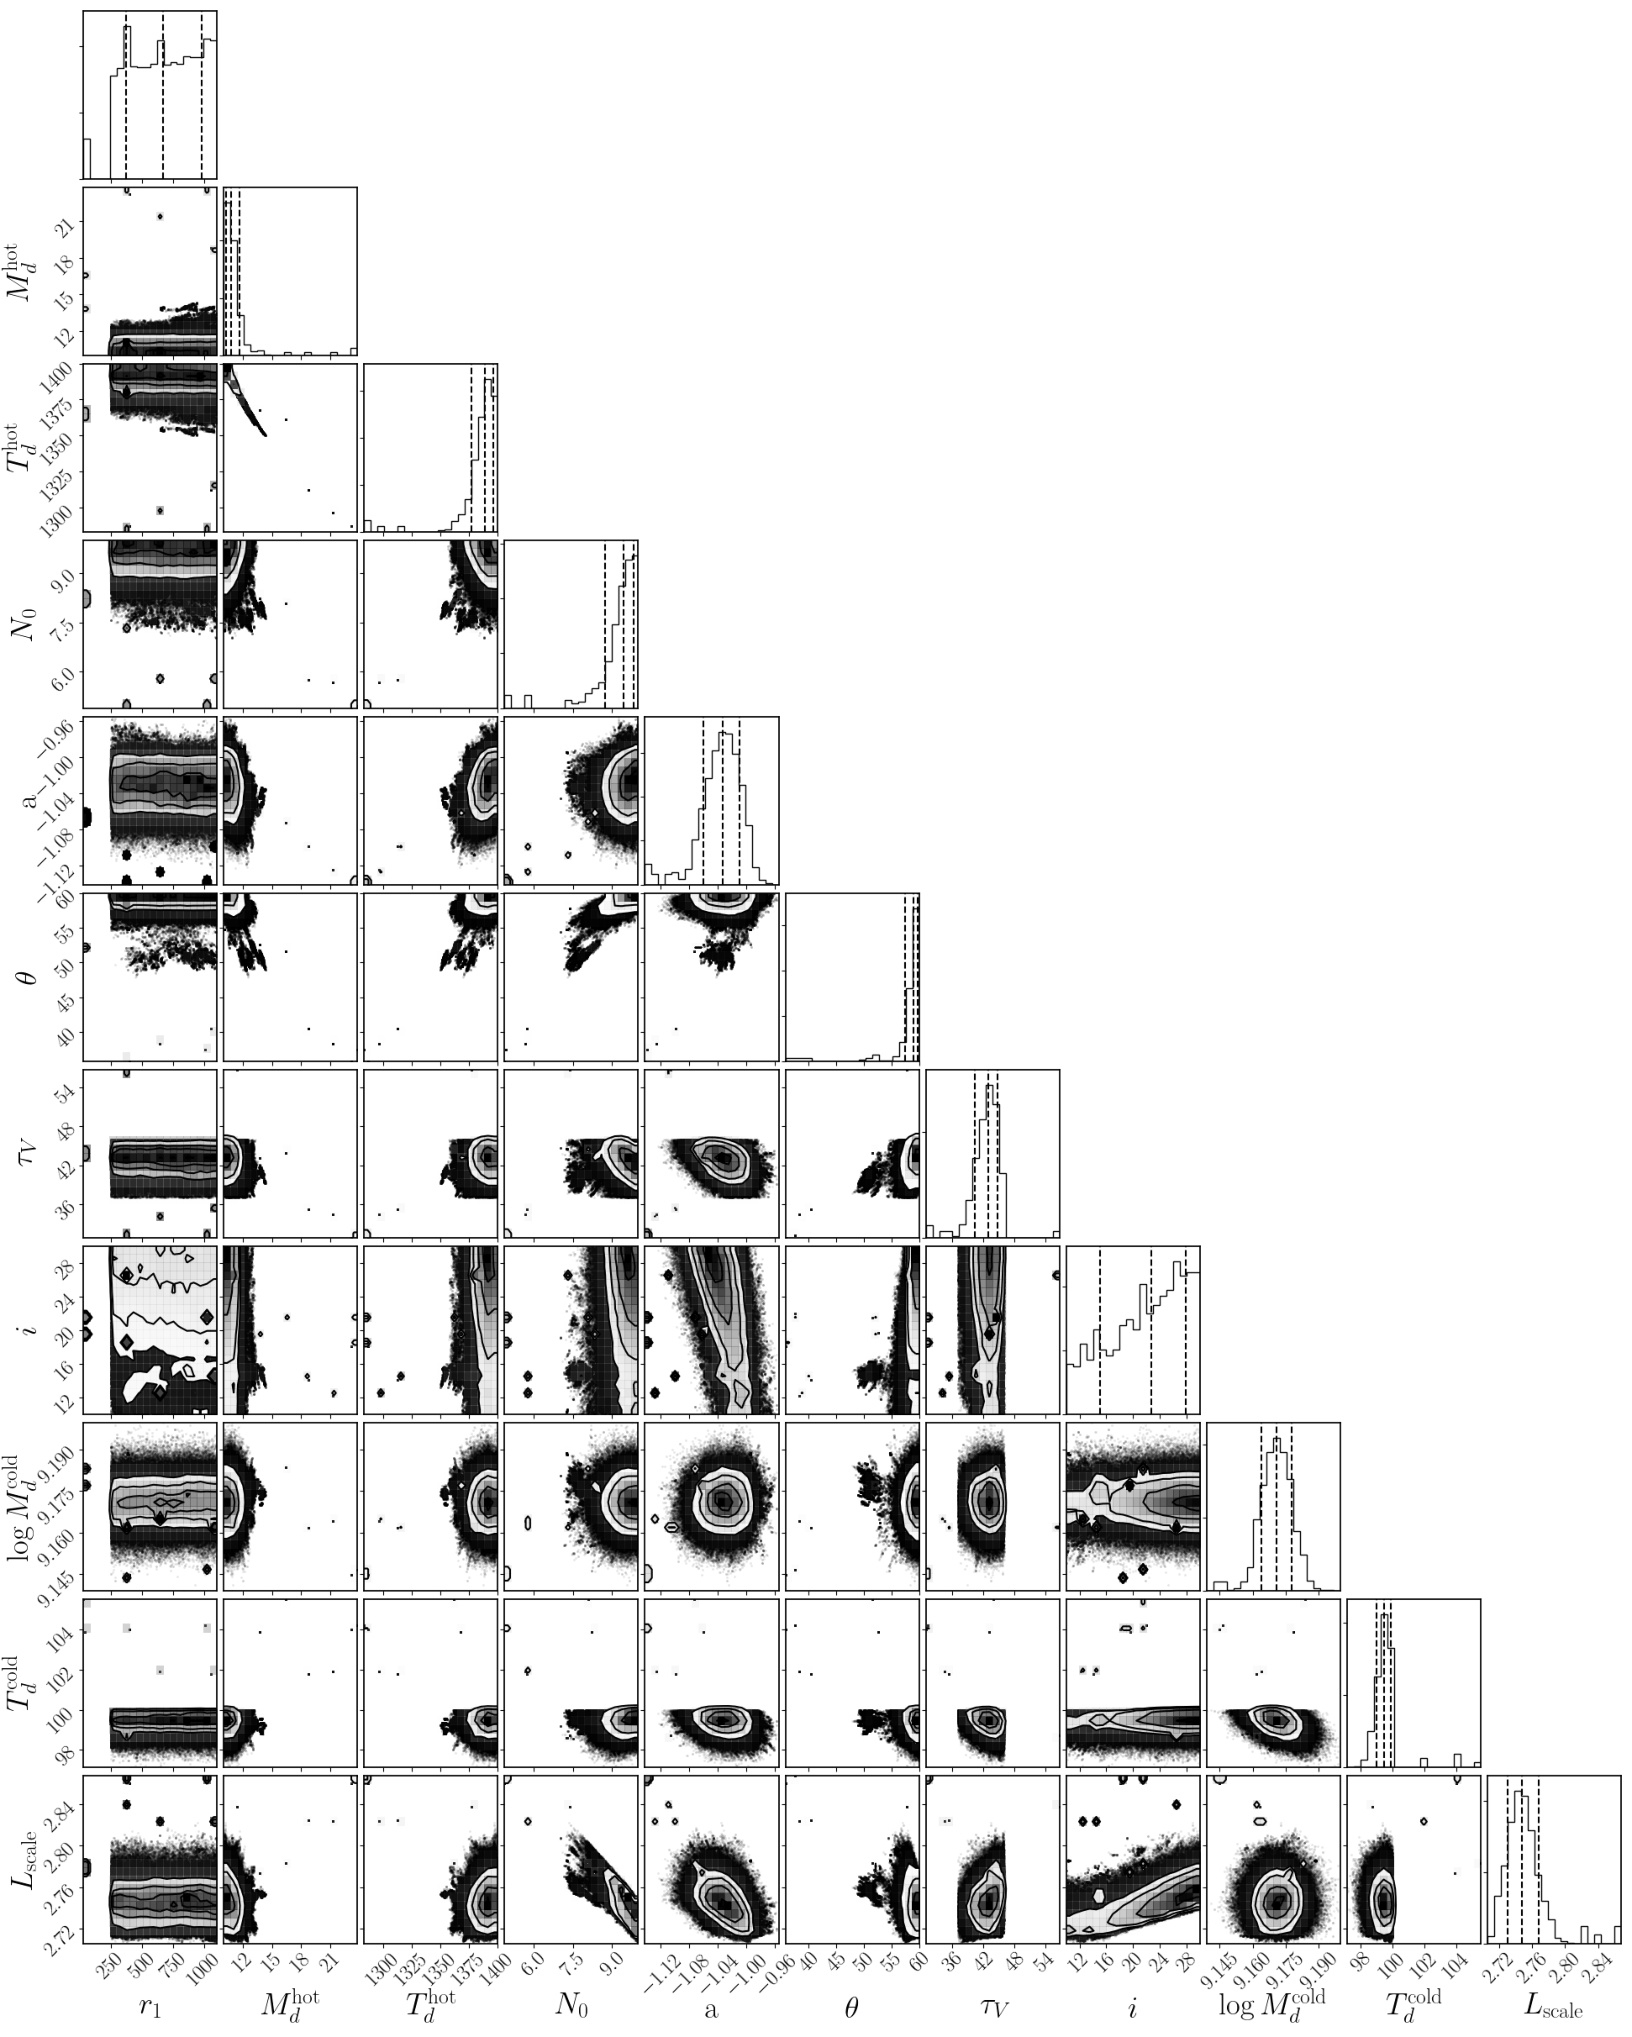
After sampling the target posteriors using MCMC with 100 walkers and 5 iterations, and after discarding the first 2 iterations as the burn-in phase and thinning the chains by 50 iterations, we identify the best-fit parameters together with the their uncertainties based on the 16th, 50th, and 84th percentiles of the PDFs. The best-fit model is shown in the bottom panel of Figure 4. We summarize the best-fit parameters and the apparent luminosities integrated over the total IR, NIR (rest-frame 13 ), MIR (rest-frame 340 ), and FIR (rest-frame 42.5122.5 ) in the bottom section of Table 2.
We find an FIR luminosity of = 4.7 -1 for the torus component. This corresponds to 30% of the total FIR emission, which is in contrast to the 90% reported in previous work (Weiß et al. 2007). Correcting for the torus contribution to the FIR emission, we find an SFR of yr-1 (assuming the Chabrier 2003 initial mass function). This is consistent with that derived from the two-temperature MBB model, which is SFR = 2970 yr-1. We note that the IR luminosity derived from this model is 2 times higher than that yielded by the fully analytic two-temperature dust model (§IV.1). This discrepancy results mostly from including a hot dust and a dusty torus component in the latter model, which is physically motivated and better describes the IR SED of APM 082795255 (see Figure 3 and 4). That is, the latter model describes the rest-frame near- and mid-IR photometry and the IRS spectrum, whereas the former does not (by construction). This result highlights the importance of accounting for the NIR emission using physically motivated models.
Including the near- and far-IR emission (i.e., covering rest-frame 1122.5 ), we find that dust emission due to the central AGN accounts for 93% of the total IR luminosity. This is similar to the large fraction (83%) inferred for the warm dust component in the fully analytic model. Based on the latest lens model (Riechers et al. 2009), the magnification factor is found to vary by only a factor of 23 across a spatial extent of 20 kpc. Thus, differential magnification may cause the above percentage to be uncertain to a factor of 23. However, if the cold dust is concentrated within the central 1 kpc (see Weiß et al. 2007 and Riechers et al. 2009), the difference in the magnification factor between the AGN and more-extended cold dust would be 25%. With this uncertainty in mind, dust heating due to the central quasar appears to be more significant than that from the star formation in the host galaxy of APM 082795255, and the fraction of the IR luminosity associated with the AGN is greater than those observed in other high- AGN/starburst composite systems studied to-date (Pope et al. 2008; Coppin et al. 2010; Lyu et al. 2016, e.g.,).
As noted above, the SED shortward of potentially has contributions from both the AGN and stars in the host galaxy, and we have not attempted to fit the photometry shortward of 1 for this reason. If we assume that the residual flux density at 1 unaccounted for by the torus model results from stellar emission in the host galaxy, we infer a stellar mass of = (3.65.3) 1013 . The range of stellar mass results from the range of -band mass-to-light ratio of = ( ) adopted (Hainline et al. 2011, e.g.,), which corresponds to different population synthesis models (Bruzual & Charlot 2003 and Maraston 2005) and star formation histories (instantaneous star formation versus constant). Taken at face value, the stellar mass of APM 082795255 is 4 1013, or assuming a lensing magnification factor of = 4. Such a stellar mass would place APM 082795255 among the most massive galaxies at 4 known. Alternatively, the very large inferred stellar mass could suggest that the lensing magnification for the stellar component is (at least) an order of magnitude higher than the Riechers et al. 2009 value of or that the residual flux is not due entirely to stellar emission, perhaps because the torus models employed do not adequately capture the geometry or/and dust properties of APM 082795255. Currently, the data at hand preclude us from favoring either scenario.
| Properties | Units | Values |
|---|---|---|
| Analytical: Two-temperature MBB + Radio Power-laws aaSee §IV.1 | ||
| (K) | 296 | |
| (K) | 110 | |
| 0.9 | ||
| bb, see Equation 4. | (107 pc-2) | 2.5 |
| bb, see Equation 4. | (109 pc-2) | 1.4 |
| (10-1 ) | 1.8 | |
| (10-1 ) | 1.8 | |
| Semi-analytical: Including Clumpy Torus ccSee §IV.2 | ||
| (pc) | 655 | |
| (-1 ) | 11 | |
| (10-1 ) | 1.4 | |
| (K) | 1385 | |
| (K) | 100 | |
| 8.3 | ||
| 1.0 | ||
| () | 55 | |
| 42 | ||
| () | 15 | |
| 48.8 | ||
| (10-1 ) | 3.5 | |
| (10-1 ) | 5.9 | |
| (10-1 ) | 2.7 | |
| (10-1 ) | 1.7 | |
| (10-1 ) | 4.7 | |
| (10-1 ) | 1.2 | |
Note. — The different IR luminosities are obtained by integrating over rest-frame: 11000 for ; 13 for ; 340 for ; and 42.5122.5 for .
V. Discussion
In the case of the two-temperature dust SED model, we find that previous model consistently underestimates the more comprehensive set of IR photometry included in this work, especially in the rest-frame wavelength range covering [10, 100] m (Figure 3), with a maximum residual of 53%. The differences is mainly a direct consequence of the higher dust temperatures found here (110 K vs. 65 K and 296 K vs. 220 K). In contrast to the results reported by Weiß et al. 2007, we find that the cold dust component dominates the FIR luminosity of APM 082795255 ( 66%). Regardless of these differences, we find comparable apparent total IR luminosities (rest-frame 11000 ). The (F)IR luminosity is summarized in the top section of Table 2.
When fitting the SED with clumpy AGN torus models in addition to the cold dust and radio components, we find a torus inclination angle consistent with the Type-1 nature of APM 082795255 (under the AGN unification model). The best-fit model suggests the presence of silicate emission at rest-frame 10 and 18 66 6 The 10 feature is attributed to stretching of the Si-O bonds in silicates, whereas the 18 feature is attributed to the O-Si-O bending mode., as commonly observed in Type-1 AGNs with Spitzer (Hao et al. 2005; Siebenmorgen et al. 2005; Sturm et al. 2005, e.g.,). If these features are real, their presence is consistent with the AGN unification model, in which an AGN torus seen close to pole-on ( = 0) should exhibit silicate emission features in the MIR (e.g., Hao et al. 2005; see also Stalevski et al. 2012), as dust on the surface of the torus is heated to temperatures sufficiently hot to produce silicate emission features. However, if these features are fictitious, this could be evidence that different torus models are needed to describe AGN/starburst systems at high redshifts.
As mentioned in §IV.2, the best-fit semi-analytic model including the torus component without an extra hot dust component overestimates the near-to-mid-IR fluxes. The MIR slope is also inconsistent with the IRS spectrum. We follow the work by Leipski et al. 2014 for 6 quasars and include an extra hot dust component in the model. The extra hot dust component improves the fit and yields good agreement with the IR photometry. However, the physical motivation for this extra hot dust component is unclear, as the hottest dust emission should arise self-consistently in the clumpy AGN torus models computed via radiative transfer, and there should be no need to add an additional ad hoc hot dust component. This need for an additional hot dust component may suggest that these powerful quasars in the early Universe have very different dust compositions and distributions than the more-nearby systems used to motivate AGN torus models. If this issue persists for larger samples of high- AGN, further improvements in AGN torus models would be warranted.
VI. Summary and Conclusions
We observe the IR-luminous, strongly-lensed AGN-starburst system APM 082795255 at = 3.9114 using the new sensitive FIR camera HAWC onboard SOFIA and the IRS onboard Spitzer. While APM 082795255 is a Type-1 broad absorption line AGN, it clearly shows strong mid-IR emission (even considering the viewing angle of APM 082795255 in the classical AGN unification model). Hence, SED modeling tools such as cigale are inappropriate77 7 Modeling tools such as cigale expect Type-1 AGNs to emit predominately in UV and optical wavebands and Type-2 AGNs to emit predominately in MIR wavelengths. Since a large amount of dust is still present in APM 082795255, the emission in the MIR waveband is significantly underestimated in cigale when one properly considers it as a Type-1 AGN. for APM 082795255. We combine the new data with ancillary data and decompose the IR SED into hot dust, torus, and cold dust components and the radio SED into thermal and non-thermal components (free-free and synchrotron). To facilitate comparison with previous studies, we also fit simplified two-temperature modified blackbody models.
We constrain the structure of the putative dusty torus around the central AGN by fitting 3D radiative transfer models of clumpy tori. Despite the uncertainties and degeneracies between the model parameters, some results are clear from the fit. For instance, the best-fit inclination angle and the silicate features predicted by the best-fit model are consistent with the Type-1 AGN nature of APM 082795255, which may be evidence supporting the unification model of AGN.
In the modified blackbody model presented in this work, we find that the warm dust component contributes only of the far-IR luminosity. Accounting for the torus’ contribution to the FIR luminosity, we find a lensing-corrected SFR of yr-1. Differences compared to previous models are pointed out in §IV.2.
Accounting for emission due to the torus at near-to-far-IR wavelengths (rest-frame 1122.5 ), we find that dust heating from the quasar contributes about 93% to its total IR emission. Therefore, the AGN plays an important role in driving the total dust luminosity of APM 082795255, more so than in other high- AGN/starburst composite systems studied to date (Pope et al. 2008; Coppin et al. 2010; Lyu et al. 2016, e.g.,). Based on the residual flux density at 1 unaccounted for by the torus model, we find a stellar mass of . At face value, assuming the Riechers et al. 2009 value of , the resulting stellar mass would place APM 082795255 among the most evolved and massive galaxies at 4 known, but it may also indicate that the true magnification is significantly greater than 4 and/or that the best-fit AGN torus model is significantly underestimating the contribution of the AGN at 1 .
Our results demonstrate the use of the new and sensitive FIR camera onboard SOFIA to constrain the physical properties of the dusty tori of quasars in the early Universe. The differences between the simplified model and the more complex but physically motivated model highlight the need for well-sampled IR SEDs of high- quasars in order to disentangle the effect of dust heating due to AGN versus star formation and thus to more accurately determine the SFRs in AGN/starburst composite systems. We note that the high IR luminosity of APM 082795255 may imply that our results are unlikely to be representative of high- AGNs. The Origins Space Telescope (OST) will have the capabilities to characterize the torus and dust components in high- AGNs with a much broader range of properties, enabling similar types of studies to be carried out for more typical and representative systems.
References
- Alexander & Hickox (2012) Alexander, D. M., & Hickox, R. C. 2012, New A Rev., 56, 93
- Alexander et al. (2008) Alexander, D. M., Brandt, W. N., Smail, I., et al. 2008, AJ, 135, 1968
- Antonucci (1993) Antonucci, R. 1993, ARA&A, 31, 473
- Barvainis (1987) Barvainis, R. 1987, ApJ, 320, 537
- Barvainis et al. (1995) Barvainis, R., Antonucci, R., Hurt, T., Coleman, P., & Reuter, H.-P. 1995, ApJ, 451, L9
- Barvainis & Ivison (2002) Barvainis, R., & Ivison, R. 2002, ApJ, 571, 712
- Becker et al. (1994) Becker, R. H., White, R. L., & Helfand, D. J. 1994, 61, 165
- Beelen et al. (2006) Beelen, A., Cox, P., Benford, D. J., et al. 2006, ApJ, 642, 694
- Bendo et al. (2013) Bendo, G. J., Griffin, M. J., Bock, J. J., et al. 2013, MNRAS, 433, 3062
- Bruzual & Charlot (2003) Bruzual, G., & Charlot, S. 2003, MNRAS, 344, 1000
- Burtscher et al. (2015) Burtscher, L., Orban de Xivry, G., Davies, R. I., et al. 2015, A&A, 578, A47
- Carilli et al. (2005) Carilli, C. L., Solomon, P., Vanden Bout, P., et al. 2005, ApJ, 618, 586
- Chabrier (2003) Chabrier, G. 2003, PASP, 115, 763
- Chapman et al. (2005) Chapman, S. C., Blain, A. W., Smail, I., & Ivison, R. J. 2005, ApJ, 622, 772
- Coppin et al. (2010) Coppin, K., Pope, A., Menéndez-Delmestre, K., et al. 2010, ApJ, 713, 503
- Coppin et al. (2008) Coppin, K. E. K., Swinbank, A. M., Neri, R., et al. 2008, MNRAS, 389, 45
- Deo et al. (2011) Deo, R. P., Richards, G. T., Nikutta, R., et al. 2011, ApJ, 729, 108
- Di Matteo et al. (2005) Di Matteo, T., Springel, V., & Hernquist, L. 2005, Nature, 433, 604
- Dowell et al. (2013) Dowell, C. D., Staguhn, J., Harper, D. A., et al. 2013, \aas, 221, 345.14
- Downes et al. (1999) Downes, D., Neri, R., Wiklind, T., Wilner, D. J., & Shaver, P. A. 1999, ApJ, 513, L1
- Egami et al. (2000) Egami, E., Neugebauer, G., Soifer, B. T., et al. 2000, ApJ, 535, 561
- Feruglio et al. (2017) Feruglio, C., Ferrara, A., Bischetti, M., et al. 2017, A&A, 608, A30
- Gofford et al. (2015) Gofford, J., Reeves, J. N., McLaughlin, D. E., et al. 2015, MNRAS, 451, 4169
- Hainline et al. (2011) Hainline, L. J., Blain, A. W., Smail, I., et al. 2011, ApJ, 740, 96
- Hao et al. (2005) Hao, L., Spoon, H. W. W., Sloan, G. C., et al. 2005, ApJ, 625, L75
- Harper et al. (2018) Harper, D. A., Runyan, M. C., Dowell, C. D., et al. 2018, Journal of Astronomical Instrumentation, 7, 1840008
- Heckman & Best (2014) Heckman, T. M., & Best, P. N. 2014, ARA&A, 52, 589
- Hinshaw et al. (2013) Hinshaw, G., Larson, D., Komatsu, E., et al. 2013, ApJS, 208, 19
- Hönig & Kishimoto (2010) Hönig, S. F., & Kishimoto, M. 2010, A&A, 523, A27
- Hönig et al. (2010) Hönig, S. F., Kishimoto, M., Gandhi, P., et al. 2010, A&A, 515
- Hopkins & Beacom (2006) Hopkins, A. M., & Beacom, J. F. 2006, ApJ, 651, 142
- Hopkins et al. (2008) Hopkins, P. F., Hernquist, L., Cox, T. J., & Kereš, D. 2008, ApJS, 175, 356
- Ibata et al. (1999) Ibata, R. A., Lewis, G. F., Irwin, M. J., Lehár, J., & Totten, E. J. 1999, AJ, 118, 1922
- Irwin et al. (1998) Irwin, M. J., Ibata, R. A., Lewis, G. F., & Totten, E. J. 1998, ApJ, 505, 529
- Ivison (2006) Ivison, R. J. 2006, MNRAS, 370, 495
- Leipski et al. (2014) Leipski, C., Meisenheimer, K., Walter, F., et al. 2014, ApJ, 785, 154
- Lewis et al. (2002) Lewis, G. F., Carilli, C., Papadopoulos, P., & Ivison, R. J. 2002, MNRAS, 330, L15
- Lewis et al. (1998) Lewis, G. F., Chapman, S. C., Ibata, R. A., Irwin, M. J., & Totten, E. J. 1998, ApJ, 505, L1
- Lis et al. (2011) Lis, D. C., Neufeld, D. A., Phillips, T. G., Gerin, M., & Neri, R. 2011, ApJ, 738, L6
- Lord (1992) Lord, S. D. 1992, A new software tool for computing Earth’s atmospheric transmission of near- and far-infrared radiation, Tech. rep.
- Lyu et al. (2016) Lyu, J., Rieke, G. H., & Alberts, S. 2016, ApJ, 816, 85
- Madau & Dickinson (2014) Madau, P., & Dickinson, M. 2014, ARA&A, 52, 415
- Maraston (2005) Maraston, C. 2005, MNRAS, 362, 799
- Marton et al. (2017) Marton, G., Calzoletti, L., Perez Garcia, A. M., et al. 2017, ArXiv e-prints, arXiv:1705.05693 [astro-ph.IM]
- Merloni et al. (2010) Merloni, A., Bongiorno, A., Bolzonella, M., et al. 2010, ApJ, 708, 137
- Narayanan et al. (2010) Narayanan, D., Dey, A., Hayward, C. C., et al. 2010, MNRAS, 407, 1701
- Netzer (2015) Netzer, H. 2015, ARA&A, 53, 365
- Netzer et al. (2014) Netzer, H., Mor, R., Trakhtenbrot, B., Shemmer, O., & Lira, P. 2014, ApJ, 791, 34
- Omont et al. (2003) Omont, A., Beelen, A., Bertoldi, F., et al. 2003, A&A, 398, 857
- Ott (2010) Ott, S. 2010, in Astronomical Society of the Pacific Conference Series, Vol. 434, Astronomical Data Analysis Software and Systems XIX, ed. Y. Mizumoto, K.-I. Morita, & M. Ohishi, 139
- Oya et al. (2013) Oya, S., Minowa, Y., Terada, H., et al. 2013, PASJ, 65, 9
- Page et al. (2012) Page, M. J., Symeonidis, M., Vieira, J. D., et al. 2012, Nature, 485, 213
- Papadopoulos et al. (2001) Papadopoulos, P., Ivison, R., Carilli, C., & Lewis, G. 2001, Nature, 409, 58
- Polletta et al. (2008) Polletta, M., Weedman, D., Hönig, S., et al. 2008, ApJ, 675, 960
- Pope et al. (2008) Pope, A., Chary, R.-R., Alexander, D. M., et al. 2008, ApJ, 675, 1171
- Priddey & McMahon (2001) Priddey, R. S., & McMahon, R. G. 2001, MNRAS, 324, L17
- Riechers et al. (2008a) Riechers, D. A., Walter, F., Brewer, B. J., et al. 2008a, ApJ, 686, 851
- Riechers et al. (2008b) Riechers, D. A., Walter, F., Carilli, C. L., Bertoldi, F., & Momjian, E. 2008b, ApJ, 686, L9
- Riechers et al. (2009) Riechers, D. A., Walter, F., Carilli, C. L., & Lewis, G. F. 2009, ApJ, 690, 463
- Riechers et al. (2010) Riechers, D. A., Capak, P. L., Carilli, C. L., et al. 2010, ApJ, 720, L131
- Rowan-Robinson (2000) Rowan-Robinson, M. 2000, MNRAS, 316, 885
- Rowan-Robinson et al. (1991) Rowan-Robinson, M., Broadhurst, T., Lawrence, A., et al. 1991, Nature, 351, 719
- Rowan-Robinson et al. (1993) Rowan-Robinson, M., Efstathiou, A., Lawrence, A., et al. 1993, MNRAS, 261, 513
- Sanders et al. (1988) Sanders, D. B., Soifer, B. T., Elias, J. H., et al. 1988, ApJ, 325, 74
- Saturni et al. (2018) Saturni, F. G., Bischetti, M., Piconcelli, E., et al. 2018, A&A, 617, A118
- Schartmann et al. (2005) Schartmann, M., Meisenheimer, K., Camenzind, M., Wolf, S., & Henning, T. 2005, A&A, 437, 861
- Siebenmorgen et al. (2005) Siebenmorgen, R., Haas, M., Kruegel, E., & Schulz, B. 2005, Astronomische Nachrichten, 326, 556
- Sparre et al. (2015) Sparre, M., Hayward, C. C., Springel, V., et al. 2015, MNRAS, 447, 3548
- Stalevski et al. (2012) Stalevski, M., Fritz, J., Baes, M., Nakos, T., & Popović, L. Č. 2012, MNRAS, 420, 2756
- Sturm et al. (2005) Sturm, E., Schweitzer, M., Lutz, D., et al. 2005, ApJ, 629, L21
- Treister et al. (2010) Treister, E., Natarajan, P., Sanders, D. B., et al. 2010, Science, 328, 600
- Urry & Padovani (1995) Urry, C. M., & Padovani, P. 1995, PASP, 107, 803
- van der Werf et al. (2011) van der Werf, P. P., Berciano Alba, A., Spaans, M., et al. 2011, ApJ, 741, L38
- Wagg et al. (2005) Wagg, J., Wilner, D. J., Neri, R., Downes, D., & Wiklind, T. 2005, ApJ, 634, L13
- Walter et al. (2004) Walter, F., Carilli, C., Bertoldi, F., et al. 2004, ApJ, 615, L17
- Wang et al. (2008) Wang, R., Carilli, C. L., Wagg, J., et al. 2008, ApJ, 687, 848
- Wang et al. (2013) Wang, R., Wagg, J., Carilli, C. L., et al. 2013, ApJ, 773, 44
- Weiß et al. (2007) Weiß, A., Downes, D., Walter, F., & Henkel, C. 2007, 375, 25
- Williams et al. (2018) Williams, W. L., Calistro Rivera, G., Best, P. N., et al. 2018, MNRAS, 475, 3429
- Zhuang et al. (2018) Zhuang, M.-Y., Ho, L. C., & Shangguan, J. 2018, ApJ, 862, 118
We show the 2D correlation plots and the 1D marginalized PDFs for the SED models presented in §IV.1 and §IV.2. The best-fit values and their uncertainties reported in Table 2 are quoted based on the 16th, 50th, and 84th percentiles of the PDFs.