What sets Verified Users apart?
Insights, Analysis and Prediction of Verified Users on TwitterConference: WebSci ’19: ACM Conference on Web Science; June 30–July 03, 2019; Boston, MAWebSci ’19: ACM Conference on Web Science, June 30–July 03, 2019, Boston, MACCS: Information systems Social networksCCS: Networks Social media networksCCS: Networks Online social networksCCS: Information systems Relevance assessmentCCS: Information systems Content analysis and feature selection
Abstract.
Social network and publishing platforms, such as Twitter, support the concept of a secret proprietary verification process, for handles they deem worthy of platform-wide public interest. In line with significant prior work which suggests that possessing such a status symbolizes enhanced credibility in the eyes of the platform audience, a verified badge is clearly coveted among public figures and brands. What are less obvious are the inner workings of the verification process and what being verified represents. This lack of clarity, coupled with the flak that Twitter received by extending aforementioned status to political extremists in 2017, backed Twitter into publicly admitting that the process and what the status represented needed to be rethought.
With this in mind, we seek to unravel the aspects of a user’s profile which likely engender or preclude verification. The aim of the paper is two-fold: First, we test if discerning the verification status of a handle from profile metadata and content features is feasible. Second, we unravel the features which have the greatest bearing on a handle’s verification status. We collected a dataset consisting of profile metadata of all 231,235 verified English-speaking users (as of July 2018), a control sample of 175,930 non-verified English-speaking users and all their 494 million tweets over a one year collection period. Our proposed models are able to reliably identify verification status (Area under curve AUC > 99%). We show that number of public list memberships, presence of neutral sentiment in tweets and an authoritative language style are the most pertinent predictors of verification status.
To the best of our knowledge, this work represents the first attempt at discerning and classifying verification worthy users on Twitter.
Keywords:
Twitter, Social Influence, Verified Users1. Introduction
The increased relevance of social media in our daily life has been accompanied by an exigent demand for a means to affirm the authenticity and authority of content sources. This challenge becomes even more apparent during the dissemination of real-time or breaking news, whose arrival on such platforms often precedes eventual traditional media reportage (Kwak
et al. 2010; Diakopoulos and
Zubiaga 2014). In line with this need, major social networks such as Twitter, Facebook and Instagram have incorporated a verification process to authenticate handles they deem important enough to be worth impersonating. Usually conferred to accounts of well-known public personalities and businesses, verified accounts11
1
The exact term varies by platform, with other social networks using the term “Verified Profiles”. However in the interest of consistency, all owner-authenticated accounts are referred to as verified accounts, and their owners as verified users. are indicated with a badge next to the screen name (e.g., \scalerel*![[Uncaptioned image]](1903.04879v1/Figs/TwiVer.png) B on Twitter and \scalerel*
B on Twitter and \scalerel*![[Uncaptioned image]](1903.04879v1/Figs/FaceVer.png) B on Facebook). Twitter’s verification policy (Twitter 2019a) states that an account is verified if it belongs to a personality or business deemed to be of sufficient public interest in diverse fields, such as journalism, politics, sports, etc. However, the exact decision making process behind evaluating the strength of a user’s case for verification remains a trade secret. This work attempts to unravel the likely factors that strengthen a user’s case for verification by delving into the aspects of a user’s Twitter presence, that most reliably predict platform verification.
B on Facebook). Twitter’s verification policy (Twitter 2019a) states that an account is verified if it belongs to a personality or business deemed to be of sufficient public interest in diverse fields, such as journalism, politics, sports, etc. However, the exact decision making process behind evaluating the strength of a user’s case for verification remains a trade secret. This work attempts to unravel the likely factors that strengthen a user’s case for verification by delving into the aspects of a user’s Twitter presence, that most reliably predict platform verification.
1.1. Motivation
Our motivation behind this work was two-fold and is elaborated in the following text.
Lack of procedural clarity and imputation of bias: Despite repeated statements by Twitter about verification not being equivalent to endorsement, aspects of the process – the rarity of the status and its prominent visual signalling (Twitter 2019b) -- have led users to conflate authenticity and credibility. This perception was confirmed in full public view when Twitter was backed into suspending its requests for verification in response to being accused of granting verified status to political extremists 22 2 https://www.bbc.com/news/technology-41934831, with the insinuation being that the verified badge lent their otherwise extremist opinions a facade of mainstream credibility.
This however, engendered accusations of Twitter’s verification procedure harbouring a liberal bias. Multiple tweets imputing the same gave rise to the hashtag #VerifiedHate. Similar insinuations have been made by right-leaning Indian users of the platform in the lead up to the 2019 Indian General Elections under the hashtag #ProtestAgainstTwitter. These hitherto unfounded allegations of bias prompted us to delve deeper into understanding what may be driving the process and inferring whether these claims were justified or could the difference in status be explained away by less insidious factors relating to a user’s profile and content.
Positive perception and coveted nature: Despite having its detractors, the fact remains that a verified badge is highly coveted amongst public figures and influencers. This is with good reason as in spite of being intended as a mark of authenticity, prior work in social sciences and psychology points to verified badges conferring additional credibility to a handle’s posted tweets (Castillo et al. 2011; Morris et al. 2012; Flanagin and Metzger 2007). Psychological testing (Fogg et al. 2003) has also revealed that the credibility of a message and its reception is influenced by its purported source and presentation rather than just its pertinence or credulity. Captology studies (Erdogan 1999) indicate that widely endorsed information originating from a well-known source is easier to perceive as trustworthy and back up the former claim. This is pertinent as owners of verified accounts are usually well-known and their content is on an average more frequently liked and retweeted than that of the generic Twittersphere (Statista 2018; TechAcute 2018).
Adding to the desirability of exclusive visual indicators is the demanding nature of credibility assessment on Twitter. The imposed character limit and a minimal scope of visually customizing content, coupled with the feverish rate at which content is consumed – with users on average devoting a mere three seconds of attention per tweet (Counts and Fisher 2011) – makes users resort to heuristics to judge online content. There is substantial work on heuristic based models for online credibility evaluation (Chaiken 1980; Sundar 2008; Gupta et al. 2014). Particularly relevant to this inquiry is the endorsement heuristic, which is associated with credibility conferred to it (e.g. a verified badge) and the consistency heuristic, which stems from endorsements by several authorities (e.g. a user verified in one platform is likely to be verified on others).
Unsurprisingly, a verified status is highly sought after by preeminent entities, as evidenced by the prevalence of get-verified-quick schemes such as promoted tweets from the now suspended account ‘@verified845’ (Bustle 2018; TripWire 2019). Our work attempts to obtain actionable insights into verification process, thus providing entities looking to get verified a means to strengthen their case.
1.2. Research Questions
The aforementioned motivating factors pose a few avenues of research enquiry which we attempt to answer in this work are are detailed below.
- RQ1:
Can the verification status of a user be predicted from profile metadata and tweet contents? If so what are the most reliably discriminative features?
- RQ2:
Do any inconsistencies exist between verified and non-verified users with respect to peripheral aspects like the choice and variety of topics they tweet about?
1.3. Contributions
Our contributions can be summarized as follows:
- •
We motivate and propose the problem of predicting verification status of a Twitter user.
- •
We detail a framework extracting a substantial set of features from data and meta-data about social media users, including friends, tweet content and sentiment, activity time series, and profile trajectories. We plan to make this dataset of 407,165 users and 494 million tweets, publicly available upon publication of the work.33 3 http://precog.iiitd.edu.in/requester.php?dataset=twitterVerified19
- •
Additionally, we factored in state-of-the-art bot detection analysis into our predictive model. We use these features to train highly-accurate models capable of discerning a user’s verified status. For a general user, we are able to provide a zero to one score representing their likelihood of being verified in Twitter.
- •
We report the most informative features in discriminating verified users from non-verified ones and also shed light on the manner in which the span and gamut of topic coverage between their tweets differs.
The rest of the paper is organized as follows. Section 2 details relevant prior work, hence putting our work in perspective. Section 3 elaborates our data acquisition methodology. In Sections 4 and 5, we conduct a comparative analysis between verified and non-verified users, addressing RQ1 and RQ2 respectively, and attempt to uncover features that can reliably classify them. We conclude with a brief summary in Section 6.
2. Related Work
Previous studies have focused on measuring user impact in social networks. As user impact might be a critical factor in deciding who gets verified on Twitter (Twitter 2019a), it is important to study how certain users in particular networks have more impact/influence as compared to the others. Cha et al. (Cha et al. 2010) studied the dynamics of influence on Twitter based on three key measures: in-degree, retweeets, and user-mentions. They show that in-degree alone is not sufficient to measure the influence of a user on Twitter. Bakshy et al. (Bakshy et al. 2011) demonstrate that URLs from users who have been influential in the past tend to generate larger cascades on the Twitter follower graph. They also show that URLs considered more interesting and that kindle positive emotions, spread more. Canali et al. (Canali and Lancellotti 2012) identify key users on social networks who are important sources or targets for content disseminated online. They use a dimensionality-reduction based technique and conduct experiments with YouTube and Flickr datasets to obtain results which outperform the existing solutions by 15%. The novelty of their approach is that they use attribute rich user profiles and not just stay limited to their network information. On the other hand, Lampos et al. (Lampos et al. 2014) predict user impact on Twitter using features, such as user statistics and tweet content, that are under the control of the user. They experiment with both linear and non-linear prediction techniques and find that Gaussian Processes based models perform the best for the prediction task. Klout (klo 2019) was a service that measured the influence of a person using information from multiple social networks. Their initial framework (Rao et al. 2015) used long lasting (e.g., in-degree, pagerank centrality, recommendations etc) and dynamic features (reactions to a post such as retweets, upvotes etc.) to estimate the influence of a person across nine different social networks.
Further studies have tried to classify users based on factors such as celebrity status, socioeconomic status etc. Lampos et al. (Lampos et al. 2016) classify the socioeconomic status of users on Twitter as high, middle or lower socioeconomic, using features such as tweet content, topics of discussion, interaction behaviour, and user impact. They obtain an accuracy of 75% using a nonlinear, generative learning approach with a composite Gaussian Process kernel. Preoctiuc-Pietro et al. (Preoţiuc-Pietro et al. 2015) present a Gaussian Process regression model, which predicts the income of the user on Twitter. They examined factors that help characterize user income on Twitter and analyze their relation with emotions, sentiments, perceived psycho-demographics, and language used in posts. Further, Marwick et al. (Marwick and Boyd 2011) qualitatively study the behaviours of celebrities on Twitter and how it impacts creation and sharing of content online. They aim to conceptualize “celebrity as a practice” in terms of personal information revelation, language usage, interactions, and affiliation with followers, among other things. There are also other studies that try to characterize usage patterns (Al Maruf et al. 2015) and personalities (Tadesse et al. 2018) of varied users on Twitter.
Multiple existing studies attempt to detect and analyze automated activity on Twitter (Chu et al. 2012; Zhang and Paxson 2011; Gilani et al. 2017; Dickerson et al. 2014; Wang 2010a; Chavoshi et al. 2016) and differentiate bot activity from human or partial-human activity. Conversely, Chu et al. (Chu et al. 2012) identify users on Twitter that generate automated content. The verification badge was a key feature used for the purpose. Holistically characterizing features that resemble automated activity, and the extent to which exhibiting the same can hurt a user’s case for verification is further explored in Section 4.2.
Past studies on verified accounts have focused on elucidating their behaviors and properties on Twitter. Hentschel et al. (Hentschel et al. 2014) analyze verified users on Twitter and further use this information to identify trustworthy “regular” (not fake or spam) Twitter users. Castillo et al. (Castillo et al. 2011) attempt to identify credible tweets based on a variety of profile features including whether the user was authenticated by the platform or not. Along similar lines, Morris et al. (Morris et al. 2012) examined factors that influence profile credibility perceptions on Twitter. They found that possessing an authenticated status is one of the most robust predictors of positive credibility. Paul et el. (Paul et al. 2018) performed multiple network analyses of the verified accounts present on Twitter and reveal how they diverge from earlier results on the network as a whole. Hence, to summarize, there exists a rich body of literature establishing the enhancement of credibility and perceived importance a verified badge endows a user with. However, no prior work, to the best of our knowledge, has attempted to characterize attributes that make the aforementioned status more attainable.
3. Dataset
In this section, we present details of our dataset and the data collection process along with a summary of the diverse features.
3.1. User Metadata
The ‘@verified’ handle on Twitter follows all accounts on the platform that are currently verified. We queried this handle on the 18th of July 2018 and extracted the IDs of 297,776 users (of which 231,235 have their primary language set to English) who were verified at the time. In the interest of verifying Twitter’s assertion that likeliness of an handle’s verification is commensurate with public interest in that handle and nothing else (Twitter 2019a; Twitter 2018), we sought to obtain a random controlled subset of non-verified users on the platform. Pursuant to this need, we leveraged Twitter’s Firehose API – a near real-time stream of public tweets and accompanying author metadata – in order to acquire a random set of 284,312 non-verified users, controlling for a conventional measure of public interest, by ensuring that the number of followers of every non-verified user obtained was within 2% that of a unique verified user that we had previously acquired.
Twitter provides a REST Application Programming Interface (API) with various endpoints that make data retrieval from the site in an organized manner easier. We used the REST API to acquire profile metadata of the user handles obtained previously including account age, number of friends, followers and tweets. Additionally, we obtained the number of public Twitter lists a user was part of and the handle’s profile description. Metadata features extracted from user profiles have previously been used for classifying users and inferring activity patterns on Twitter (Wu et al. 2011; Mislove et al. 2011). We further focused our work to the subset of users who had English listed as their profile language thus enabling us to focus on the largest linguistic group on the platform (Mocanu et al. 2013) and leaving us with 231,235 English verified users and 175,930 non-verified users.
3.2. Content Features
Utilizing Twitter’s Firehose API, we acquired all tweets authored by the aforementioned users over a one year collection period spanning from 1st June 2017 to 31st May 2018. In total, our collection process acquired roughly 494,452,786 tweets. The tweet texts were retained and any accompanying media such as GIFs were deemed surplus to requirements and discarded.
From the text we extracted linguistic and stylistic features such as the number and proportion of Part-Of-Speech (POS) tags, effectively obtaining a user’s breakdown of natural language component usage. Work demonstrating the importance of content features in location inference (Mahmud et al. 2012), tweet classification (Batool et al. 2013), and network characterization (Leskovec and Mcauley 2012) further led us to extract the frequency of hashtags, retweets, mentions and external links used by each user. Prompted by studies showing that the deceptiveness of tweets could be inferred from the length of sentences constituting them (Appling et al. 2015), we computed additional features including average words per sentence, average words per tweet, character level entropy and frequency and proportion of long words (word length greater than six letters) per user.
In the interest of better discerning the emotions conveyed by the tweets authored by a user and responses they may evoke in the potential audience, sentiment analysis presented itself as an effective tool. Sentiment gleaned from Twitter conversations has been used to predict financial outcomes (Bollen et al. 2011), electoral outcomes (Anuta et al. 2017) as well as the ease of content dissemination (Ferrara and Yang 2015). We used Vader (Gilbert 2014), a popular social media sentiment analysis lexicon, which has previously been widely used in a plethora of applications ranging from predicting elections (Anuta et al. 2017; Ramteke et al. 2016) to forecasting cryptocurrency market fluctuations (Stenqvist and Lönnö 2017). We extracted positive, negative and neutral sentiment scores and an additional fourth compound score, which is a nonlinear normalized sum of valence computed based on established heuristics (Warriner et al. 2013) and a sentiment lexicon. All four scores are computed per user, weighted by tweet length.
3.3. Temporal Features
Existing research suggests that temporal features relating to content generation and activity levels on Twitter can be used to infer emergent trending topics (Cataldi et al. 2010) as well as influential users (Lee et al. 2010).
| User Metadata | Number of followers | Temporal Features | Average number of followers last year |
|---|---|---|---|
| Number of friends | Average number of friends last year | ||
| Number of statuses | Average number of statuses last year | ||
| Number of public list memberships | Proportion of followers gained in last 3 months | ||
| Account age | Proportion of friends gained in last 3 months | ||
| Proportion of statuses generated in last 3 months | |||
| Proportion of followers gained in last 1 month | |||
| Proportion of friends gained in last 1 month | |||
| Proportion of statuses generated in last 1 month | |||
| Average duration between statuses | |||
| Content Features | Number of POS tags1 | Miscellaneous Features | LIWC analytic summary score |
| Frequency of POS tags1 | LIWC authentic summary score | ||
| Average number of words per sentence | LIWC clout summary score | ||
| Average number of words per tweet | LIWC tone summary score | ||
| Character level entropy | Botometer complete automation probability | ||
| Proportion of long words2 | Botometer network score | ||
| Positive sentiment score3 | Botometer content score | ||
| Negative sentiment score3 | Botometer temporal score | ||
| Neutral sentiment score3 | Tweet topic distribution4 | ||
| Compound sentiment score3 | |||
| Frequency of hashtags | |||
| Frequency of retweets | |||
| Frequency of mentions | |||
| Frequency of external links posted |
- 1
Part Of Speech (POS) tags include nouns, personal pronouns, impersonal pronouns, adjectives, adverbs, verbs, auxiliary verbs, prepositions and articles.
- 2
Long words are defined as words longer than 6 letters.
- 3
Sentiment scores are weighted over all tweets of a user by tweet length.
- 4
Scores over 100 topics are extracted from the tweets.
Leveraging the Twitter Firehose, we gathered fine-grained time series of user statistics including number of friends, followers and statuses, thus permitting us to compute their averages over our one year collection period. Furthermore, positing that a user’s likelihood of verification may be predicated on how ascendant their reach in the platform is, we compute the proportion of friends and followers gained over the last one month and the last three months of our collection period. Additionally, similar trajectory encoding features are computed for tweet activity levels over the aforementioned one and three month windows, and the average time between statuses is extracted using the status count time series on a per user basis.
3.4. Miscellaneous Features
Attempting to capture qualitative cognitive and emotional cues from a user’s tweets, we acquired the four LIWC 2015 (Pennebaker et al. 2015) summary statistics named Analytic, Clout, Authentic and Tone for each user in our dataset. The summary dimensions indicate the presence of logical and hierarchical thinking patterns, confidence and leadership, personal cues and emotional tone, respectively, in the tweets of a user. LIWC categories have been scientifically validated to perform well in determining affect on Twitter (De Choudhury et al. 2013; Volkova et al. 2017) and have been previously used to detect sarcasm (González-Ibánez et al. 2011) and for mental health diagnoses from Twitter conversations (Harman and Dredze 2014).
Furthermore, positing that accounts perceived as being completely or partially automated may have a harder time getting verified, we leveraged Botometer – a flagship bot detection solution (Varol et al. 2017) that exposes a free public API. The system is trained on thousands of instances of social bots and the creators report AUC ROC scores between 0.89 and 0.95. Botometer utilizes features spanning the gamut from network attributes to temporal activity patterns. Additionally, it queries Twitter to extract 300 recent tweets and publicly available account metadata, and feeds these features to an ensemble of machine learning classifiers, which produce a Complete Automation Probability (CAP) score, which we acquire for every user in our dataset. We also augment our dataset with the temporal, network and content category automation scores for each user.
Finally, we also look to glean into the topics that users tweet about. Topic modelling has been effectively used in categorizing trending topics on Twitter (Zubiaga et al. 2011) and inferring author attributes from tweet content (McCollister et al. 2015). To this end, we ran the Gibbs sampling based Mallet implementation of Latent Dirichlet Allocation (LDA) (McCallum 2002) setting the number of topics to 100 with 1000 iterations of sampling. Although, such a topic model could be applied on a per tweet basis and subsequently aggregated by user, we find this approach to not work very well as most tweets are simply a sentence long. To overcome this difficulty, we follow the workaround adopted by previous studies by aggregating all the tweets of a user into a single document (Weng et al. 2010; Hong and Davison 2010). In effect, this treatment can be regarded as an application of the author-topic model (Steyvers et al. 2004) to tweets, where each document has a single author.
3.5. Rectifying Class Imbalance
Focusing our analysis on the Twitter Anglosphere left us with a substantially skewed class distribution of 231,235 verified users and 175,930 non-verified users in our dataset. In keeping with existing research on imbalanced learning on Twitter data (Hamdan et al. 2015; Miura et al. 2014), we used a two-pronged approach to rectify this – a minority over-sampling technique named ADASYN (He et al. 2008) which generates samples based on the feature space of the minority examples and a hybrid over and under-sampling technique called SMOTETomek which additionally also eliminates samples of the over-represented class (Kubat et al. 1997) and has been found to give exemplary results on imbalanced datasets(Batista et al. 2004). Augmenting our classifier’s training data in the aforementioned manner allowed us to attain near-perfect classification scores.
The data collected is classified and summarized in Table 1. We intend to anonymize and make this dataset accessible to the public in a manner compliant with Twitter terms, once this work is published.
4. Results and Analysis
We commence our analysis by eliminating all features that could be deemed surfeit to requirements. To this end, we employed an all-relevant feature selection model (Kursa et al. 2010) which classifies features into three categories: confirmed, tentative and rejected. We only retain features that the model is able to confirm over 100 iterations.
To evaluate the effectiveness of our framework in discerning verification status of users, we examine five classification performance metrics – precision, recall, F1-score, accuracy and area under ROC curve – for five classifiers. The first two methods intended at establishing baselines were a Logistic Regressor and a Support Vector Classifier. Further, three methods were used to gauge how far the classification performance could be pushed using the features we collected. These were (1) a Generalized Additive Model trained by nested iterations, setting all terms to smooth, (2) a Multi Layered Perceptron with 3 hidden layers of 100, 30 and 10 neurons respectively, using Adam as an optimiser and ReLU as activation and (3) state-of-the-art Gradient Boosting tool named XGBoost with a maximum tree depth of 6 and a learning rate of 0.2. The results obtained are detailed in Table 2. The first batch of results are obtained by training on the original unadulterated training split. Even without rectifying class distribution biases, we are able to attain a high classification accuracy of 98.9% on our most competitive classifier.
The second and third batches are trained on data rectified for class imbalance using the adaptive synthetic over-sampling method (ADASYN) and a hybrid over and under-sampling method (SMOTETomek), respectively. The ADASYN algorithm generates samples based on the feature space of the minority class data points and is a powerful method that has seen success across many domains (He and Garcia 2008) in neutralizing the deleterious effects of class imbalance. The SMOTETomek algorithm combines the above over-sampling strategy with an under-sampling method called Tomek link removal (Tomek 1976) to remove any bias introduced by over-sampling. This rectification did improve results, generally improving the performance of our two baseline choices and especially helping us inch closer to perfect performance with gradient boosting. However, particularly surprising was the detrimental effect of class re-balancing on the MLP classifier which in all likeliness also learned the non-salient patterns in the re-balanced data. Also unexpectedly, the ADASYN re-balancing outperformed the more sophisticated SMOTETomek re-balancing in pushing the performance limits of the support vector (89.1% accuracy) and gradient boosting (99.1% accuracy) approaches. This might be owing to the fact that the Tomek link removal method omits informative samples close to the classification boundary thus affecting the learned support vectors and decision tree splits.
Our results suggest that near perfect classification of the Twitter user verification status is possible without resorting to complex deep-learning pipelines that sacrifice interpretability.
| Dataset | Classifier | Precision | Recall | F1-Score | Accuracy | ROC AUC Score |
|---|---|---|---|---|---|---|
| Logistic Regression | 0.86 | 0.86 | 0.86 | 0.859 | 0.854 | |
| Original | Support Vector Classifier | 0.89 | 0.89 | 0.89 | 0.887 | 0.883 |
| imbalanced | Generalized Additive Model1 | 0.97 | 0.98 | 0.98 | 0.975 | 0.976 |
| data | 3-Hidden layer NN (100,30,10) ReLU+Adam | 0.98 | 0.98 | 0.98 | 0.983 | 0.977 |
| XGBoost Classifier | 0.99 | 0.99 | 0.99 | 0.989 | 0.990 | |
| Logistic Regression | 0.86 | 0.86 | 0.86 | 0.856 | 0.858 | |
| ADASYN | Support Vector Classifier | 0.89 | 0.89 | 0.89 | 0.891 | 0.891 |
| class | Generalized Additive Model1 | 0.97 | 0.97 | 0.97 | 0.974 | 0.973 |
| rebalancing | 3-Hidden layer NN (100,30,10) ReLU+Adam | 0.96 | 0.96 | 0.96 | 0.959 | 0.957 |
| XGBoost Classifier | 0.99 | 0.99 | 0.99 | 0.991 | 0.991 | |
| Logistic Regression | 0.86 | 0.86 | 0.86 | 0.860 | 0.856 | |
| SMOTETomek | Support Vector Classifier | 0.90 | 0.90 | 0.90 | 0.903 | 0.901 |
| class | Generalized Additive Model1 | 0.98 | 0.97 | 0.98 | 0.974 | 0.974 |
| rebalancing | 3-Hidden layer NN (100,30,10) ReLU+Adam | 0.97 | 0.97 | 0.97 | 0.966 | 0.968 |
| XGBoost Classifier | 0.99 | 0.99 | 0.99 | 0.990 | 0.991 |
- 1
The generalized additive models were trained using all smooth terms.
4.1. Feature Importance Analysis

To compare the usefulness of various categories of features, we trained gradient boosting classifier, our most competitive model, using each category of features alone. While we achieved the best performance with user metadata features, content features were not far behind. Evaluated on multiple randomized train-test splits of our dataset, user metadata and content features were both able to consistently surpass 0.88 AUC. Additionally, temporal features alone are able to consistently attain an AUC of over 0.79.
The individual feature importances were determined using the Gini impurity reduction metric output by the gradient boosting model trained on the unmodified dataset. To rank the most important features reliably, the model was trained 100 times with varying combinations of hyperparameters (column sub-sampling, data sub-sampling and tree child weight) and the features determined to be the most important were noted. The most reliably discriminative features and their normalized density distributions over the values they attain are detailed in Figure 1. These features generally exhibit intuitive patterns of separation based on which an informed prediction can be attempted, e.g., the very highest echelons of public list membership counts are populated exclusively by verified users while the very low extremes of propensity for authoritative speech as indicated by LIWC Clout summary scores are exclusively displayed by non-verified users.
The top 6 features are sufficient to reach performance of 0.9 AUC on their own right and the top 10 features are sufficient to further push those numbers up to 0.93. This is largely owing to the fact that substantial redundancy was observed among sets of highly correlated features such as some linguistic (tendency to use long words and impersonal pronouns highly correlate with high analytic LIWC summary scores) and temporal trajectory (most ascendant users score highly in both the 1 month and 3 month features in terms of tweets authored and followers gained) features.
4.2. Clustering and characterization
In order to characterize accounts with a higher resolution than a binary verification status will permit, we apply K-Means++ on the normalized user vectors selecting the 30 most discriminative features indicated by the XGBoost model – our most competitive classifier. We settle on 8 different clusters based on evaluation including the inflection point of the clustering inertia curve and the proportion of variance explained. In the interest of an intuitive visualization, two dimensional embeddings obtained using t-SNE dimensionality reduction method (Maaten and Hinton 2008) are presented. Tuning the perplexity metric appropriately, the method considers the similarity of data points in our feature space and embeds them in a manner that reflects their proximity in the feature space. The embeddings are plotted and our classifier responses for members of the different clusters are detailed in Figure 2.

Investigating these clusters allows us to further unravel combinations of attributes that strengthen a user’s case for verification. Clusters C0 and C2 are composed nearly exclusively of non-verified users. Cluster C0 can largely be characterized as the Twitter layman with a high proportion of experiential tweets. This narrative further plays out in our collected features with members of this cluster on average having short tweets, high incidence of verb usage and scoring especially high in the LIWC Authenticity summary. Cluster C2 can be characterized as an amalgamation of accounts exhibiting bot-like behavior. Members of this cluster scored highly on the complete, network and content automation scores in our feature set. Furthermore, members in C2 possessed attributes previously linked to spammers such as copious usage of hashtags (Yardi et al. 2010) and external links (Wang 2010b). Manual inspection verified the substantial presence of automated content such as local weather updates in this cluster. Unsurprisingly, members of this cluster were predicted to possess the lowest verification probability by our classifier.
The composition of clusters C4 and C6 leans towards verified users, with members of C4 having a tendency to post longer tweets and retweet more frequently than author content, while members of C6 almost exclusively retweet on the platform with slightly over 93% of their content being such. Cluster C5 is nearly entirely comprised of verified users and includes elite Twitteratti that comprise the core of verified users on the platform. These users have by far the highest list memberships on average while also scoring very highly on the LIWC Clout summary. Predictably, members of this cluster were predicted to possess the highest verification probability by our classifier.
| Cluster | Population | Accuracy | ROC AUC Score |
|---|---|---|---|
| C0 | 19462 | 0.996 | 0.989 |
| C1 | 26259 | 0.986 | 0.986 |
| C2 | 19356 | 0.994 | 0.984 |
| C3 | 46178 | 0.988 | 0.987 |
| C4 | 90843 | 0.989 | 0.987 |
| C5 | 105701 | 0.993 | 0.986 |
| C6 | 39248 | 0.990 | 0.989 |
| C7 | 60118 | 0.987 | 0.986 |
The remaining clusters C1, C3 and C7 are comprised of a mix of verified and non-verified users. However, further inspection revealed that they have very divergent trajectories. Members of cluster C1 are ascendant both in terms of reach and activity levels as evidenced by the proportion of their followers gained and statuses authored in the last one and three months of our collection period. These members can be said to constitute a nouveau-elite group of users. This is further backed up by the fact that these users are lacking in their presence in public lists as compared to the very established elite in cluster C5. Manual inspection also verifies that many of these users have attained verification during our collection period. This is in stark contrast with members of C3 and C7 who are either stagnant or declining in their reach and activity levels and show very low engagement with the rest of the platform in terms of retweets and mentions. Remarkably, our classifier is able to make this distinction and rates members of C1 as slightly better candidates for verification on average than members of C3 or C7. The relative difficulty of classifying users in these mixed clusters is demonstrated in the performance breakdown detailed in Table 3.
5. Topic Analysis for Verified vs Non-Verified Users
Having deduced important predictive features present in a user’s metadata, linguistic style and activity levels over time with respect to verification status, we next investigate the presence of similar predictive patterns in the choice and variety of tweet topic usage amongst users.
5.1. Content Topics

| Classifier | Precision | Recall | F1-Score | Accuracy | ROC AUC Score |
|---|---|---|---|---|---|
| Generalized Additive Model1 | 0.83 | 0.83 | 0.83 | 0.832 | 0.831 |
| 3-Hidden layer NN (100,30,10) ReLU+Adam | 0.88 | 0.88 | 0.88 | 0.882 | 0.880 |
| XGBoost Classifier | 0.82 | 0.82 | 0.82 | 0.824 | 0.823 |
- 1
The generalized additive models were trained using all smooth terms.
In order to obtain a topical breakdown of a user’s tweets in an unsupervised manner, we ran the Gibbs sampling based Mallet implementation of Latent Dirichlet Allocation (LDA) (McCallum 2002) with 1000 iterations of sampling. Narrowing down on the correct number of topics required us to execute multiple runs of the model while varying our choices for the number of topics. The model was executed for 30, 50, 100, 150 and 300 topics and the likelihood estimates were noted. It must be mentioned that in all cases the likelihood estimates stabilized well within the 1000 iteration limit we set. The likelihood keeps rising in value up to topics, after which it sees a decline. This kind of profile is often seen when varying the hyperparameter of a statistical model, with the optimal model being rich enough to fit the information available in the data, yet not complex enough to begin fitting noise. This led us to conclude that the tweets we collected over a year are best accounted for by incorporating 100 separate topics. We set and , which are the default settings recommended in prior studies (Griffiths and Steyvers 2004) and maintain the sum of the Dirichlet hyperparameters, which can be interpreted as the number of virtual samples contributing to the smoothing of the topic distribution, as constant. The chosen value of is small enough to permit a fine-grained breakdown of tweet topics covering various conversational areas.
We again commenced the prediction by pruning down our topical feature set using the all relevant feature selection method we used earlier (Kursa et al. 2010) in Section 4. This allowed us to hone in on the 76 topics that were confirmed to be predictive of verification status. To evaluate the effectiveness of our framework in discerning verification status of users from topic cues, we examine five classification performance metrics – precision, recall, F1-score, accuracy and area under ROC curve – for the three classifiers that were most competitive in our previous classification task. These were (1) a Generalized Additive Model trained by nested iterations, setting all terms to smooth, (2) a Multi Layered Perceptron with 3 hidden layers of 100, 30 and 10 neurons respectively, using Adam as an optimiser and ReLU as activation and (3) Gradient Boosting tool named XGBoost with a maximum tree depth of 5 and a learning rate of 0.3. The results obtained are detailed in Table 4. The results demonstrate that it is eminently possible to infer the verification status of a user purely using the distribution of topics they tweet about with a high accuracy. The MLP classifier was the most competitive in this task, reliably pushing past 88.2% accuracy.
In the interest of interpretability, we evaluate the predictive power of each topic with respect to the classification target. To this end, we obtain individual topic importances using the ANOVA F-Scores output by GAM – our second most competitive model on this task. In order to rank the features reliably, the procedure is run on 50 random train-test splits of the dataset and the topics with the lowest F-Scores noted. The most reliably discriminative topics and the normalized density distributions of their usage are detailed in Figure 3. Owing to multiple topics largely belonging to popular broad conversational categories such as sports and politics, some redundancy was observed in the way of multi-collinearity. This is further backed up by the fact that the top 15 most important topics alone can discern verification status with an AUC of 0.76 while the top 25 topics can push those numbers up to an AUC of 0.8 nearly approximating the GAM performance on the whole feature set (AUC 0.83). These topics generally exhibit intuitive patterns of separation based on which an informed prediction can be made, e.g., the users who tweet most frequently about climate change are all verified while controversial topics like middle-east geopolitics are something verified users prefer to devote limited attention to.
5.2. Topical Span
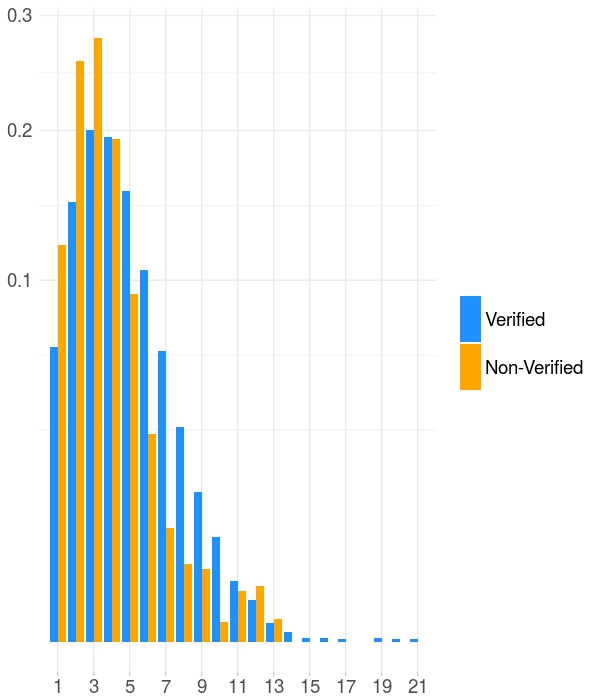
Peripheral aspects of topics such as their geographical distribution (Ren et al. 2016) and the viability of embeddings they induce for sentiment analysis (Ren et al. 2016) tasks have been explored before. This prompted us to extend our inquiry into peripheral measures such as inconsistencies in the variety and number of topics the two classes of users tweet about. In order to obtain an optimal mix of the number of topics per user in an unsupervised manner, we leveraged the use of an Hierarchical Dirichlet Process (HDP) model implementation (Wang et al. 2011) for topic inference. This method streams our corpus of tweets and performs an online Variational Bayes estimation to converge at an optimal number of topics , for each user. Once again, we set and , which are the default settings recommended in existing studies (Griffiths and Steyvers 2004).
The distribution of cardinality for topic sets by verification status are detailed in Figure 4. Inspection of the distribution uncovers a clear trend with non-verified users clearly being over-represented in the lower reaches of the distribution (1–4 topics), while a comparatively substantial portion of verified users are situated in the middle of the distribution (5–10 topics). Also noteworthy is the fact that the very upper echelons of topical variety in tweets are occupied solely by verified users. We posit that this may be owing to the fact that news handles (e.g., ‘@BBC’: 13 topics) and content aggregators (e.g., ‘@GIFs’: 21 topics) are over represented in the set of verified users. The validation of this assertion is left for future work.
6. Conclusion
The coveted nature of platform verification on Twitter has led to the proliferation of verification scams and accusations of systemic bias against certain ideological demographics. Our work attempts to uncover actionable intelligence on the inner workings of the verification system, effectively formulating a checklist of profile attributes a user can work to improve upon to render verification more attainable.
This article presents a framework that computes the strength of a user’s case for verification of Twitter. We introduce our machine learning system that extracts a multitude of features per user, belonging to different classes: user metadata, tweet content, temporal signatures, expressed sentiment, automation probabilities and preferred topics. We also categorize the users in our dataset into intuitive clusters and detail the reasons behind their likely divergent outcomes from the verification procedure. Additionally, we demonstrate role, that a user’s choices and variety over conversational topics plays in precluding or effecting verification.
Our framework represents the first of its kind attempt at discerning and characterizing verification worthy users on Twitter and is able to attain a near perfect classification performance of 99.1% AUC. We believe this framework will empower the average Twitter user to significantly enhance the quality and reach of their online presence without resorting to prohibitively priced social media management solutions.
References
- (1)
- klo (2019) 2019. Klout. https://www.lithium.com/products/klout. Accessed: 2019-02-16.
- Al Maruf et al. (2015) Hasan Al Maruf, Nagib Meshkat, Mohammed Eunus Ali, and Jalal Mahmud. 2015. Human behaviour in different social medias: A case study of Twitter and Disqus. In 2015 IEEE/ACM International Conference on Advances in Social Networks Analysis and Mining (ASONAM). IEEE, 270–273.
- Anuta et al. (2017) David Anuta, Josh Churchin, and Jiebo Luo. 2017. Election bias: Comparing polls and twitter in the 2016 us election. arXiv preprint arXiv:1701.06232 (2017).
- Appling et al. (2015) Darren Scott Appling, Erica J Briscoe, and Clayton J Hutto. 2015. Discriminative models for predicting deception strategies. In Proceedings of the 24th International Conference on World Wide Web. ACM, 947–952.
- Bakshy et al. (2011) Eytan Bakshy, Jake M Hofman, Winter A Mason, and Duncan J Watts. 2011. Everyone’s an influencer: quantifying influence on twitter. In Proceedings of the fourth ACM international conference on Web search and data mining. ACM, 65–74.
- Batista et al. (2004) Gustavo EAPA Batista, Ronaldo C Prati, and Maria Carolina Monard. 2004. A study of the behavior of several methods for balancing machine learning training data. ACM SIGKDD explorations newsletter 6, 1 (2004), 20–29.
- Batool et al. (2013) Rabia Batool, Asad Masood Khattak, Jahanzeb Maqbool, and Sungyoung Lee. 2013. Precise tweet classification and sentiment analysis. In Computer and Information Science (ICIS), 2013 IEEE/ACIS 12th International Conference on. IEEE, 461–466.
- Bollen et al. (2011) Johan Bollen, Huina Mao, and Xiaojun Zeng. 2011. Twitter mood predicts the stock market. Journal of computational science 2, 1 (2011), 1–8.
- Bustle (2018) Bustle. 2018. This Twitter Verification Scam Was Promoted By Twitter Itself, And The Consequences Are Terrifying. https://www.bustle.com/p/this-twitter-verification-scam-was-promoted-by-twitter-itself-the-consequences-are-terrifying-7833920. Accessed: 2018-12-27.
- Canali and Lancellotti (2012) Claudia Canali and Riccardo Lancellotti. 2012. A quantitative methodology based on component analysis to identify key users in social networks. International Journal of Social Network Mining 1, 1 (2012), 27–50.
- Castillo et al. (2011) Carlos Castillo, Marcelo Mendoza, and Barbara Poblete. 2011. Information credibility on twitter. In Proceedings of the 20th international conference on World wide web. ACM, 675–684.
- Cataldi et al. (2010) Mario Cataldi, Luigi Di Caro, and Claudio Schifanella. 2010. Emerging topic detection on twitter based on temporal and social terms evaluation. In Proceedings of the tenth international workshop on multimedia data mining. ACM, 4.
- Cha et al. (2010) Meeyoung Cha, Hamed Haddadi, Fabricio Benevenuto, and Krishna P Gummadi. 2010. Measuring user influence in twitter: The million follower fallacy. In fourth international AAAI conference on weblogs and social media.
- Chaiken (1980) Shelly Chaiken. 1980. Heuristic versus systematic information processing and the use of source versus message cues in persuasion. Journal of personality and social psychology 39, 5 (1980), 752.
- Chavoshi et al. (2016) Nikan Chavoshi, Hossein Hamooni, and Abdullah Mueen. 2016. Identifying correlated bots in twitter. In International Conference on Social Informatics. Springer, 14–21.
- Chu et al. (2012) Zi Chu, Steven Gianvecchio, Haining Wang, and Sushil Jajodia. 2012. Detecting automation of twitter accounts: Are you a human, bot, or cyborg? IEEE Transactions on Dependable and Secure Computing 9, 6 (2012), 811–824.
- Counts and Fisher (2011) Scott Counts and Kristie Fisher. 2011. Taking It All In? Visual Attention in Microblog Consumption. ICWSM 11 (2011), 97–104.
- De Choudhury et al. (2013) Munmun De Choudhury, Michael Gamon, Scott Counts, and Eric Horvitz. 2013. Predicting depression via social media. ICWSM 13 (2013), 1–10.
- Diakopoulos and Zubiaga (2014) Nicholas Diakopoulos and Arkaitz Zubiaga. 2014. Newsworthiness and Network Gatekeeping on Twitter: The Role of Social Deviance.. In ICWSM.
- Dickerson et al. (2014) John P Dickerson, Vadim Kagan, and VS Subrahmanian. 2014. Using sentiment to detect bots on twitter: Are humans more opinionated than bots?. In Proceedings of the 2014 IEEE/ACM International Conference on Advances in Social Networks Analysis and Mining. IEEE Press, 620–627.
- Erdogan (1999) B Zafer Erdogan. 1999. Celebrity endorsement: A literature review. Journal of marketing management 15, 4 (1999), 291–314.
- Ferrara and Yang (2015) Emilio Ferrara and Zeyao Yang. 2015. Measuring emotional contagion in social media. PloS one 10, 11 (2015), e0142390.
- Flanagin and Metzger (2007) Andrew J Flanagin and Miriam J Metzger. 2007. The role of site features, user attributes, and information verification behaviors on the perceived credibility of web-based information. New media & society 9, 2 (2007), 319–342.
- Fogg et al. (2003) Brian J Fogg, Cathy Soohoo, David R Danielson, Leslie Marable, Julianne Stanford, and Ellen R Tauber. 2003. How do users evaluate the credibility of Web sites?: a study with over 2,500 participants. In Proceedings of the 2003 conference on Designing for user experiences. ACM, 1–15.
- Gilani et al. (2017) Zafar Gilani, Reza Farahbakhsh, Gareth Tyson, Liang Wang, and Jon Crowcroft. 2017. An in-depth characterisation of Bots and Humans on Twitter. arXiv preprint arXiv:1704.01508 (2017).
- Gilbert (2014) CJ Hutto Eric Gilbert. 2014. Vader: A parsimonious rule-based model for sentiment analysis of social media text. In Eighth International Conference on Weblogs and Social Media (ICWSM-14). Available at (20/04/16) http://comp. social. gatech. edu/papers/icwsm14. vader. hutto. pdf.
- González-Ibánez et al. (2011) Roberto González-Ibánez, Smaranda Muresan, and Nina Wacholder. 2011. Identifying sarcasm in Twitter: a closer look. In Proceedings of the 49th Annual Meeting of the Association for Computational Linguistics: Human Language Technologies: Short Papers-Volume 2. Association for Computational Linguistics, 581–586.
- Griffiths and Steyvers (2004) Thomas L Griffiths and Mark Steyvers. 2004. Finding scientific topics. Proceedings of the National academy of Sciences 101, suppl 1 (2004), 5228–5235.
- Gupta et al. (2014) Aditi Gupta, Ponnurangam Kumaraguru, Carlos Castillo, and Patrick Meier. 2014. Tweetcred: Real-time credibility assessment of content on twitter. In International Conference on Social Informatics. Springer, 228–243.
- Hamdan et al. (2015) Hussam Hamdan, Patrice Bellot, and Frederic Bechet. 2015. lsislif: Feature extraction and label weighting for sentiment analysis in twitter. In Proceedings of the 9th International Workshop on Semantic Evaluation (SemEval 2015). 568–573.
- Harman and Dredze (2014) GACCT Harman and Mark H Dredze. 2014. Measuring post traumatic stress disorder in Twitter. In ICWSM (2014).
- He et al. (2008) Haibo He, Yang Bai, Edwardo A Garcia, and Shutao Li. 2008. ADASYN: Adaptive synthetic sampling approach for imbalanced learning. In Neural Networks, 2008. IJCNN 2008.(IEEE World Congress on Computational Intelligence). IEEE International Joint Conference on. IEEE, 1322–1328.
- He and Garcia (2008) Haibo He and Edwardo A Garcia. 2008. Learning from imbalanced data. IEEE Transactions on Knowledge & Data Engineering 9 (2008), 1263–1284.
- Hentschel et al. (2014) Martin Hentschel, Omar Alonso, Scott Counts, and Vasileios Kandylas. 2014. Finding users we trust: Scaling up verified Twitter users using their communication patterns. In Eighth International AAAI Conference on Weblogs and Social Media.
- Hong and Davison (2010) Liangjie Hong and Brian D Davison. 2010. Empirical study of topic modeling in twitter. In Proceedings of the first workshop on social media analytics. ACM, 80–88.
- Kubat et al. (1997) Miroslav Kubat, Stan Matwin, et al. 1997. Addressing the curse of imbalanced training sets: one-sided selection. In Icml, Vol. 97. Nashville, USA, 179–186.
- Kursa et al. (2010) Miron B Kursa, Witold R Rudnicki, et al. 2010. Feature selection with the Boruta package. J Stat Softw 36, 11 (2010), 1–13.
- Kwak et al. (2010) Haewoon Kwak, Changhyun Lee, Hosung Park, and Sue Moon. 2010. What is Twitter, a social network or a news media?. In Proceedings of the 19th international conference on World wide web. AcM, 591–600.
- Lampos et al. (2016) Vasileios Lampos, Nikolaos Aletras, Jens K Geyti, Bin Zou, and Ingemar J Cox. 2016. Inferring the socioeconomic status of social media users based on behaviour and language. In European Conference on Information Retrieval. Springer, 689–695.
- Lampos et al. (2014) Vasileios Lampos, Nikolaos Aletras, Daniel Preoţiuc-Pietro, and Trevor Cohn. 2014. Predicting and characterising user impact on Twitter. In Proceedings of the 14th Conference of the European Chapter of the Association for Computational Linguistics. 405–413.
- Lee et al. (2010) Changhyun Lee, Haewoon Kwak, Hosung Park, and Sue Moon. 2010. Finding influentials based on the temporal order of information adoption in twitter. In Proceedings of the 19th international conference on World wide web. ACM, 1137–1138.
- Leskovec and Mcauley (2012) Jure Leskovec and Julian J Mcauley. 2012. Learning to discover social circles in ego networks. In Advances in neural information processing systems. 539–547.
- Maaten and Hinton (2008) Laurens van der Maaten and Geoffrey Hinton. 2008. Visualizing data using t-SNE. Journal of machine learning research 9, Nov (2008), 2579–2605.
- Mahmud et al. (2012) Jalal Mahmud, Jeffrey Nichols, and Clemens Drews. 2012. Where Is This Tweet From? Inferring Home Locations of Twitter Users. ICWSM 12 (2012), 511–514.
- Marwick and Boyd (2011) Alice Marwick and Danah Boyd. 2011. To see and be seen: Celebrity practice on Twitter. Convergence 17, 2 (2011), 139–158.
- McCallum (2002) Andrew Kachites McCallum. 2002. Mallet: A machine learning for language toolkit. (2002).
- McCollister et al. (2015) Caitlin McCollister, Bo Luo, and Shu Huang. 2015. Building Topic Models to Predict Author Attributes from Twitter Messages.. In CLEF.
- Mislove et al. (2011) Alan Mislove, Sune Lehmann, Yong-Yeol Ahn, Jukka-Pekka Onnela, and J Niels Rosenquist. 2011. Understanding the Demographics of Twitter Users. ICWSM 11, 5th (2011), 25.
- Miura et al. (2014) Yasuhide Miura, Shigeyuki Sakaki, Keigo Hattori, and Tomoko Ohkuma. 2014. TeamX: A sentiment analyzer with enhanced lexicon mapping and weighting scheme for unbalanced data. In Proceedings of the 8th International Workshop on Semantic Evaluation (SemEval 2014). 628–632.
- Mocanu et al. (2013) Delia Mocanu, Andrea Baronchelli, Nicola Perra, Bruno Gonçalves, Qian Zhang, and Alessandro Vespignani. 2013. The twitter of babel: Mapping world languages through microblogging platforms. PloS one 8, 4 (2013), e61981.
- Morris et al. (2012) Meredith Ringel Morris, Scott Counts, Asta Roseway, Aaron Hoff, and Julia Schwarz. 2012. Tweeting is believing?: understanding microblog credibility perceptions. In Proceedings of the ACM 2012 conference on computer supported cooperative work. ACM, 441–450.
- Paul et al. (2018) Indraneil Paul, Abhinav Khattar, Ponnurangam Kumaraguru, Manish Gupta, and Shaan Chopra. 2018. Elites Tweet? Characterizing the Twitter Verified User Network. arXiv preprint arXiv:1812.09710 (2018).
- Pennebaker et al. (2015) James W Pennebaker, Ryan L Boyd, Kayla Jordan, and Kate Blackburn. 2015. The development and psychometric properties of LIWC2015. Technical Report.
- Preoţiuc-Pietro et al. (2015) Daniel Preoţiuc-Pietro, Svitlana Volkova, Vasileios Lampos, Yoram Bachrach, and Nikolaos Aletras. 2015. Studying user income through language, behaviour and affect in social media. PloS one 10, 9 (2015), e0138717.
- Ramteke et al. (2016) Jyoti Ramteke, Samarth Shah, Darshan Godhia, and Aadil Shaikh. 2016. Election result prediction using Twitter sentiment analysis. In Inventive Computation Technologies (ICICT), International Conference on, Vol. 1. IEEE, 1–5.
- Rao et al. (2015) Adithya Rao, Nemanja Spasojevic, Zhisheng Li, and Trevor Dsouza. 2015. Klout score: Measuring influence across multiple social networks. In 2015 IEEE International Conference on Big Data (Big Data). IEEE, 2282–2289.
- Ren et al. (2016) Yafeng Ren, Yue Zhang, Meishan Zhang, and Donghong Ji. 2016. Improving twitter sentiment classification using topic-enriched multi-prototype word embeddings. In Thirtieth AAAI conference on artificial intelligence.
- Statista (2018) Statista. 2018. Most popular tweets on Twitter as of November 2018, by number of retweets. https://www.statista.com/statistics/699462/twitter-most-retweeted-posts-all-time/. Accessed: 2018-12-22.
- Stenqvist and Lönnö (2017) Evita Stenqvist and Jacob Lönnö. 2017. Predicting Bitcoin price fluctuation with Twitter sentiment analysis.
- Steyvers et al. (2004) Mark Steyvers, Padhraic Smyth, Michal Rosen-Zvi, and Thomas Griffiths. 2004. Probabilistic author-topic models for information discovery. In Proceedings of the tenth ACM SIGKDD international conference on Knowledge discovery and data mining. ACM, 306–315.
- Sundar (2008) S Shyam Sundar. 2008. The MAIN model: A heuristic approach to understanding technology effects on credibility. Digital media, youth, and credibility 73100 (2008).
- Tadesse et al. (2018) Michael M Tadesse, Hongfei Lin, Bo Xu, and Liang Yang. 2018. Personality Predictions Based on User Behavior on the Facebook Social Media Platform. IEEE Access 6 (2018), 61959–61969.
- TechAcute (2018) TechAcute. 2018. Top 40 List of the Most-Liked Tweets on Twitter. https://techacute.com/list-most-liked-tweets/. Accessed: 2018-12-22.
- Tomek (1976) Ivan Tomek. 1976. Two modifications of CNN. IEEE Trans. Systems, Man and Cybernetics 6 (1976), 769–772.
- TripWire (2019) TripWire. 2019. Get Verified Through a Promoted Tweet? Nope. It’s a Scam! https://www.tripwire.com/state-of-security/latest-security-news/get-verified-promoted-tweet-nope-scam/. Accessed: 2019-1-29.
- Twitter (2018) Twitter. 2018. Verified account FAQs. https://help.twitter.com/en/managing-your-account/twitter-verified-accounts. Accessed: 2018-12-22.
- Twitter (2019a) Twitter. 2019a. About Verified Accounts: Twitter Help 2018. https://help.twitter.com/en/managing-your-account/about-twitter-verified-accounts. Accessed: 2018-12-22.
- Twitter (2019b) Twitter. 2019b. Twitter Support Statement. https://twitter.com/TwitterSupport/status/930926124892168192. Accessed: 2019-1-22.
- Varol et al. (2017) Onur Varol, Emilio Ferrara, Clayton Davis, Filippo Menczer, and Alessandro Flammini. 2017. Online Human-Bot Interactions: Detection, Estimation, and Characterization. https://aaai.org/ocs/index.php/ICWSM/ICWSM17/paper/view/15587/14817
- Volkova et al. (2017) Svitlana Volkova, Kyle Shaffer, Jin Yea Jang, and Nathan Hodas. 2017. Separating facts from fiction: Linguistic models to classify suspicious and trusted news posts on twitter. In Proceedings of the 55th Annual Meeting of the Association for Computational Linguistics (Volume 2: Short Papers), Vol. 2. 647–653.
- Wang (2010a) Alex Hai Wang. 2010a. Detecting spam bots in online social networking sites: a machine learning approach. In IFIP Annual Conference on Data and Applications Security and Privacy. Springer, 335–342.
- Wang (2010b) Alex Hai Wang. 2010b. Don’t follow me: Spam detection in twitter. In 2010 international conference on security and cryptography (SECRYPT). IEEE, 1–10.
- Wang et al. (2011) Chong Wang, John Paisley, and David Blei. 2011. Online variational inference for the hierarchical Dirichlet process. In Proceedings of the Fourteenth International Conference on Artificial Intelligence and Statistics. 752–760.
- Warriner et al. (2013) Amy Beth Warriner, Victor Kuperman, and Marc Brysbaert. 2013. Norms of valence, arousal, and dominance for 13,915 English lemmas. Behavior research methods 45, 4 (2013), 1191–1207.
- Weng et al. (2010) Jianshu Weng, Ee-Peng Lim, Jing Jiang, and Qi He. 2010. Twitterrank: finding topic-sensitive influential twitterers. In Proceedings of the third ACM international conference on Web search and data mining. ACM, 261–270.
- Wu et al. (2011) Shaomei Wu, Jake M Hofman, Winter A Mason, and Duncan J Watts. 2011. Who says what to whom on twitter. In Proceedings of the 20th international conference on World wide web. ACM, 705–714.
- Yardi et al. (2010) Sarita Yardi, Daniel Romero, Grant Schoenebeck, et al. 2010. Detecting spam in a twitter network. First Monday 15, 1 (2010).
- Zhang and Paxson (2011) Chao Michael Zhang and Vern Paxson. 2011. Detecting and analyzing automated activity on twitter. In International Conference on Passive and Active Network Measurement. Springer, 102–111.
- Zubiaga et al. (2011) Arkaitz Zubiaga, Damiano Spina, Víctor Fresno, and Raquel Martínez. 2011. Classifying trending topics: a typology of conversation triggers on twitter. In Proceedings of the 20th ACM international conference on Information and knowledge management. ACM, 2461–2464.