Chemical Abundances Of Open Clusters From High-Resolution Infrared Spectra. I. NGC 69402018Chemical Abundances Of Open Clusters From High-Resolution Infrared Spectra. I. NGC 6940–References
Abstract
We present near-infrared spectroscopic analysis of 12 red giant members of the Galactic open cluster NGC 6940. High-resolution (R45000) and high signal-to-noise ratio (S/N 100) near-infrared and band spectra were gathered with the Immersion Grating Infrared Spectrograph (IGRINS) on the 2.7m Smith Telescope at McDonald Observatory. We obtained abundances of H-burning (C, N, O), (Mg, Si, S, Ca), light odd-Z (Na, Al, P, K), Fe-group (Sc, Ti, Cr, Fe, Co, Ni) and neutron-capture (Ce, Nd, Yb) elements. We report the abundances of S, P, K, Ce, and Yb in NGC 6940 for the first time. Many OH and CN features in the band were used to obtain O and N abundances. C abundances were measured from four different features: CO molecular lines in the band, high excitation C i lines present in both near-infrared and optical, CH and C2 bands in the optical region. We have also determined 12C/13C ratios from the R-branch band heads of first overtone (20) and (31) 12CO and (20) 13CO lines near 23440 Å and (31) 13CO lines at about 23730 Å. We have also investigated the HF feature at 23358.3 Å, finding solar fluorine abundances without ruling out a slight enhancement. For some elements (such as the group), IGRINS data yield more internally self-consistent abundances. We also revisited the CMD of NGC 6940 by determining the most probable cluster members using DR2. Finally, we applied Victoria isochrones and MESA models in order to refine our estimates of the evolutionary stages of our targets.
Keywords:
stars: abundances – stars: atmospheres. Galaxy: open clusters and associations: individual: NGC 69401 Introduction
Photometry and spectroscopy of evolved stars in open clusters contain vital information for better understanding of stellar evolution, internal nucleosynthesis, and envelope mixing. Compared to field stars, cluster members can be more easily tagged in mass, metallicity, age, and reddening, allowing one to use high resolution spectroscopy to derive reliable model atmospheres and surface chemical compositions. Of particular interest are the abundances of light elements and isotopes that can be altered through hydrogen fusion cycles: Li, C, N, O, and 12C/13C.
| Star | RA() | Dec() | Va | Hb | Kb | Gc | (GBPGRP)d | Date | Exposure | S/N | ||
| (UT) | (s) | |||||||||||
| MMU 28 | 20 33 25.01 | 28 00 46.8 | 11.56 | 9.05 | 8.93 | 11.22 | 1.33 | 0.91 | 2.06 | 31 07 2015 | 300 | 115 |
| MMU 30 | 20 33 29.80 | 28 17 04.8 | 10.89 | 8.27 | 8.18 | 10.61 | 1.38 | 1.05 | 2.14 | 31 07 2015 | 300 | 117 |
| MMU 60 | 20 33 59.57 | 28 03 01.6 | 11.56 | 9.10 | 8.97 | 11.24 | 1.31 | 0.90 | 2.02 | 31 07 2015 | 300 | 94 |
| MMU 69 | 20 34 05.74 | 28 11 18.2 | 11.64 | 9.07 | 8.95 | 11.28 | 1.34 | 0.87 | 2.12 | 01 08 2015 | 300 | 126 |
| MMU 87 | 20 34 14.70 | 28 22 15.7 | 11.32 | 8.87 | 8.74 | 11.00 | 1.30 | 0.87 | 2.01 | 01 08 2015 | 300 | 116 |
| MMU 101 | 20 34 23.64 | 28 24 25.5 | 11.27 | 8.87 | 8.74 | 10.96 | 1.28 | 0.89 | 1.96 | 01 08 2015 | 300 | 155 |
| MMU 105 | 20 34 25.46 | 28 05 05.5 | 10.66 | 7.95 | 7.82 | 10.30 | 1.40 | 1.01 | 2.27 | 06 08 2015 | 300 | 154 |
| MMU 108 | 20 34 25.68 | 28 13 41.5 | 11.19 | 8.86 | 8.70 | 10.88 | 1.27 | 0.83 | 1.92 | 01 08 2015 | 300 | 113 |
| MMU 132 | 20 34 40.11 | 28 26 38.8 | 10.97 | 8.49 | 8.39 | 10.65 | 1.29 | 0.89 | 2.01 | 08 08 2015 | 300 | 139 |
| MMU 138 | 20 34 45.87 | 28 09 04.6 | 11.36 | 8.96 | 8.81 | 11.05 | 1.28 | 0.87 | 1.98 | 16 06 2016 | 420 | 129 |
| MMU 139 | 20 34 47.60 | 28 14 47.1 | 11.38 | 8.94 | 8.80 | 11.05 | 1.28 | 0.89 | 2.02 | 08 08 2015 | 300 | 156 |
| MMU 152 | 20 34 56.64 | 28 14 27.0 | 10.84 | 8.35 | 8.26 | 10.50 | 1.27 | 0.87 | 2.01 | 16 06 2016 | 300 | 105 |
| a Larsson-Leander 1960 | ||||||||||||
| b Cutri et al. 2003 | ||||||||||||
| c Gaia Collaboration et al. 2018 | ||||||||||||
| d Cantat-Gaudin et al. 2018 | ||||||||||||
Open star cluster formation theories generally assume chemically homogeneous molecular clouds. With few exceptions (e.g. for M67 see Souto et al. 2018; Bertelli Motta et al. 2018; Gao et al. 2018; Randich et al. 2006), detailed abundances for main sequence (MS) stars have not been derived for the kinds of intermediate/old open clusters that have well-developed red giant branches. Therefore the default assumption is that for solar metallicity11 1 We adopt the standard spectroscopic notation (Wallerstein & Helfer 1959) that for elements A and B, [A/B] log10(NA/NB)⋆ log10(NA/NB)⊙. We use the definition log (A) log10(NA/NH) + 12.0, and equate metallicity with the stellar [Fe/H] value. clusters (which encompass the vast majority of known cases), the natal light element abundance ratios are equal to the solar ones. Departures from the solar ratios in evolved cluster members are assumed to be due to stellar evolutionary effects.
LiCNO abundances of open cluster red giants usually have been derived from features present in high-resolution optical22 2 In this paper we will use “optical” or “opt” to refer to the spectral domain 9000 Å, and “” to refer to the (1.5-1.8 ) and (2.0-2.4 ) near- photometric bands. For internal consistency we will use Å wavelength units throughout. wavelength spectra: C from CH and C2 bands, N from CN bands, O from the [O i] 6300 Å line, and Li from the Li i 6707 Å resonance doublet. All of these spectral features have assets and liabilities. For example, the single O abundance indicator33 3 Other O abundance features all have observational and analytic difficulties. The [O i] 6363.8 Å line is blended with CN and lies in a general flux depression caused by the Ca i 6361.8 Å auto ionization line. The O i 7770 Å triplet is subject to large non-local thermodynamic equilibrium (NLTE) corrections. The OH electronic transition bands occur at wavelengths below 3300 Å, a low-flux complex line region that is very difficult to be studied from the ground. has a significant Ni i blend and lies near telluric O2 and night sky emission lines. The CH G band is often very strong and it occurs in the heavily contaminated 4300 Å region, while the C2 Swan bands near 4720, 5170, and 5630 Å are weak and blended. CN transitions can easily be observed throughout the red region, but are mostly very weak except for 8000 Å; N abundances from CN also are completely dependent on derived C abundances.
The wavelength domain contains several species that can greatly improve on CNO abundances determined from optical spectra. OH vibration-rotation band lines occur throughout the 12 m region, as do stronger lines of the CN red electronic system. There are many high-excitation C i transitions in the spectral region. Analyses of these CNO abundance indicators together with those in the optical region should yield reliable abundances for use in stellar evolution studies.
High-resolution spectroscopy of globular cluster red giants in the band has been conducted over the last couple of decades with Keck/NIRSPEC (McLean et al. 1998) and VLT/CRIRES (Kaeufl et al. 2004) instruments (e.g. Origlia et al. 2002; Origlia & Rich 2004; Origlia et al. 2005; Origlia et al. 2008; Valenti et al. 2011; de Laverny & Recio-Blanco 2013; Valenti et al. 2015). The detailed chemical abundances of some Galactic globular clusters were also studied by Lamb et al. 2015 using high-resolution spectral data obtained both in the optical and band regions. Most recently, Lamb et al. 2017 reported the abundances for metal-poor stars in and towards the Galactic Centre from band spectra taken with the RAVEN multi-object science demonstrator and IRCS/Subaru instrument. A few chemical composition studies of open cluster members have been performed with the Keck/NIRSPEC and VLT/CRIRES (e.g. Origlia et al. 2006; Maiorca et al. 2014) as well as with TNG/Giano (Oliva et al. 2012 and references therein); see for example Origlia et al. 2013; Origlia et al. 2016. Elemental abundances for a limited number of open clusters have been investigated using the band spectral data of APOGEE (R 25,000, Majewski et al. 2017); see for example Cunha et al. 2015, Souto et al. 2016, Linden et al. 2017, Souto et al. 2018.
In this paper we present an abundance study of the intermediate age open cluster (OC) NGC 6940, using high resolution spectra. This work is part of a series of studies that involve chemical composition analyses of selected red giant (RG) members of OCs from high-resolution spectra obtained in both optical and spectral regions. The results from the optical spectral range of the 12 RG members of NGC 6940 have been previously reported by Böcek Topcu et al. 2016 (hereafter Paper 1). In this study, we present abundances obtained from high-resolution and band spectra for the same RG members of NGC 6940. To the best of our knowledge, this study is the first of its kind that reports internally-consistent abundances for a large number of OC red giants using high resolution spectra in the optical (51008800 Å) and the complete and bands. Our investigation puts special emphasis on determining better CNO abundances towards interpretation of H-fusion synthesis and mixing in open clusters.
2 Observations and Data Reduction
High-resolution () and high S/N spectra of the NGC 6940 targets were obtained with the Immersion Grating Infrared Spectrometer (IGRINS, Yuk et al. 2010; Park et al. 2014; Mace et al. 2016) on the 2.7m Harlan J. Smith Telescope at McDonald Observatory. Observations were made between July 2015 and June 2016. Stellar coordinates, broad-band photometric data, magnitudes, colours, and the observation log are given in Table 1.
IGRINS has total wavelength coverage of 1.482.48 m with only about 100 Å lost in the middle, unobservable from the ground due to heavy telluric absorption. This large wavelength coverage is obtained in a single observation per star, with the and spectral regions being captured by different camera/detector systems.44 4 See Figure 1 at http://www.as.utexas.edu/astronomy/research/people/jaffe/igrins.html Flat field, ThAr lamp and sky calibration frames were taken during each night. The spectra of targets and of hot, rapidly-rotating telluric standards were taken by nodding the stars along the slit with a four-integration ABBA pattern.
To reduce the data frames we used the IGRINS reduction pipeline package PLP2 (Lee 2015).55 5 https://github.com/igrins/plp The PLP2 software applies basic echelle reduction steps such as sky subtraction, flat fielding, bad pixel correction, background removal, aperture extraction, and wavelength calibration. Wavelength solutions were derived from the Th-Ar lamp lines and then improved by using sky OH emission lines. To remove the contamination of CO2 lines we have used the telluric task of IRAF66 6 http://iraf.noao.edu/. More detail about the reduction process can be found in Afşar et al. 2016.
| Star | (Gaia) | (Gaia) | RVa | RV | RV(Gaia) | |
|---|---|---|---|---|---|---|
| (mas yr-1) | (mas yr-1) | (mas yr-1) | (km s-1) | (km s-1) | (km s-1) | |
| MMU 28 | 1.0010.033 | 2.0150.047 | 9.5230.055 | 8.240.25 | 8.900.22 | 8.700.37 |
| MMU 30 | 0.9580.028 | 1.9190.042 | 9.3820.048 | 7.460.15 | 7.960.20 | 8.030.25 |
| MMU 60 | 0.9770.029 | 2.2400.042 | 9.2630.041 | 7.320.25 | 7.660.22 | 7.410.32 |
| MMU 69 | 0.9300.027 | 2.0460.042 | 9.3290.038 | 7.540.25 | 8.080.24 | 8.210.34 |
| MMU 87 | 0.9980.032 | 1.9850.044 | 9.4620.040 | 8.060.26 | 7.980.27 | 8.130.30 |
| MMU 101 | 1.0000.035 | 1.9730.051 | 9.4600.046 | 7.360.21 | 7.740.23 | 6.920.38 |
| MMU 105 | 0.9790.031 | 1.9550.042 | 9.3460.043 | 7.610.29 | 7.740.23 | 8.380.23 |
| MMU 108 | 0.8830.033 | 1.5340.045 | 9.2350.041 | 7.510.34 | 7.390.25 | 8.100.50 |
| MMU 132 | 1.0050.038 | 2.0150.051 | 9.3140.047 | 7.480.25 | 7.760.42 | 7.620.28 |
| MMU 138 | 0.9200.029 | 1.8030.042 | 9.4570.040 | 8.120.32 | 8.220.23 | 7.900.30 |
| MMU 139 | 0.9750.031 | 2.0460.045 | 9.5230.046 | 7.970.21 | 7.530.23 | 8.250.32 |
| MMU 152 | 0.9820.032 | 1.9240.044 | 9.3780.041 | 8.910.24 | 9.280.24 | 9.320.21 |
| mean | 0.9670.011 | 1.9550.048 | 9.3890.028 | 7.800.14 | 7.910.12 | 8.080.18 |
| 0.038 | 0.168 | 0.096 | 0.47 | 0.41 | 0.61 | |
| a This study. | ||||||
3 Kinematics, Distances, and Luminosities

The second data release (DR2) of the astrometric satellite mission (Gaia Collaboration et al. 2016; Gaia Collaboration et al. 2018) includes kinematic information for all of our NGC 6940 RG stars. In Table 2 we list parallaxes, proper motions, and radial velocities (RVs) along with the RVs measured from both and optical (Paper 1) spectra. RVs were measured in the same manner as described in Paper 1 using the regions that are less affected by the atmospheric lines. All radial velocities are in excellent agreement within about 0.5 km s-1. The RVs from our data set yield a cluster mean of RVmean 7.91 0.14 ( = 0.49) km s-1, and a star-by-star comparison with yields RVGaia RVmean = 0.17 0.11 ( = 0.39). In all data sets MMU 152 stands out from the cluster mean: RVMMU152 9.20 km s-1, slightly outside the observational uncertainties. However, its parallax and proper motions are well within the cluster means, confirming its membership in NGC 6940.
Paper 1 investigated the color magnitude diagram (CMD) of NGC 6940 by using the data provided by in WEBDA77 7 http://www.univie.ac.at/webda/webda.html database (Walker 1958; Larsson-Leander 1960; Hoag et al. 1961; Stetson 2000). Here we revisit the CMD and gather the data from Cantat-Gaudin et al. 2018 who studied the open cluster population in the Milky Way by making use of DR2. Among the members listed in Cantat-Gaudin et al. 2018, we only used the ones with membership probabilities 80%. We plot the CMD in Figure 1. We illustrated our targets by framing their locations with circles and one square for MMU 152. The mean parallax of the cluster from these stars is (Gaia) = 0.949 0.002 ( = 0.052) (miliarcsec), which is about 0.350 less than the parallax we adopted from Kharchenko et al. 2005 in Paper 1. This difference cannot be due to systematics in parallaxes, which can be up to 0.03 throughout the sky as recently investigated by Arenou et al. 2018 in detail. Figure 1 also contains theoretical isochrones and evolutionary tracks that are needed for interpretation of the chemical compositions derived in this study. The true distance modulus (m-M)0 = 10.11 information for NGC 6940 is also given in the Figure along with , which is the reddening estimate obtained from the fit of isochrones to the MS stars > 1.5 mag below the cluster turnoff when the distance modulus based on parallaxes is adopted. These curves need extended discussion, which we defer to §7.1.
| Star | (Gaia) | (LDR) | log g | [Fe i/H] | # | [Fe ii/H] | # | [Fe i/H] | # | |||||
|---|---|---|---|---|---|---|---|---|---|---|---|---|---|---|
| (K) | (K) | (K) | (km s-1) | (opt) | (opt) | (opt) | (opt) | (opt) | (opt) | () | () | () | ||
| MMU 28 | 5024 | 4742 | 5052 | 2.89 | 1.03 | 0.03 | 0.07 | 56 | 0.07 | 0.05 | 11 | 0.00 | 0.04 | 19 |
| MMU 30 | 4959 | 4706 | 4977 | 2.85 | 1.32 | 0.01 | 0.07 | 53 | 0.04 | 0.08 | 10 | 0.00 | 0.04 | 24 |
| MMU 60 | 5046 | 4683 | 5048 | 2.97 | 0.97 | 0.04 | 0.06 | 50 | 0.01 | 0.08 | 9 | 0.06 | 0.05 | 20 |
| MMU 69 | 5004 | 4649 | 5068 | 2.90 | 1.05 | 0.03 | 0.06 | 55 | 0.07 | 0.08 | 10 | 0.03 | 0.05 | 24 |
| MMU 87 | 5023 | 4692 | 5048 | 2.85 | 1.07 | 0.05 | 0.07 | 50 | 0.03 | 0.06 | 10 | 0.07 | 0.04 | 25 |
| MMU 101 | 5037 | 4767 | 5035 | 3.02 | 1.16 | 0.01 | 0.07 | 55 | 0.02 | 0.06 | 8 | 0.05 | 0.04 | 23 |
| MMU 105 | 4765 | 4580 | 4893 | 2.34 | 1.35 | 0.10 | 0.07 | 53 | 0.15 | 0.08 | 8 | 0.04 | 0.06 | 24 |
| MMU 108 | 5132 | 4802 | 5082 | 2.80 | 1.28 | 0.15 | 0.07 | 54 | 0.22 | 0.03 | 9 | 0.06 | 0.06 | 18 |
| MMU 132 | 4962 | 4822 | 4972 | 2.65 | 1.29 | 0.01 | 0.05 | 51 | 0.09 | 0.09 | 10 | 0.09 | 0.05 | 24 |
| MMU 138 | 5056 | 4703 | 5073 | 3.00 | 1.10 | 0.00 | 0.06 | 47 | 0.05 | 0.04 | 8 | 0.03 | 0.08 | 21 |
| MMU 139 | 5013 | 4789 | 4958 | 2.99 | 1.10 | 0.01 | 0.07 | 51 | 0.03 | 0.05 | 8 | 0.06 | 0.06 | 23 |
| MMU 152 | 4933 | 4846 | 4941 | 2.66 | 1.36 | 0.06 | 0.06 | 52 | 0.13 | 0.06 | 10 | 0.00 | 0.07 | 19 |
4 Model Atmospheres and Abundances from the Optical Window
In Paper 1 we reported model atmospheric parameters , log g, , [Fe/H], absolute abundances log (Li), the 12C/13C ratios, and relative abundances [X/Fe] of 22 elements for 12 NGC 6940 RG members (see Table 9 in Paper 1). Here we additionally report the abundances of S and Ce from their neutral and ionized species, respectively, and determine C abundances also from high excitation C i lines (Table 4). We also reanalyse the Sc ii lines adopting the log gf values from Lawler & Dakin 1989. The abundance analyses were carried out using high-resolution, high-S/N optical spectra obtained with the 9.2-m Hobby-Eberly Telescope (HET) High-Resolution Spectrograph (HRS; Tull 1998) at the McDonald Observatory. We used the local thermodynamic equilibrium (LTE) line analysis and synthetic spectrum code MOOG (Sneden 1973)88 8 http://www.as.utexas.edu/~chris/moog.html to derive the model atmospheric parameters (, log g, [Fe/H] and ) and chemical abundances. The model atmospheric parameters were determined from equivalent width ( 99 9 Equivalent width and line depth ratio (LDR) measurements were completed in the same manner described in Paper 1.) measurements of Fe i, Fe ii, Ti i, and Ti ii lines (Table 6 of Paper 1). Those parameters are adopted without change in this study and are listed in Table 3.
An extended description of the optical abundance analyses is given in Paper 1, in which we derived solar photospheric abundances in the same manner as those in the program stars, making in effect the stellar abundances into differential values relative to the Sun. In the present study we have adopted the solar abundances of Asplund et al. 2009. While most of the optical region lines have reliable laboratory transition probabilities, many more lines in our spectra must have transition probabilities derived from reverse solar analysis. Therefore we adopt uniformly the Asplund et al. 2009 solar values in this work. In the upper part of Table 4 we list the relative optical abundance ratios using this assumed set of solar abundances. In this paper we will examine the LiCNO group abundances in more detail than was done in Paper 1, including a re-assessment of the values derived from optical data. In Table 4 these abundances and 12C/13C ratios are entered at the ends of the rows for optical and IR results, and will be discussed separately in §6.5. The [X/Fe] calculations were performed by taking species by species differences using both Fe i and Fe ii abundances.
5 Temperature determination from the region

| Species | MMU | ||||||||||||||
| 28 | 30 | 60 | 69 | 87 | 101 | 105 | 108 | 132 | 138 | 139 | 152 | mean | #max | ||
| Optical Spectral Region | |||||||||||||||
| Na i | 0.23 | 0.22 | 0.19 | 0.24 | 0.12 | 0.24 | 0.34 | 0.45 | 0.34 | 0.16 | 0.20 | 0.53 | 0.27 | 0.12 | 4 |
| Mg i | 0.06 | 0.01 | 0.05 | 0.05 | 0.03 | 0.08 | 0.10 | 0.17 | 0.09 | 0.07 | 0.05 | 0.13 | 0.07 | 0.04 | 2 |
| Al i | 0.07 | 0.10 | 0.12 | 0.03 | 0.07 | 0.08 | 0.02 | 0.09 | 0.02 | 0.06 | 0.05 | 0.05 | 0.04 | 0.06 | 2 |
| Si i | 0.21 | 0.23 | 0.12 | 0.22 | 0.19 | 0.24 | 0.27 | 0.22 | 0.29 | 0.16 | 0.24 | 0.30 | 0.22 | 0.05 | 15 |
| S i∗ | 0.13 | 0.11 | 0.04 | 0.12 | 0.08 | 0.10 | 0.15 | 0.21 | 0.19 | 0.15 | 0.15 | 0.25 | 0.16 | 0.06 | 2 |
| Ca i | 0.13 | 0.07 | 0.12 | 0.16 | 0.10 | 0.09 | 0.15 | 0.18 | 0.14 | 0.05 | 0.12 | 0.11 | 0.14 | 0.04 | 10 |
| Sc ii∗ | 0.11 | 0.16 | 0.14 | 0.24 | 0.11 | 0.23 | 0.16 | 0.13 | 0.13 | 0.16 | 0.17 | 0.24 | 0.16 | 0.05 | 6 |
| Ti i | 0.06 | 0.09 | 0.06 | 0.08 | 0.10 | 0.07 | 0.08 | 0.00 | 0.05 | 0.01 | 0.09 | 0.04 | 0.06 | 0.03 | 11 |
| Ti ii | 0.07 | 0.14 | 0.07 | 0.08 | 0.06 | 0.10 | 0.09 | 0.15 | 0.16 | 0.11 | 0.18 | 0.09 | 0.11 | 0.04 | 4 |
| V i | 0.03 | 0.03 | 0.07 | 0.05 | 0.10 | 0.02 | 0.06 | 0.03 | 0.03 | 0.01 | 0.07 | 0.01 | 0.04 | 0.04 | 12 |
| Cr i | 0.06 | 0.04 | 0.06 | 0.10 | 0.04 | 0.05 | 0.07 | 0.12 | 0.06 | 0.10 | 0.01 | 0.06 | 0.06 | 0.03 | 14 |
| Cr ii | 0.23 | 0.29 | 0.19 | 0.17 | 0.22 | 0.21 | 0.27 | 0.20 | 0.39 | 0.17 | 0.26 | 0.23 | 0.24 | 0.06 | 3 |
| Mn i | 0.06 | 0.08 | 0.07 | 0.09 | 0.11 | 0.08 | 0.15 | 0.06 | 0.03 | 0.07 | 0.10 | 0.03 | 0.08 | 0.03 | 3 |
| Co i | 0.12 | 0.09 | 0.15 | 0.13 | 0.17 | 0.08 | 0.14 | 0.11 | 0.11 | 0.11 | 0.12 | 0.07 | 0.12 | 0.03 | 5 |
| Ni i | 0.09 | 0.09 | 0.07 | 0.09 | 0.08 | 0.11 | 0.11 | 0.06 | 0.08 | 0.08 | 0.14 | 0.10 | 0.09 | 0.02 | 29 |
| Cu i | 0.01 | 0.07 | 0.03 | 0.02 | 0.04 | 0.01 | 0.06 | 0.02 | 0.04 | 0.02 | 0.04 | 0.11 | 0.01 | 0.05 | 1 |
| Zn i | 0.08 | 0.08 | 0.12 | 0.10 | 0.03 | 0.10 | 0.18 | 0.04 | 0.09 | 0.05 | 0.20 | 0.03 | 0.09 | 0.05 | 1 |
| Y ii | 0.12 | 0.15 | 0.07 | 0.12 | 0.06 | 0.10 | 0.08 | 0.22 | 0.07 | 0.09 | 0.16 | 0.14 | 0.12 | 0.05 | 4 |
| La ii | 0.20 | 0.26 | 0.12 | 0.24 | 0.18 | 0.29 | 0.16 | 0.23 | 0.21 | 0.25 | 0.21 | 0.22 | 0.21 | 0.05 | 4 |
| Ce ii∗ | 0.12 | 0.18 | 0.08 | 0.13 | 0.07 | 0.13 | 0.03 | 0.09 | 0.06 | 0.16 | 0.15 | 0.17 | 0.11 | 0.05 | 4 |
| Nd ii | 0.26 | 0.32 | 0.22 | 0.23 | 0.29 | 0.32 | 0.23 | 0.21 | 0.25 | 0.23 | 0.25 | 0.32 | 0.26 | 0.04 | 3 |
| Eu ii | 0.07 | 0.16 | 0.11 | 0.14 | 0.08 | 0.15 | 0.14 | 0.15 | 0.13 | 0.20 | 0.15 | 0.15 | 0.13 | 0.04 | 2 |
| log (Li) | 1.05 | 0.0 | 1.23 | 1.29 | 0.56 | 0.64 | 0.1 | 0.0 | 0.33 | 1.05 | 0.86 | 0.0 | 1 | ||
| 12C/13C | 25 | 15 | 20 | 10 | 25 | 15 | 15 | 20 | 25 | 20 | 15 | 6 | 18 | 6 | CN |
| C | 0.19 | 0.20 | 0.30 | 0.24 | 0.22 | 0.24 | 0.27 | 0.17 | 0.27 | 0.15 | 0.23 | 0.41 | 0.24 | 0.07 | C2, C i |
| N | 0.42 | 0.41 | 0.47 | 0.48 | 0.42 | 0.48 | 0.41 | 0.58 | 0.42 | 0.47 | 0.39 | 0.55 | 0.46 | 0.06 | CN |
| O | 0.08 | 0.05 | 0.17 | 0.07 | 0.04 | 0.05 | 0.14 | 0.09 | 0.22 | 0.00 | 0.05 | 0.08 | 0.09 | 0.06 | [O i] |
| IGRINS H & K Spectral Region | |||||||||||||||
| Na i | 0.28 | 0.29 | 0.16 | 0.27 | 0.20 | 0.23 | 0.34 | 0.51 | 0.18 | 0.25 | 0.15 | 0.54 | 0.28 | 0.13 | 5 |
| Mg i | 0.05 | 0.01 | 0.00 | 0.05 | 0.00 | 0.06 | 0.02 | 0.07 | 0.02 | 0.02 | 0.02 | 0.07 | 0.02 | 0.04 | 11 |
| Al i | 0.11 | 0.09 | 0.05 | 0.05 | 0.06 | 0.08 | 0.14 | 0.06 | 0.07 | 0.02 | 0.03 | 0.21 | 0.07 | 0.07 | 6 |
| Si i | 0.13 | 0.16 | 0.13 | 0.14 | 0.14 | 0.13 | 0.16 | 0.17 | 0.12 | 0.16 | 0.14 | 0.19 | 0.15 | 0.02 | 11 |
| P i | 0.05 | 0.05 | 0.02 | 0.09 | 0.08 | 0.16 | 0.15 | 0.21 | 0.25 | 0.05 | 0.13 | 0.29 | 0.10 | 0.12 | 2 |
| S i | 0.08 | 0.11 | 0.07 | 0.08 | 0.02 | 0.06 | 0.08 | 0.11 | 0.06 | 0.06 | 0.03 | 0.11 | 0.07 | 0.04 | 10 |
| K i | 0.00 | 0.03 | 0.21 | 0.13 | 0.07 | 0.13 | 0.22 | 0.45 | 0.10 | 0.17 | 0.15 | 0.39 | 0.17 | 0.13 | 2 |
| Ca i | 0.21 | 0.15 | 0.08 | 0.16 | 0.15 | 0.09 | 0.19 | 0.16 | 0.13 | 0.14 | 0.14 | 0.16 | 0.15 | 0.04 | 11 |
| Sc i | 0.06 | 0.04 | 0.17 | 0.16 | 0.07 | 0.10 | 0.18 | 0.09 | 0.00 | 0.08 | 0.08 | 0.05 | 0.00 | 0.11 | 2 |
| Ti i | 0.03 | 0.04 | 0.02 | 0.02 | 0.00 | 0.01 | 0.03 | 0.08 | 0.02 | 0.10 | 0.00 | 0.03 | 0.01 | 0.04 | 10 |
| Ti ii | 0.02 | 0.01 | 0.08 | 0.15 | 0.08 | 0.11 | 0.06 | 0.03 | 0.07 | 0.05 | 0.02 | 0.04 | 0.05 | 0.05 | 1 |
| Cr i | 0.07 | 0.03 | 0.01 | 0.03 | 0.03 | 0.04 | 0.07 | 0.03 | 0.03 | 0.02 | 0.01 | 0.09 | 0.01 | 0.05 | 3 |
| Co i | 0.00 | 0.01 | 0.13 | 0.01 | 0.03 | 0.00 | 0.08 | 0.00 | 0.01 | 0.04 | 0.01 | 0.07 | 0.00 | 0.05 | 1 |
| Ni i | 0.15 | 0.08 | 0.08 | 0.04 | 0.05 | 0.02 | 0.04 | 0.04 | 0.02 | 0.09 | 0.06 | 0.09 | 0.06 | 0.04 | 6 |
| Ce ii | 0.31 | 0.37 | 0.20 | 0.23 | 0.21 | 0.26 | 0.15 | 0.30 | 0.12 | 0.22 | 0.31 | 0.15 | 0.24 | 0.08 | 9 |
| Nd ii | 0.43 | 0.47 | 0.39 | 0.12 | 0.07 | 0.45 | 0.31 | 0.49 | 0.34 | 0.16 | 1 | ||||
| Yb ii | 0.05 | 0.14 | 0.08 | 0.11 | 0.04 | 0.13 | 0.13 | 0.01 | 0.22 | 0.05 | 0.00 | 0.07 | 0.08 | 1 | |
| 12C/13C | 25 | 20 | 25 | 27 | 24 | 28 | 23 | 20 | 25 | 20 | 26 | 6 | 22 | 6 | CO |
| C | 0.25 | 0.11 | 0.30 | 0.32 | 0.23 | 0.24 | 0.27 | 0.34 | 0.40 | 0.15 | 0.20 | 0.61 | 0.28 | 0.13 | CO, C i |
| N | 0.54 | 0.46 | 0.56 | 0.61 | 0.45 | 0.48 | 0.44 | 0.60 | 0.45 | 0.51 | 0.41 | 0.67 | 0.52 | 0.08 | CN |
| O | 0.02 | 0.07 | 0.03 | 0.09 | 0.01 | 0.07 | 0.12 | 0.07 | 0.14 | 0.04 | 0.04 | 0.11 | 0.01 | 0.08 | OH |
| ∗ This study. | |||||||||||||||
In previous optical studies we have used the Line Depth Ratio (LDR) method for estimations of initial values. The LDR method was first developed by Gray & Johanson 1991 and later studied by several authors such as Biazzo et al. 2007a; Biazzo et al. 2007b, whose formulae we utilized in Paper 1. LDR temperatures are calculated from the ratios central depths of -sensitive absorption lines to those of lines that are relatively insensitive to . Such line pairs are relatively insensitive to log g and [Fe/H] for disk-metallicity red giants. The method is completely free of of photometric uncertainties, interstellar reddening, and extinction. In a recent study, Fukue et al. 2015 identified 18 absorption lines in the band to provide ,LDR calibrations for nine absorption line pairs, for mostly G- and K-type giants and supergiants. This study provides a new opportunity to estimate effective temperature, perhaps the most important atmospheric parameter, without having any information from the optical spectral range.
We applied the Fukue et al. 2015 -band LDR method to our IGRINS data, measuring line depths of their recommended absorption pairs, and calculated of the NGC 6940 RGs (Table 3). In Figure 2, we plot the optical LDR temperatures (Paper 1) along with the infrared LDR temperatures that were obtained using the temperature scales reported by Fukue et al. 2015, and compare them with the spectroscopic temperatures. LDR temperatures from the region are in accord with the optical LDR temperatures, and they agree well with spectroscopic values for all but the coolest star, MMU 105. All other program stars are at least 150 K warmer than MMU 105 according to the Paper 1 spectroscopic analyses, and the and values (Table 1) for this star also suggest a lower temperature. Without more examples like MMU 105, we cannot pursue this point further. Comparison of the average LDR and spectral temperatures yields, ,LDR = 3 10 K in the optical (Paper 1), and ,LDR = 16 14 K in the . It is clear that the -band LDR method provides reliable value independent of other atmospheric parameters, which will become especially useful for RGs in other clusters that are not observable in the optical spectral region due to large interstellar extinction.
6 Abundances from the Infrared Window
We determined the abundances of 20 elements from the high-resolution - and -band spectra of NGC 6940 RG stars. 17 of the elements studied here were also investigated in Paper 1. We followed the analytical methods of Afşar et al. 2018, in particular adopting their line lists of atomic and molecular data without change. We performed synthetic spectrum analyses to measure the abundances. We measured the abundances of H-burning (C, N, O), (Mg, Si, S, Ca), light odd-Z (Na, Al, P, K), Fe-group (Sc, Ti, Cr, Fe, Co, Ni) and -capture (Ce, Nd, Yb) elements, as well as 12C/13C ratios. We begin with an overview of the results, and follow with details of the analysis and comparison with the optical abundances in subsections to follow.
In the bottom part of Table 4 we list the -based relative abundance ratios of our 12 NGC 6940 program stars. Figure 3 displays a summary of the mean optical and abundances. Blue squares and red dots are the calculated mean abundances from 12 RGs in the optical and region, respectively. Error bars represent the standard deviations of each element of its cluster mean abundance. Inspection of this figure shows that there is general agreement of abundances derived from the two spectral domains, with abundance differences rarely exceeding the mutual abundance uncertainties. Defining [A/B] = [A/B]IR [A/B]opt, we find [X/Fe] = 0.00 0.02 ( = 0.09) for 17 species with both optical and abundances.
In Figure 4 we show species mean abundances for each program star as a function of its effective temperature. This figure reinforces the optical/ agreement and the small star-to-star abundance scatters evident in Figure 3. We compare only the neutral species of Cr due to its existence in both regions. Additionally, this figure illustrates that there are no significant abundance drifts with , albeit over the small 47655132 K range occupied by the RG stars of our sample.


6.1 Fe-group elements:
The standard metallicity element Fe is represented only by Fe i on our IGRINS spectra; it is a struggle to detect any Fe ii lines in RG spectra. Additionally, there are not many recent laboratory transition probabilities reported for Fe i. The series of lab studies of this species (Ruffoni et al. 2014, Den Hartog et al. 2014, Belmonte et al. 2017) have no lines in the and bands. Therefore our Fe i -values were all derived from reverse solar analyses by Afşar et al. 2018, and thus our Fe abundances are differential ones. They are listed for each star in Table 3, from which we derive an NGC 6940 cluster abundance of [Fe/H] = 0.02 ( = 0.06). The means for the optical lines (which employed lab transition probabilities for both Fe i and Fe ii are [Fe/H] = 0.02 ( = 0.06) and [Fe/H] = 0.07 ( = 0.06). These three metallicity estimates are all solar within the uncertainties.
The Fe-group comprises elements Sc through Zn, = 2130. We detected useful transitions of five Fe-group species in the (Sc i, Ti i, Ti ii, Cr i, Co i and Ni i). From their mean [X/Fe] values in Table 4 we compute [X/Fe] = 0.01 ( = 0.04, 6 species). A caution needs to be made for Ti ii, which could be determined only from one feature in the , and Sc i abundances which could be measured only from two weak lines in the band. In general, the results compare well with the ones from the optical region, in which for 10 elements we find [X/Fe] = 0.04 ( = 0.11, 11 species). Both optical and Fe-group relative abundances are consistent with their solar values.
6.2 Alpha elements
The -elements, Mg, Si, Ca and S, each have about 10 absorption neutral-species lines in - and -bands (Table 4). Mg, Si and Ca lines are usually stronger compared to those of S. We illustrate this in the top panel of the Figure 5, showing observed/synthetic spectrum comparisons of two of the main S i lines in MMU 152. Almost all -elements have abundances somewhat above solar. The mean of all group elements for the cluster is [/Fe]IR ([Mg/Fe]+[Si/Fe]+[S/Fe]+[Ca/Fe]) = 0.10 ( = 0.06). This agrees reasonably well with the mean [/Fe] from the optical, 0.15 ( = 0.06). We derived the optical Si and Ca abundances in Paper I from s of large sets of lines, finding very small internal scatter. However, Mg abundances were derived only from two strong Mg i lines at 5528.41 and 5711.08 Å by spectrum synthesis analyses. The line-to-line scatter of the Mg abundances from these lines reached up to about 0.2 dex in some cases. In the , line-to-line scatter is only 0.05 dex from 10 Mg i lines, indicating that more robust Mg abundance can be obtained using the IGRINS data.
6.3 Odd-Z light elements
Abundances of four odd-Z light elements Na, Al, P and K were determined from our spectra. Our LTE analysis (in both regions) yields a significant overabundance for Na. Giving equal weight to the Na abundance averages from and optical domains, [Na/Fe] = 0.28, but the star-to-star scatter is large, = 0.13. The optical and abundances are in good agreement: [Na/Fe] = 0.01 ( = 0.07). For star MMU 132 the Na abundance is 0.16 dex smaller than that from the optical. Eliminating that star yields smaller scatter in the optical/IR abundance comparison: [Na/Fe] = 0.03 ( = 0.05). This suggests that the star-to-star variation in Na abundances is real. Note that the scatter is driven in large part by very large abundances for stars MMU 108 and MMU 152 ([Na/Fe] 0.5). As previously discussed in Paper 1 (Section 7.3) in detail, and also recently studied by, e.g. Smiljanic et al. 2018a, relatively large turnoff mass (2 M⊙) of the cluster could be associated with the Na overabundance. In §8, we will discuss further the Na overabundance issue observed in MMU 152.
In contrast to the scatter for Na, the Al abundances in our NGC 6940 giants are consistent with [Al/Fe] 0.07 with little evidence of star-to-star variation ( = 0.07). The optical and abundances slightly differ from each other with [Al/Fe] = 0.11 ( = 0.08). Once again MMU 152 yields high [Al/Fe] values, about 0.1 dex larger than the cluster means in the two spectral regions.
Abundances of other two odd-Z light elements P and K have been analyzed from two neutral-species lines that are present for each element in the band. Moore et al. 1966 identified three high-excitation P i lines ( 8 eV) in the optical spectral region, but they could not be detected in our NGC 6940 spectra, being either blended or extremely weak (reduced widths log() log() 6.0). The K i resonance line at 7699.0 Å has been the dominant source of K abundances in the literature, but in our NGC 6940 giants the 7699 Å line is on the flat/damping part of the curve-of-growth log() 4.6 and thus relatively insensitive to abundance variations. Additionally, the K i resonance lines are subject to severe NLTE effects, as discussed in, e.g., Takeda et al. 2002; Takeda et al. 2009. Afşar et al. 2018 suggests that the NLTE effects might be much less for the high-excitation K i, but detailed calculations have not been published.
The middle panels of Figure 5 displays the synthetic/observational spectrum matches for the P i 15711.5 and 16482.9 Å lines in MMU 152, while the bottom panel shows the K i 15163.1 and 15168.4 Å lines. The cluster means are [P/Fe] = () and [K/Fe] = (). Abundances MMU 108 and especially MMU 152 again are overabundant with respect to the cluster means, being K overabundant by about 0.2 dex in MMU 152, and 0.3 dex in MMU 108.
6.4 Neutron-capture Elements
We detected transitions of Ce ii, Nd ii, and Yb ii in our spectra, to complement the ionized optical region transitions of Y, La, Nd, and Eu in Paper 1, and additional Ce transitions presented in this study. Caution should be used in interpreting the Nd and Yb abundances, since they have been derived from one transition each. All neutron-capture elements are somewhat overabundant, but among the rare-earth elements there is a split between those whose origin in solar-system material is attributed more to slow neutron captures (the -process) and rapid neutron captures (the -process). Using the - and -fractions in Table 10 of Simmerer et al. 2004, the “mostly elements” are La (75% -process), Ce (81%), and Nd (58%), and the “mostly elements” are Eu (97% -process) and Yb (68%). Other / assessments, e.g., Sneden et al. 2008 give similar fractions for these elements. A simple mean of both and optical La, Ce, and Nd abundances is [-process/Fe] 0.23, while that for Eu and Yb is [-process/Fe] 0.10. This is suggestive of a mild -process overabundance in NGC 6940, but the effect is too weak to be pursued with our spectra.
6.5 The CNO Group

The and spectral region provides many useful molecular features such as OH, CN and CO. These transitions can greatly strengthen the reliability of CNO abundances and 12C/13C ratios derived from optical spectroscopy. We applied iterative spectrum synthesis to these features to derive fresh CNO abundances for NGC 6940 RG stars purely from our IGRINS spectra.
Abundances of C and O must be derived together iteratively because these elements are linked through CO formation. However for our NGC 6940 RGs the problem is not severe, because the strengths of species used to determine O abundances ([O i] in the optical, OH in the ) are relatively insensitive to assumed C abundances. In Paper 1 we derived cluster means [C/N] = 0.56 and [C/O] = 0.17, in reasonable agreement with expectations for solar metallicity RG abundance ratios resulting from interior CN-cycle hydrogen fusion and envelope mixing. In absolute abundance terms these ratios are log (C/N) 0.05 and log (C/O) 0.43. For our NGC 6940 program giants the molecular CO association is small, especially so for O, being about 2.5 times more abundant than C. Our molecular equilibrium computations yield N(CO)/N(C) 0.09 and N(CO)/N(O) 0.03 in atmospheric line-forming layers. Thus internally consistent C and O abundances could be derived in 1-2 iterations of the C- and O-containing species.
We began by assuming an average C abundance from Paper 1 and deriving O abundances from 3-15 OH lines. Although there are many OH lines especially in the band, they are usually weak (sometimes undetectable) and often are blended in our stars. We illustrate this in the left panel of Figure 6 by showing observed and synthetic spectra of the 16052 Å line in MMU 101, one of the best detections of OH in our program stars. This line is not obviously contaminated by lines of other species, but it is less than 2% deep. In order to convince ourselves of the reality of this and other chosen OH lines, we experimented by combining the spectra of all 12 RGs into one single “cluster mean” spectrum (adopting an average atmospheric parameter set for the cluster mean: = 4996 K, log g= 3.0, [M/H] = 0.06, = 1.17 km s-1). All of the lines that we eventually used for individual stars were identified in the combined spectrum, and many other also. The 16052 Å line in this spectrum is shown in the right panel of Figure 6; the increased of the combined spectrum can be easily seen by inspection of right and left panels of the figure.
The O abundance from the combined spectrum (using 21 OH lines) of 12 RGs was [O/Fe] = 0.04 ( = 0.08). The mean of the individual O abundances from OH lines in 12 RGs is [O/Fe] = 0.01 ( = 0.08, Table 4). This value is consistent with O abundance that derived from the [O i] 6300 Å line,[O/Fe] = 0.09 ( = 0.06), within the mutual uncertainties of both O species. Both O abundance indicators should be treated with caution. In addition to the weakness and blending issues of OH lines, this species makes up less than 1% of the total O content in atmospheric line-forming regions; uncertainties in OH syntheses are magnified in the O elemental abundances derived from OH. [O i] lines arise from the dominant O-containing species, as discussed above. But these transitions are plagued with multiple contaminants, both stellar and telluric, and are difficult to work with in NGC 6940 (see Figure 8 of Paper 1). We suggest that the OH transitions may yield abundances for this cluster that are more trustworthy then those obtained with the optical forbidden lines.
Adopting the O abundance derived from OH features we then derived C abundances from the many prominent -band CO molecular features, specifically those of the 12CO first overtone = 2 (20) and (31) bands. All CO transitions yielded consistent C abundances with very small internal scatter, about 0.03 dex. The mean NGC 6940 abundance from CO features was [C/Fe] = 0.29 (). In Paper 1 we obtained the optical C abundances from two C2 Swan band heads: the (0-0) band head at 5165 Å, which is heavily blended by atomic absorption lines, and the (0-1) band head at 5635 Å, which is very weak and also blended with other features. Using these two regions we obtained a cluster mean of [C/Fe] = (), consistent with the new CO-based abundance.
In this study, we also investigated the high excitation C i lines for independent C abundance estimations. This species has detectable transitions over the whole optical and spectral range. In the optical we measured C i lines at 5380 and 8335 Å. In the , we were able to locate four useful C i lines at 16022, 16890, 17456 and 21023 Å. We summarize the C abundances from C i, C2 and CO in the optical and IR in Table 5. The various features yield consistent C abundances in all NGC 6940 RGs. For the cluster, [C/Fe] = 0.24 ( = 0.07) from the optical features and [C/Fe] = 0.28 ( = 0.13) from the IR features (Table 4).
| Star | C i | C2 | C i | CO | mean | mean |
|---|---|---|---|---|---|---|
| opt | opt | opt | ||||
| MMU 28 | 0.17 | 0.22 | 0.23 | 0.28 | 0.19 | 0.25 |
| MMU 30 | 0.20 | 0.19 | 0.11 | 0.10 | 0.20 | 0.11 |
| MMU 60 | 0.28 | 0.31 | 0.28 | 0.31 | 0.29 | 0.30 |
| MMU 69 | 0.24 | 0.25 | 0.28 | 0.36 | 0.24 | 0.32 |
| MMU 87 | 0.22 | 0.22 | 0.23 | 0.23 | 0.22 | 0.23 |
| MMU 101 | 0.22 | 0.26 | 0.28 | 0.19 | 0.24 | 0.24 |
| MMU 105 | 0.27 | 0.28 | 0.25 | 0.29 | 0.27 | 0.27 |
| MMU 108 | 0.14 | 0.21 | 0.33 | 0.34 | 0.17 | 0.34 |
| MMU 132 | 0.20 | 0.34 | 0.37 | 0.43 | 0.27 | 0.40 |
| MMU 138 | 0.15 | 0.16 | 0.13 | 0.16 | 0.15 | 0.15 |
| MMU 139 | 0.22 | 0.23 | 0.22 | 0.20 | 0.23 | 0.21 |
| MMU 152 | 0.37 | 0.44 | 0.61 | 0.62 | 0.41 | 0.61 |
With the newly-derived O and C abundances in the IR, we calculated N abundances from 18 selected CN molecular lines located between 15000 and 15500 Å. The cluster mean N abundance for 12 RGs is [N/Fe] = 0.52 ( = 0.08, Table 4), in good accord with optical mean for the cluster, [N/Fe] = 0.46 ( = 0.06).
The first overtone 12CO (v = 2) band heads (20) and (31) are accompanied by the 13CO band heads near 23440 and 23730 Å, respectively. These features allowed us to determine more robust 12C/13C values for the cluster members compared to the ones obtained in Paper 1 only from the 13CN feature near 8003 Å. In Figure 7, we plot both regions for MMU 152, the RG member with the lowest 12C/13C in our sample. Generally the CN and CO isotopic indicators yield consistent mean values leading to cluster mean 12C/13C = 20, with a few stars (notably MMU 69 and MMU 101) indicating much larger isotopic ratios from IR CO than from optical CN features. We list the 12C/13C ratios of all the RGs for both spectral region in Table 6.

| Stars | 13CN | 13CO | 13CO |
|---|---|---|---|
| (8004 Å) | (23440 Å) | (23730 Å) | |
| MMU 28 | 25 | 25 | |
| MMU 30 | 15 | 15 | 25 |
| MMU 60 | 20 | 25 | |
| MMU 69 | 10 | 27 | 27 |
| MMU 87 | 25 | 18 | 30 |
| MMU 101 | 15 | 30 | 25 |
| MMU 105 | 15 | 20 | 25 |
| MMU 108 | 20 | 20 | 20 |
| MMU 132 | 25 | 25 | 25 |
| MMU 138 | 20 | 18 | 22 |
| MMU 139 | 15 | 25 | 27 |
| MMU 152 | 6 | 6 | 6 |
Taking NGC 6940 RG optical and CNO indicators as a whole, we find [C/Fe] = 0.26, [N/Fe] = 0.49, [O/Fe] = 0.05, and 12C/13C = 20. Excluding MMU 152 from the sample the cluster RGs have [C/Fe] = 0.24, [N/Fe] = 0.48, [O/Fe] = 0.05, and 12C/13C 22. The Asplund et al. 2009 initial C and N abundances are log (C) = 8.43, log (N) = 7.83, or log (C/N)init = 0.60. RG observed mean abundance ratio [C/N] = 0.75 becomes log (C/N)RG = 0.15. This value is somewhat lower than the original stellar evolution predictions of Iben 1964; Iben 1967a; Iben 1967b, as discussed by Lambert & Ries 1981. The predictions given in Table 6 of Lambert & Ries 1981 are for assumed initial ratios log (C/N) = 0.86, 0.68, and 0.50. The corresponding RG values are log (C/N)pred = 0.20, 0.13, and 0.05. The 2 M⊙ RGs in NGC6940 with Asplund et al. 2009 initial abundances would be predicted to have log (C/N)pred 0.1. The predicted isotopic ratios from Lambert & Ries 1981 are nearly identical to our RG observed mean value. For initial values 12C/13Cinit = 89, 50, and 25, they predict that 12C/13CRG = 21, 18, and 13. For the reasonable (unprovable) assumption that 12C/13Cinit 90, the predicted RG value of 21 is nearly identical to that of our NGC 6940 program stars.
6.6 Hydrogen Fluoride
Inspection of our -band spectra revealed no obvious stellar absorption at 23358.3 Å, the wavelength of the single unblended HF line in this spectral region. The spectra of two of the stars, MMU 105 and MMU 152, were examined in greater detail for the presence of the HF feature. The details of HF analyses to obtain an abundance of fluorine are described in Pilachowski & Pace 2015.
Synthetic spectra of the HF region were computed using MOOG and the model atmospheres determined for each star. An excitation potential of = 0.227 eV was adopted from HITRAN molecular line database (Rothman et al. 2013). The oscillator strength log = 3.971 was adopted from Lucatello et al. 2011, and the dissociation energy used by MOOG, D0 =5.8698 eV, is consistent with the Jönsson et al. 2014 calculations. We adopted wavelengths, excitation potentials, and gf-values from Goorvitch 1994 for spectrum synthesis of the neighboring CO (2-0) and (3-1) vibration-rotation lines. For the handful of atomic lines in the spectrum, we adopted line parameters from the Vienna Atomic Line Database (Kupka et al. 2000 and references therein) for our spectrum synthesis.
The synthetic spectra, calculated with a fluorine abundance log (F) = 4.40 (Maiorca et al. 2014), are compared to the observed stellar spectra in Figure 8. For comparison, we include the slightly cooler K3.5 V star HD 10853 from Pilachowski & Pace 2015. They found that for solar metallicity stars, HF is not reliably present in stars warmer than 4500 K. Pilachowski & Pace 2015 adopted atmospheric parameters ( = 4600 K, log g = 4.65, [Fe/H] = 0.12) for HD 10853 from Mishenina et al. 2008, and determined a fluorine abundance of log (F) = 4.27 for the star.
For MMU 105 at = 4762 K, we find an upper limit to the abundance of fluorine to be log (F) 4.7 from synthetic spectra. For MMU 152, the upper limit is higher, log (F) 5.1 due to the lower ratio for this spectrum. Both stars are consistent with a solar abundance of fluorine, although we cannot rule out a slight enhancement.
While we cannot rule out a small excess in the abundance of fluorine, an enhancement of F through mass transfer from a carbon-enhanced asymptotic giant branch (AGB) star is unlikely. AGB stars are thought to be significant producers of fluorine (Jorissen et al. 1992, Abia et al. 2009). Redetermination of the fluorine abundances in peculiar red giants (Abia et al. 2015) suggests that large fluorine excesses ([F/H] +0.3 or log (F) 4.6) are limited primarily to stars with C/O ratios near unity (C/O 1.08). Stars with C/O greater than this value have near-solar abundances of fluorine (log (F) 4.3).
7 Stellar Evolution Modelling of NGC 6940
Interpretation of the light element abundances in our NGC 6940 giants requires knowledge of their evolutionary state(s). Therefore we modelled the observed photometric properties of the stars in NGC 6940 with both the MESA (Paxton et al. 2011; Paxton et al. 2013) and Victoria (VandenBerg et al. 2014) stellar evolutionary codes. The former code was used to compute the evolutionary tracks of stars having the main-sequence turnoff (MSTO) mass from the zero-age main sequence (ZAMS) to the core helium-burning phase on the assumption of the same input physics and control parameters as described by Denissenkov et al. 2017. We assumed [Fe/H] = 0.0 (Paper I) in these computations, and an initial solar abundance mix recommended by Asplund et al. 2009. An important component of these calculations was the treatment of interior convection. Stars with larger masses than the Sun are predicted to have convective cores during their MS phase. It has long been known that some degree of core overshooting must also occur in order to satisfy such empirical constraints as the properties of eclipsing binaries and the morphology of the MS blue hook in the color-magnitude diagrams (CMDs) of young ( Gyr) open clusters, which occurs when the central H abundance is exhausted. Since the pioneering work that established the importance of convective core overshooting in intermediate-mass and massive stars (Bressan et al. 1981; Bertelli et al. 1986; Maeder & Meynet 1987, e.g.), there have been many studies devoted to the calibration of the extent of overshooting as a function of mass and metallicity (VandenBerg et al. 2006; Bressan et al. 2012; Stancliffe et al. 2015; Deheuvels et al. 2016; Claret & Torres 2018, see, e.g.). All stellar models must implement some treatment of convective core overshooting in order to match photometric observations. In the next subsection we describe our treatment of convective overshoot as it applies to stars similar in mass to NGC 6940.
7.1 Treatment of Interior Convection
As in the case of convective helium cores, convective overshooting outside the Schwarzschild boundary of a convective H core during the MS evolution has been modelled with the exponentially decaying diffusion coefficient
| (1) |
as proposed by Herwig et al. 1997 based on the hydrodynamical simulations of Freytag et al. 1996. Here, is the convective diffusion coefficient both inside the convective core and close to its boundary calculated with the mixing length theory, is the pressure scale height, and is a free parameter whose value must be constrained empirically. Herwig 2000 found that the value enabled him to reproduce the earlier models of Schaller et al. 1992 that had used a step-like prescription for convective overshooting; i.e., the convective boundary was arbitrarily relocated to a distance outside the Schwarzschild boundary. Their models were able to successfully match the upper envelope of the MS (the so-called “terminal-age main sequence" or TAMS) defined by 65 star clusters and associations of different ages when the value of the convective overshooting parameter was used.
Victoria models (VandenBerg et al. 2006, see) are similar except that the enlargement of a central convective core is derived from a parameterized form of the integral equations derived by Roxburgh 1989 for the maximum possible size of such a core. By introducing a parameter into the integral equations, where , and then determining best estimates of its value from inter-comparisons of synthetic and observed CMDs for clusters spanning a wide range in age, as well as observations of selected binary stars, VandenBerg et al. were able to deduce how varies with mass. According to their Fig. 1, appears to ramp up from a value near 0.0 at the lowest mass with sustained core convection to a value of at a higher mass by about 0.5 M⊙, and to remain essentially constant with further increases in mass. Lacking any evidence to the contrary, VandenBerg et al. 2006 assumed that this variation is nearly independent of metallicity, aside from a zero-point adjustment. That is, the functional relationship between and mass is taken to be the same as the one that they derived for solar abundances, except that, for other abundance choices, it is shifted in mass until coincides with the mass at which the transition is made between stars that have radiative cores at the end of the MS phase to those that retain convective cores until central H exhaustion.
One of the totally eclipsing binary stars considered by VandenBerg et al. 2006 was TZ For, which has close to the solar metallicity (like NGC 6940) and whose components have masses very close to the MSTO mass of NGC 6940. Indeed, this binary provides a unique benchmark test of the efficiency of convective overshooting in the turnoff stars of NGC 6940, especially as Gallenne et al. 2016 have recently determined to very high precision () the effective temperatures, luminosities, masses, and radii of its components. Follow-up studies by Valle et al. 2017 and Higl et al. 2018 examined the implications of the improved stellar parameters of this binary for the calibration of core overshooting in their stellar models.1010 10 Both of these studies assumed that the secondary of TZ For has K, which corresponds to the adopted temperature of the model atmosphere that was used in the spectroscopic analysis carried out by Gallenne et al. 2016. However, the latter gave K as their best estimate of its temperature from an analysis of the interferometric -band flux ratio. The higher temperature, by 300 K, used by Valle et al. 2017 and by Higl et al. 2018 has the consequence that their values of the extent of core overshooting would have been underestimated somewhat.
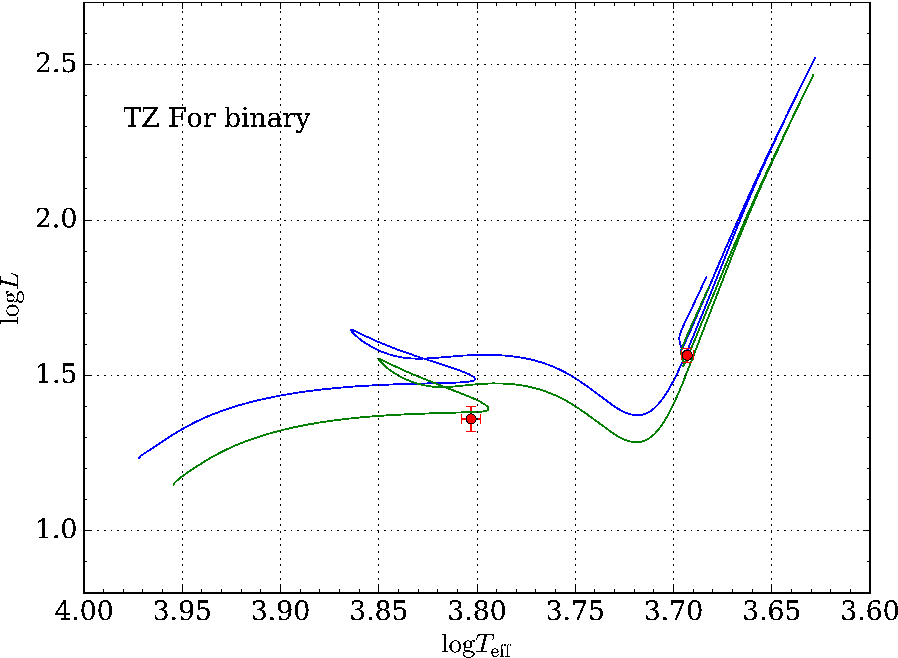
Our simulations with the MESA code of the evolution of the TZ For components with the parameters adopted for them by Gallenne et al. 2016 are able to match their positions on the H-R diagram with a relative age difference of less than 1% only if we assume that and the primary component is in the core He-burning stage of evolution (see Figure 9). Very similar conclusions were reached by Higl et al. 2018, however see Constantino & Baraffe 2018. We have therefore used this value of the convective overshooting parameter in generating the MESA models that have been applied to NGC 6940. It turns out that an equally good fit to the properties of the secondary component, which provides the main constraint on core overshooting in 2 M⊙ stars having close to the solar metallicity, can be obtained using models that are generated by the Victoria code assuming the abundances of the metals given by Asplund et al. 2009 and the overshooting prescription described above.
7.2 Evolutionary Tracks and Isochrones for NGC 6940
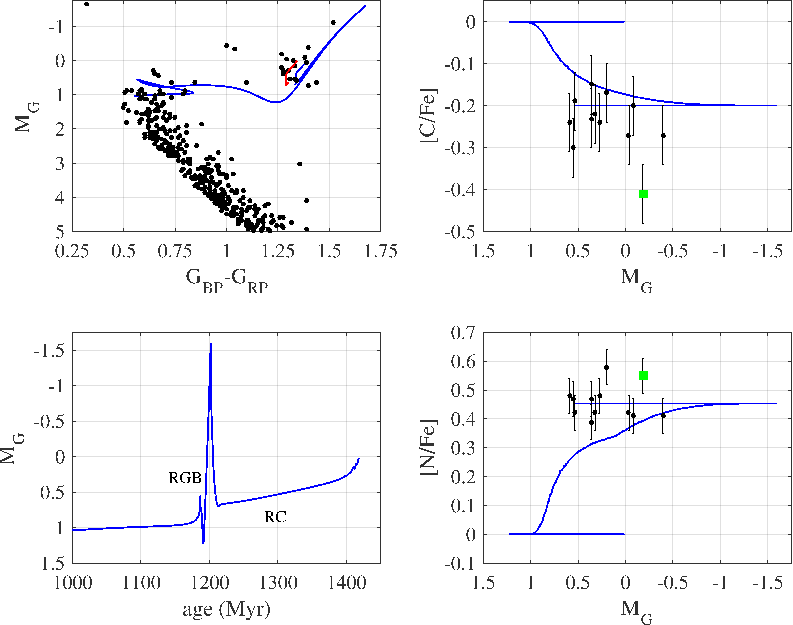
The Victoria code has state-of-the-art model interpolation codes (VandenBerg et al. 2014), so we used it to produce the 1.15 Gyr, 2.0 M⊙ turnoff mass isochrone that provides the best fit to the CMD of NGC 6940 (the black curve in Figure 1). The grid of models employed for this interpolation assume solar abundances, a helium abundance of , and a range in mass from 1.0 to 2.0 M⊙. The blue curve in Figure 1 is the MESA evolutionary track computed for M = 2.0 M⊙ and the same initial chemical composition as that used to generate the isochrone. The isochrone and the evolutionary tracks have been transposed to the observed plane using the reddening-corrected bolometric corrections given by Casagrande & VandenBerg 2018 for the GBP, G, and GRP bandpasses. On the assumption of a true distance modulus, (m-M)0 = 10.11, the isochrone provides the best overall fit to the cluster photometry if . With this choice, the isochrone appears to be slightly too red relative to the upper MS stars, while deviating somewhat to the blue of the MS stars at G 16 (not shown).
It is possible that an improved fit could be obtained by adopting slightly different cluster parameters. As noted in §2, the cluster parallax has a uncertainty of 0.052 , which corresponds to a distance modulus uncertainty of about mag. Furthermore, Lindegren et al. 2018 have suggested that current Gaia parallaxes suffer from a zero-point error of 0.03 , in the sense of being too small. Insofar as the foreground reddening is concerned, the 3D dust maps provided by Green et al. 2018; Green et al. 2015 yield , with an uncertainty of 0.020.03, depending on the adopted distance of NGC 6940. However, even if the actual cluster properties (including the age and the turnoff mass) differ somewhat from those that we have adopted or derived, the predicted chemical properties of the RC stars, which are of particular importance for the present investigation, would not change significantly.
The close similarity between the blue track and the isochrone at GBPGRP 1.2, when the predicted mass along the isochrone is close to 2.0 M⊙ and the variation in mass has become very small, illustrates the good agreement between our MESA and Victoria models; see Denissenkov et al. 2017 for a more complete discussion of the indistinguishability of MESA and Victoria models when their input physical ingredients are similar.
The colors of the red-giant branches (RGBs) of both the blue track and the isochrone are 0.05 magnitude redder than they should be in order to fit the CMD positions of the NGC 6940 red giants. Similar color offsets have been found in the fits of isochrones to the CMDs of other open clusters (Choi et al. 2016; Hidalgo et al. 2018, e.g.) and globular clusters (VandenBerg et al. 2013; Fu et al. 2018, e.g.). They are likely caused by deficiencies in the treatment of convection, the adopted atmospheric boundary condition, and/or the assumed color– relations. Recent work aimed at calibrating the mixing-length theory using 3D hydrodynamic atmosphere models (Magic et al. 2015, and references therein) indicates that the mixing-length parameter should decrease towards higher , lower surface gravity, and higher metallicity, but the consequences for stellar models appear to be small (Mosumgaard et al. 2018). As an illustration, we computed a track with the same parameters as for the blue one of Figure 1, but with the mixing length increased by 10%; see the red curve in this figure. It provides quite a good fit to the observed giants, though one could potentially accomplish the same thing by altering the boundary condition for the pressure at by assuming a different – relation or by adopting the photospheric pressures from a grid of model atmospheres; see, e.g., VandenBerg et al. 2008; VandenBerg et al. 2014, their Fig. 15; Salaris & Cassisi 2015. What is much more important is that both the red and blue tracks have the same minimum luminosity during core He-burning, and that this luminosity agrees very well with the observed magnitudes of the red giants in NGC 6940. This is the reason why the luminosity of the red clump is a good distance indicator (Stanek et al. 1997; Nataf et al. 2013, see, e.g.).
Figure 10 shows a superposition of the blue track onto the cluster CMD (top-left panel), the predicted evolutionary timescales for the RGB and red-clump (horizontal branch) phases (bottom-left panel), and the variations of the surface abundances of C and N (right-hand panels). Note, in particular, that the lifetime on the RGB, where MG decreases from 1.0 to 1.5, is much shorter than the evolutionary timescale of the red clump. Therefore, most, if not all, of the red-giant stars in NGC 6940 are predicted to be core He-burning red clump stars. Furthermore, because the H-burning shell in our RGB models (along both the blue and red tracks) never reaches and erases the mean molecular weight barrier left behind by the bottom of the convective envelope at the end of the first dredge-up (FDU), the first-ascent red giants are not expected to experience extra mixing along the RGB. Nor will they experience a helium core flash; they will instead ignite core helium quiescently. These are among the expected consequences of significant core overshooting during the MS stage. Thus, the surface chemical composition of the red-clump stars in NGC 6940 should reflect only the changes that occurred during the FDU. Our computations support this conclusion for all of the red-clump stars except MMU 152, the star with the lowest [C/Fe] ratio in the Figure 10 top-right panel, illustrated with a green square.
8 MMU 152 AND ITS ANOMALOUS LIGHT ELEMENT ABUNDANCES
MMU 152 has anomalous light element abundances compared the 11 program stars: it has a much lower C, much higher N and Na, and somewhat higher Al, P and K. Additionally MMU 152 has a very low carbon isotopic ratio, 12C/13C = 6 1. This is easily seen in both optical CN and CO features (Figure 7). Normal high metallicity disk field and open cluster red giants do not exhibit such unusual light element abundances. These MMU 152 abundances resemble more what is found in globular cluster evolved stars.
Large star-to-star and cluster-to-cluster correlated and anti-correlated variations are found among the CNONaMgAl elements (e.g., Gratton et al. 2012; Carretta et al. 2018; Bastian & Lardo 2018 and references therein). Briefly, abundances of C and N are anti-correlated as qualitatively expected from normal CN cycle hydrogen fusion. But the magnitude of C deficiencies and N enhancements are often much more extreme than seen in disk RG stars. More importantly there are well-documented O-N, O-Na, often O-Al, and sometimes Mg-Al anti-correlations seen in globular cluster stars.
The interior syntheses leading to these correlated light element abundances is most easily understood as various high temperature (T 4107 K) proton-capture sequences, mainly the O-N, Ne-Na, and Mg-Al cycles. The observed Mg-Al anti-correlations in some globular clusters such as M13 (Kraft et al. 1997; Carretta et al. 2009a; Carretta et al. 2009b) require H-fusion temperatures T 7107 K. It is believed that most low-mass globular cluster the stars with anomalous light element abundances must have acquired them at or near birth from the ejecta of intermediate-mass stars within the clusters. Those stars would have had the requisite high-temperature interior layers capable of generating the requisite O-N, Ne-Na, and Mg-Al cycles.
The light element abundance distribution of NGC 6940 MMU 152 resembles those of some RGs in metal-rich globular clusters. Averaging the optical and abundances in Table 4, MMU 152 has [C/Fe] = 0.51, [N/Fe] = 0.61, [O/Fe] = 0.10, [Na/Fe] = 0.53, [Mg/Fe] = 0.10, [Al/Fe] = 0.13, and 12C/13C = 6. These abundances are like those found in the disk globular cluster 47 Tuc (e.g., Brown & Wallerstein 1989, Shetrone 2003, Carretta et al. 2009a; Carretta et al. 2009b, Johnson et al. 2015, Thygesen et al. 2014). The maximum relative O abundances of 47 Tuc giants, [O/Fe] 0.5, are larger than those of any NGC 6940 program star, but globular clusters have high initial O abundances compared to OCs.
Recently, Pancino 2018 has reported discovery of rapidly-rotating dwarf stars in several OCs that have relatively low O and high Na abundances, sometimes accompanied by low Mg abundances. Since OC’s, including NGC 6940, show no indications of multiple stellar generations, Pancino 2018 suggests that the causes of these main sequence anomalies are internal, most likely from a combination of several mechanisms such as diffusion, mixing, rotation, and mass loss. MMU 152 might be an elderly red-giant version of such a rapidly rotating dwarf star, but we have no observational way to confirm this idea.
If the core H-fusion regions of MMU 152 were hot enough to ignite the O-N and Ne-Na cycles, then either there was more vigorous envelope mixing or larger mass loss than occurred in other RGs of this cluster. If the slightly anomalous radial velocity of MMU 152 is due to the presence of an unseen binary companion, then that presumably higher-mass star could have given the unique CNO abundances and 12C/13C to MMU 152 through mass transfer. The () value for MMU 152 is not unusual compared to other RGs (Table 2), thus not hinting at any extended dust envelope for this star.
Alternatively, MMU 152 may be a counterpart of the Li-rich red-clump stars (Smiljanic et al. 2018b) that also show evidence of enhanced extra mixing. The Li enrichment in this case could be a transient event (Denissenkov & Herwig 2004) that the star might have experienced in the past. At its present age the original Li has been destroyed, so that only the changes in the surface abundances of C and N are left as signatures of this enhanced mixing. There are various speculations regarding the cause of the enhanced extra mixing (Bharat Kumar et al. 2018, e.g.). In the case of MMU 152 we can rule out mixing caused by the core He flash because, according to our simulations, He ignited quiescently in its core. Rotational mixing during the long-lived red-clump phase could be responsible, but this hypothesis has yet to be supported by stellar evolution simulations.
Our C, N, and 12C/13C abundance predications are similar to those of Charbonnel & Lagarde 2010 for a solar-metallicity 2 M⊙ star. They used a smaller amount of convective overshooting, corresponding to . When we reduce to a value of 0.014 (Constantino & Baraffe 2018), the H-burning shell in our RGB models does erase the mean molecular weight barrier, and core He is ignited in the form of a flash. However, we do not expect any significant contribution of RGB extra mixing to the change of the surface chemical composition because of its short timescale and expected shallow depth. This is confirmed by results in Table 2 of Charbonnel & Lagarde 2010. Unlike us, they have also taken into account rotational mixing, showing that it can slightly reduce the carbon isotopic ratio and significantly lower the surface Li abundance. Therefore, the observed 12C/13C isotopic ratio of 10–15 in some of the red-clump stars in NGC 6940 could be a result of rotational mixing on the MS. The difficulty with this possibility is that the Li abundance should be very low as well, which is not the case, at least for the stars MMU 69 and 139.
Finally, considering the fluorine abundances presented in §6.6, any excess of fluorine in the atmosphere of MMU 152 would most likely be accompanied by an excess of carbon. The observed deficiency of C in MMU 152’s atmosphere suggests that any mass transfer onto the star from an AGB companion must have occurred before any carbon dredge-up from He burning, and prior to any fluorine production. Together with the low carbon isotope ratio (12C/13C 6), the low carbon abundance and unenhanced fluorine abundance suggests that any mass transfer onto MMU 152 would likely come from an early AGB star. Although our RV measurements do not show any evidence of binarity for MMU 152, the possibility of being a double star with large separation based on its position in the colour-magnitude diagram has been discussed by Mermilliod & Mayor 1989.
9 Conclusions
We have observed 12 red giant members of NGC 6940 with the high-resolution - and -band spectrograph IGRINS. Temperature-sensitive line-depth ratios derived from our spectra are in good accord with those in the optical, and yield values consistent with those derived from standard line analyses done in Paper 1.
Adopting the atmospheric parameters derived from Paper 1, we have derived abundances of 19 elements from 20 species measured on the IGRINS spectra. For elements in common with those studied in Paper 1 we find good relative abundance agreement. Abundances of elements P, K, Ce, and Yb are reported for the first time in NGC 6940. For some species we believe that the abundances are more reliable than those determined from optical transitions. The availability of multiple species in the optical and strengthens the abundances of both C (C i, C2, and CO) and O ([O i], OH).
Having the advantage of DR2, we used up-to-date kinematic parameters and determined the most probable members of the NGC 6940. We then applied Victoria isochrones and MESA models to the updated CMD of the cluster and investigated the evolutionary status of our targets, paying special attention to those light elements whose abundances can be altered by interior fusion cycles and envelope mixing episodes. The isochrones suggest our RGs as core He-burning red clump stars with mostly undergone canonical FDU mixing and the CNO abundances of our targets are consistent with these standard stellar evolutionary predictions.
The only exception in our sample comes with the RG member MMU 152, which has the lowest [C/Fe] and 12C/13C values among our sample. The low 12C/13C ratio of MMU 152 suggests extra mixing to be involved during its evolution, which could be the result of rotational mixing that took place on the MS phase. The effect of rotational mixing also could not be ruled for the members with 12C/13C1015. Besides the extreme depletion of C, MMU 152 exhibits larger enhancements of N and Na, and slight enhancement of Al. This star’s surface light element abundances show signs of high-temperature H burning. Whether these abundances have been encouraged by severe envelope mass loss or by more efficient mixing is not clear.
We will continue searching for other cluster RGs with peculiar CNO abundances in future IGRINS studies of M67, NGC 752, and several dust-obscured open clusters for which optical high-resolution spectroscopy is impractical.
Acknowledgments
We thank the anonymous referee for her/his comments and suggestions that improved the quality of the paper. We thank Karin Lind and Henrique Reggiani for helpful discussions on this work. Our work has been supported by The Scientific and Technological Research Council of Turkey (TÜBİTAK, project No. 116F407), by the US National Science Foundation (NSF, grant AST 16-16040), and by the University of Texas Rex G. Baker, Jr. Centennial Research Endowment. This work used the Immersion Grating Infrared Spectrometer (IGRINS) that was developed under a collaboration between the University of Texas at Austin and the Korea Astronomy and Space Science Institute (KASI) with the financial support of the US National Science Foundation under grant AST-1229522, of the University of Texas at Austin, and of the Korean GMT Project of KASI. This work has made use of data from the European Space Agency (ESA) mission (), processed by the Gaia Data Processing and Analysis Consortium (DPAC, ). Funding for the DPAC has been provided by national institutions, in particular the institutions participating in the Multilateral Agreement. This research has made use of NASA’s Astrophysics Data System Bibliographic Services; the SIMBAD database and the VizieR service, both operated at CDS, Strasbourg, France. This research has made use of the WEBDA database, operated at the Department of Theoretical Physics and Astrophysics of the Masaryk University, and the VALD database, operated at Uppsala University, the Institute of Astronomy RAS in Moscow, and the University of Vienna.
This paper includes data taken at The McDonald Observatory of The University of Texas at Austin.
References
- Abia et al. (2009) Abia C., Recio-Blanco A., de Laverny P., Cristallo S., Domínguez I., Straniero O., 2009, ApJ, 694, 971
- Abia et al. (2015) Abia C., Cunha K., Cristallo S., de Laverny P., 2015, A&A, 581, A88
- Afşar et al. (2016) Afşar M., et al., 2016, ApJ, 819, 103
- Afşar et al. (2018) Afşar M., et al., 2018, ApJ, 865, 44
- Arenou et al. (2018) Arenou F., et al., 2018, A&A, 616, A17
- Asplund et al. (2009) Asplund M., Grevesse N., Sauval A. J., Scott P., 2009, ARA&A, 47, 481
- Bastian & Lardo (2018) Bastian N., Lardo C., 2018, ARA&A, 56, 83
- Belmonte et al. (2017) Belmonte M. T., Pickering J. C., Ruffoni M. P., Den Hartog E. A., Lawler J. E., Guzman A., Heiter U., 2017, ApJ, 848, 125
- Bertelli Motta et al. (2018) Bertelli Motta C., et al., 2018, MNRAS, 478, 425
- Bertelli et al. (1986) Bertelli G., Bressan A., Chiosi C., Angerer K., 1986, A&ASS, 66, 191
- Bharat Kumar et al. (2018) Bharat Kumar Y., Singh R., Eswar Reddy B., Zhao G., 2018, ApJL, 858, L22
- Biazzo et al. (2007a) Biazzo K., Frasca A., Catalano S., Marilli E., 2007a, Astronomische Nachrichten, 328, 938
- Biazzo et al. (2007b) Biazzo K., et al., 2007b, A&A, 475, 981
- Böcek Topcu et al. (2016) Böcek Topcu G., Afşar M., Sneden C., 2016, MNRAS, 463, 580
- Bressan et al. (1981) Bressan A. G., Chiosi C., Bertelli G., 1981, A&A, 102, 25
- Bressan et al. (2012) Bressan A., Marigo P., Girardi L., Salasnich B., Dal Cero C., Rubele S., Nanni A., 2012, MNRAS, 427, 127
- Brown & Wallerstein (1989) Brown J. A., Wallerstein G., 1989, AJ, 98, 1643
- Cantat-Gaudin et al. (2018) Cantat-Gaudin T., et al., 2018, A&A, 618, A93
- Carretta et al. (2009a) Carretta E., et al., 2009a, A&A, 505, 117
- Carretta et al. (2009b) Carretta E., Bragaglia A., Gratton R., Lucatello S., 2009b, A&A, 505, 139
- Carretta et al. (2018) Carretta E., Bragaglia A., Lucatello S., Gratton R. G., D’Orazi V., Sollima A., 2018, A&A, 615, A17
- Casagrande & VandenBerg (2018) Casagrande L., VandenBerg D. A., 2018, MNRAS, 479, L102
- Charbonnel & Lagarde (2010) Charbonnel C., Lagarde N., 2010, A&A, 522, A10
- Choi et al. (2016) Choi J., Dotter A., Conroy C., Cantiello M., Paxton B., Johnson B. D., 2016, ApJ, 823, 102
- Claret & Torres (2018) Claret A., Torres G., 2018, ApJ, 859, 100
- Constantino & Baraffe (2018) Constantino T., Baraffe I., 2018, A&A, 618, A177
- Cunha et al. (2015) Cunha K., et al., 2015, ApJL, 798, L41
- Cutri et al. (2003) Cutri R. M., et al., 2003, VizieR Online Data Catalog, 2246, 0
- Deheuvels et al. (2016) Deheuvels S., Brandão I., Silva Aguirre V., Ballot J., Michel E., Cunha M. S., Lebreton Y., Appourchaux T., 2016, A&A, 589, A93
- Den Hartog et al. (2014) Den Hartog E. A., Ruffoni M. P., Lawler J. E., Pickering J. C., Lind K., Brewer N. R., 2014, ApJS, 215, 23
- Denissenkov & Herwig (2004) Denissenkov P. A., Herwig F., 2004, ApJ, 612, 1081
- Denissenkov et al. (2017) Denissenkov P. A., VandenBerg D. A., Kopacki G., Ferguson J. W., 2017, ApJ, 849, 159
- Freytag et al. (1996) Freytag B., Ludwig H.-G., Steffen M., 1996, A&A, 313, 497
- Fu et al. (2018) Fu X., Bressan A., Marigo P., Girardi L., Montalbán J., Chen Y., Nanni A., 2018, MNRAS, 476, 496
- Fukue et al. (2015) Fukue K., et al., 2015, ApJ, 812, 64
- Gaia Collaboration et al. (2016) Gaia Collaboration et al., 2016, A&A, 595, A1
- Gaia Collaboration et al. (2018) Gaia Collaboration Brown A. G. A., Vallenari A., Prusti T., de Bruijne J. H. J., Babusiaux C., Bailer-Jones C. A. L., 2018, preprint, (arXiv:1804.09365)
- Gallenne et al. (2016) Gallenne A., et al., 2016, A&A, 586, A35
- Gao et al. (2018) Gao X., et al., 2018, MNRAS, 481, 2666
- Goorvitch (1994) Goorvitch D., 1994, ApJS, 95, 535
- Gratton et al. (2012) Gratton R. G., et al., 2012, A&A, 539, A19
- Gray & Johanson (1991) Gray D. F., Johanson H. L., 1991, PASP, 103, 439
- Green et al. (2015) Green G. M., et al., 2015, ApJ, 810, 25
- Green et al. (2018) Green G. M., et al., 2018, MNRAS, 478, 651
- Herwig (2000) Herwig F., 2000, A&A, 360, 952
- Herwig et al. (1997) Herwig F., Bloecker T., Schoenberner D., El Eid M., 1997, A&A, 324, L81
- Hidalgo et al. (2018) Hidalgo S. L., et al., 2018, ApJ, 856, 125
- Higl et al. (2018) Higl J., Siess L., Weiss A., Ritter H., 2018, A&A, 617, A36
- Hoag et al. (1961) Hoag A. A., Johnson H. L., Iriarte B., Mitchell R. I., Hallam K. L., Sharpless S., 1961, Publications of the U.S. Naval Observatory Second Series, 17, 344
- Iben (1964) Iben Jr. I., 1964, ApJ, 140, 1631
- Iben (1967a) Iben Jr. I., 1967a, ApJ, 147, 624
- Iben (1967b) Iben Jr. I., 1967b, ApJ, 147, 650
- Johnson et al. (2015) Johnson C. I., et al., 2015, AJ, 149, 71
- Jönsson et al. (2014) Jönsson H., et al., 2014, A&A, 564, A122
- Jorissen et al. (1992) Jorissen A., Smith V. V., Lambert D. L., 1992, A&A, 261, 164
- Kaeufl et al. (2004) Kaeufl H.-U., et al., 2004, in Moorwood A. F. M., Iye M., eds, Society of Photo-Optical Instrumentation Engineers (SPIE) Conference Series Vol. 5492, Ground-based Instrumentation for Astronomy. pp 1218–1227, doi:10.1117/12.551480
- Kharchenko et al. (2005) Kharchenko N. V., Piskunov A. E., Röser S., Schilbach E., Scholz R.-D., 2005, A&A, 438, 1163
- Kraft et al. (1997) Kraft R. P., Sneden C., Smith G. H., Shetrone M. D., Langer G. E., Pilachowski C. A., 1997, AJ, 113, 279
- Kupka et al. (2000) Kupka F. G., Ryabchikova T. A., Piskunov N. E., Stempels H. C., Weiss W. W., 2000, Baltic Astronomy, 9, 590
- Lamb et al. (2015) Lamb M. P., Venn K. A., Shetrone M. D., Sakari C. M., Pritzl B. J., 2015, MNRAS, 448, 42
- Lamb et al. (2017) Lamb M., et al., 2017, MNRAS, 465, 3536
- Lambert & Ries (1981) Lambert D. L., Ries L. M., 1981, ApJ, 248, 228
- Larsson-Leander (1960) Larsson-Leander G., 1960, Stockholms Observatoriums Annaler, 20, 9
- Lawler & Dakin (1989) Lawler J. E., Dakin J. T., 1989, Journal of the Optical Society of America B Optical Physics, 6, 1457
- Lee (2015) Lee J.-J., 2015, plp: Version 2.0, doi:10.5281/zenodo.18579, https://doi.org/10.5281/zenodo.18579
- Lindegren et al. (2018) Lindegren L., et al., 2018, A&A, 616, A2
- Linden et al. (2017) Linden S. T., et al., 2017, ApJ, 842, 49
- Lucatello et al. (2011) Lucatello S., Masseron T., Johnson J. A., Pignatari M., Herwig F., 2011, ApJ, 729, 40
- Mace et al. (2016) Mace G., et al., 2016, in Ground-based and Airborne Instrumentation for Astronomy VI. p. 99080C, doi:10.1117/12.2232780
- Maeder & Meynet (1987) Maeder A., Meynet G., 1987, A&A, 182, 243
- Magic et al. (2015) Magic Z., Weiss A., Asplund M., 2015, A&A, 573, A89
- Maiorca et al. (2014) Maiorca E., Uitenbroek H., Uttenthaler S., Randich S., Busso M., Magrini L., 2014, ApJ, 788, 149
- Majewski et al. (2017) Majewski S. R., et al., 2017, AJ, 154, 94
- McLean et al. (1998) McLean I. S., et al., 1998, in Fowler A. M., ed., Proc. SPIE Vol. 3354, Infrared Astronomical Instrumentation. pp 566–578, doi:10.1117/12.317283
- Mermilliod & Mayor (1989) Mermilliod J.-C., Mayor M., 1989, A&A, 219, 125
- Mishenina et al. (2008) Mishenina T. V., Soubiran C., Bienaymé O., Korotin S. A., Belik S. I., Usenko I. A., Kovtyukh V. V., 2008, A&A, 489, 923
- Moore et al. (1966) Moore C. E., Minnaert M. G. J., Houtgast J., 1966, The solar spectrum 2935 A to 8770 A. National Bureau of Standards Monograph, Washington: US Government Printing Office (USGPO)
- Mosumgaard et al. (2018) Mosumgaard J. R., Ball W. H., Silva Aguirre V., Weiss A., Christensen-Dalsgaard J., 2018, MNRAS, 478, 5650
- Nataf et al. (2013) Nataf D. M., et al., 2013, ApJ, 769, 88
- Oliva et al. (2012) Oliva E., et al., 2012, in Ground-based and Airborne Instrumentation for Astronomy IV. p. 84463T, doi:10.1117/12.925274
- Origlia & Rich (2004) Origlia L., Rich R. M., 2004, AJ, 127, 3422
- Origlia et al. (2002) Origlia L., Rich R. M., Castro S., 2002, AJ, 123, 1559
- Origlia et al. (2005) Origlia L., Valenti E., Rich R. M., 2005, MNRAS, 356, 1276
- Origlia et al. (2006) Origlia L., Valenti E., Rich R. M., Ferraro F. R., 2006, ApJ, 646, 499
- Origlia et al. (2008) Origlia L., Valenti E., Rich R. M., 2008, MNRAS, 388, 1419
- Origlia et al. (2013) Origlia L., et al., 2013, A&A, 560, A46
- Origlia et al. (2016) Origlia L., et al., 2016, A&A, 585, A14
- Pancino (2018) Pancino E., 2018, A&A, 614, A80
- Park et al. (2014) Park C., et al., 2014, in Society of Photo-Optical Instrumentation Engineers (SPIE) Conference Series. p. 1, doi:10.1117/12.2056431
- Paxton et al. (2011) Paxton B., Bildsten L., Dotter A., Herwig F., Lesaffre P., Timmes F., 2011, ApJS, 192, 3
- Paxton et al. (2013) Paxton B., et al., 2013, ApJS, 208, 4
- Pilachowski & Pace (2015) Pilachowski C. A., Pace C., 2015, AJ, 150, 66
- Randich et al. (2006) Randich S., Sestito P., Primas F., Pallavicini R., Pasquini L., 2006, A&A, 450, 557
- Rothman et al. (2013) Rothman L. S., et al., 2013, JQSRTJ. Quant. Spectrosc. Radiat. Transfer, 130, 4
- Roxburgh (1989) Roxburgh I. W., 1989, A&A, 211, 361
- Ruffoni et al. (2014) Ruffoni M. P., Den Hartog E. A., Lawler J. E., Brewer N. R., Lind K., Nave G., Pickering J. C., 2014, MNRAS, 441, 3127
- Salaris & Cassisi (2015) Salaris M., Cassisi S., 2015, A&A, 577, A60
- Schaller et al. (1992) Schaller G., Schaerer D., Meynet G., Maeder A., 1992, A&ASS, 96, 269
- Shetrone (2003) Shetrone M. D., 2003, ApJL, 585, L45
- Simmerer et al. (2004) Simmerer J., Sneden C., Cowan J. J., Collier J., Woolf V. M., Lawler J. E., 2004, ApJ, 617, 1091
- Smiljanic et al. (2018a) Smiljanic R., Donati P., Bragaglia A., Lemasle B., Romano D., 2018a, A&A, 616, A112
- Smiljanic et al. (2018b) Smiljanic R., et al., 2018b, A&A, 617, A4
- Sneden (1973) Sneden C., 1973, ApJ, 184, 839
- Sneden et al. (2008) Sneden C., Cowan J. J., Gallino R., 2008, ARA&A, 46, 241
- Souto et al. (2016) Souto D., et al., 2016, ApJ, 830, 35
- Souto et al. (2018) Souto D., et al., 2018, ApJ, 857, 14
- Stancliffe et al. (2015) Stancliffe R. J., Fossati L., Passy J.-C., Schneider F. R. N., 2015, A&A, 575, A117
- Stanek et al. (1997) Stanek K. Z., Udalski A., SzymaŃski M., KaŁuŻny J., Kubiak Z. M., Mateo M., KrzemiŃski W., 1997, ApJ, 477, 163
- Stetson (2000) Stetson P. B., 2000, PASP, 112, 925
- Takeda et al. (2002) Takeda Y., Zhao G., Chen Y.-Q., Qiu H.-M., Takada-Hidai M., 2002, PASJ, 54, 275
- Takeda et al. (2009) Takeda Y., Kaneko H., Matsumoto N., Oshino S., Ito H., Shibuya T., 2009, PASJ, 61, 563
- Thygesen et al. (2014) Thygesen A. O., et al., 2014, A&A, 572, A108
- Tull (1998) Tull R. G., 1998, in D’Odorico S., ed., Proc. SPIE Vol. 3355, Optical Astronomical Instrumentation. pp 387–398, doi:10.1117/12.316774
- Valenti et al. (2011) Valenti E., Origlia L., Rich R. M., 2011, MNRAS, 414, 2690
- Valenti et al. (2015) Valenti E., Origlia L., Mucciarelli A., Rich R. M., 2015, A&A, 574, A80
- Valle et al. (2017) Valle G., Dell’Omodarme M., Prada Moroni P. G., Degl’Innocenti S., 2017, A&A, 600, A41
- VandenBerg et al. (2006) VandenBerg D. A., Bergbusch P. A., Dowler P. D., 2006, ApJS, 162, 375
- VandenBerg et al. (2008) VandenBerg D. A., Edvardsson B., Eriksson K., Gustafsson B., 2008, ApJ, 675, 746
- VandenBerg et al. (2013) VandenBerg D. A., Brogaard K., Leaman R., Casagrande L., 2013, ApJ, 775, 134
- VandenBerg et al. (2014) VandenBerg D. A., Bergbusch P. A., Ferguson J. W., Edvardsson B., 2014, ApJ, 794, 72
- Walker (1958) Walker M. F., 1958, ApJ, 128, 562
- Wallerstein & Helfer (1959) Wallerstein G., Helfer H. L., 1959, ApJ, 129, 720
- Yuk et al. (2010) Yuk I.-S., et al., 2010, in Society of Photo-Optical Instrumentation Engineers (SPIE) Conference Series. p. 1, doi:10.1117/12.856864
- de Laverny & Recio-Blanco (2013) de Laverny P., Recio-Blanco A., 2013, A&A, 560, A74