The Gaia Ultra-Cool Dwarf Sample – II: Structure at the end of the main sequence
Abstract
We identify and investigate known late M, L and T dwarfs in the Gaia second data release. This sample is being used as a training set in the Gaia data processing chain of the ultra-cool dwarfs work package. We find 695 objects in the optical spectral range M8 to T6 with accurate Gaia coordinates, proper motions, and parallaxes which we combine with published spectral types and photometry from large area optical and infrared sky surveys. We find that 100 objects are in 47 multiple systems, of which 27 systems are published and 20 are new. These will be useful benchmark systems and we discuss the requirements to produce a complete catalog of multiple systems with an ultra-cool dwarf component. We examine the magnitudes in the Gaia passbands and find that the magnitudes are unreliable and should not be used for these objects. We examine progressively redder colour-magnitude diagrams and see a notable increase in the main sequence scatter and a bi-variate main sequence for old and young objects. We provide an absolute magnitude – spectral sub-type calibration for and passbands along with linear fits over the range M8–L8 for other passbands.
Keywords:
(stars:) binaries: visual — (stars:) brown dwarfs — stars: late-type — (stars:) Hertzsprung-Russell and C-M diagrams — (Galaxy:) solar neighbourhood1 Introduction
The Gaia second data release (Gaia Collaboration et al. 2018a, hereafter Gaia DR2;) was made on April 25th 2018 and contains parallaxes, proper motions, and magnitudes for over one billion objects. The main astrometric observations use a large optical passband called the band, and the completeness magnitude goal of this mission in this band is 20.7 mag (Gaia Collaboration et al. 2016). We are interested in ultra-cool dwarfs (hereafter UCDs), defined as objects with a spectral type later than M7. UCDs are intrinsically very faint in the optical and, therefore, only limited numbers will be observable by Gaia. In particular, we expect there to be around a 1000 L dwarfs and only a few T dwarfs (Haywood & Jordi 2002; Sarro et al. 2013; Smart 2014; Smart et al. 2017).
While this sample is relatively limited in numbers, the availability of all-sky uniformly derived parallaxes provides a volume limited sample that is very useful for a number of astrophysical problems. Gaia UCDs include objects with masses that straddle the stellar–sub-stellar transition, and therefore help us define the observational boundary between hydrogen-burning stars and degenerate brown dwarfs (Chabrier et al. 2009; Burrows et al. 2011, e.g. see). The final volume limited sample will be used to model the stellar–sub-stellar mass function (Allen et al. 2005) and luminosity function (Cruz et al. 2007), removing incompleteness and observational biases (e.g. Malmquist, Eddington and Lutz-Kelker effects) that plague current measurements of this fundamental observable (e.g. see Kirkpatrick et al. 2012; Marocco et al. 2015, and references therein).
The Gaia astrometry and photometry will provide robust measurements of luminosity. The Gaia dataset will aid the modelling of the atmospheres of low-mass objects by providing a cohort of new benchmark systems, such as companions to main-sequence stars (Marocco et al. 2017; Montes et al. 2018) and members of young moving groups (Gagné et al. 2015, e.g.). L dwarfs are analogues for understanding planetary atmospheres (Faherty et al. 2016) and, once we calibrate a cooling curve (Day-Jones et al. 2011, e.g. by studying L dwarf companions to white dwarfs;), their ubiquity will make them promising Galactic chronometers (Soderblom 2010; Burgasser 2009).
A first step in identifying Gaia L and T (hereafter LT) dwarfs was carried out in Smart et al. 2017, matching known LT dwarfs to the first Gaia data release (Gaia Collaboration et al. 2016), which contained accurate positions and magnitudes for 1.14 billion objects. This cross-match resulted in 321 LT dwarfs with Gaia magnitudes and positions. This catalogue makes up the cool part of the Gaia Ultra-cool Dwarf Sample (hereafter GUCDS), which is being used as a training set in Coordination Unit 8 of the Gaia Data Processing and Analysis Consortium pipeline11 1 https://www.cosmos.esa.int/web/gaia/coordination-units. In addition, Gaia Collaboration et al. 2018b cross-matched the input catalogue from Paper 1 with Gaia DR2 and external catalogues such as 2MASS (Skrutskie et al. 2006). This exercise provided 601 LT dwarfs, including 527 fully characterised objects. Here, we build on this legacy and carry out a more comprehensive analysis.
In this paper we concentrate on the LT dwarfs that are in the Gaia DR2. In Section 2 we describe the input catalogue of LT dwarfs used to search the Gaia DR2, the cleaning carried out, and the production of the LT part of the GUCDS catalogue. In Section 3 we look at LT dwarfs that are in binary systems with other objects in the Gaia DR2. In Section 4 we examine this catalogue in absolute magnitude, colour, and spectroscopic space. In the last section we give conclusions and future plans.
2 The comparison catalogues
2.1 The Gaia DR2 Selection
Each of the 1332 million Gaia DR2 sources with full astrometric solutions are the result of individual five-parameter fits to their epoch positions. It is inevitable that some of these fits produce physically nonsensical solutions with large negative parallaxes being the most obvious examples. The solutions with large positive parallaxes that appear to be nearby objects represent the tail of the solutions distribution and is, in a relative sense, significantly impacted by objects being scattered into that solution space. Indeed, if one orders Gaia DR2 by parallax, Proxima Centauri, the closest object to the Sun, would be ranked 61st. If we consider objects with parallaxes greater than 200 mas (i.e. distance 5 pc), there are 792 of them in the Gaia DR2. However, only 38 have a parallax in SIMBAD (Wenger et al. 2000) that is greater than 200 mas. There are also 34 of the 792 objects that match to SIMBAD entries but have parallaxes or photometric distances that place them at distances greater than 5 pc. While there is a remote possibility that some of the new objects with parallaxes greater than 200 mas in the Gaia DR2 are really within 5 pc, the majority, if not all, of the remaining 754 solutions are incorrect.
In Lindegren et al. 2018 they convincingly argued that many of these bad solutions are due to mismatches of the observations. They showed, as it would be expected if this is the dominant reason, that the number of objects with large negative parallaxes is approximately equal to the number of sources with large spurious positive parallaxes. They also provided a number of quality cuts that would reduce the contamination at a small cost to the identification of real objects. However, as our final goal is to make a complete census of all UCDs in the Gaia dataset, we want our training set to include also objects with low quality astrometry so we do not apply those cuts. In addition, the Gaia DR2 is missing astrometric solutions for prominent nearby bright LT dwarfs, e.g. J1049-5319A, (Luhman 2013) and Indi B ab (Scholz et al. 2003), probably because these are binary systems with large orbital motions and their solutions did not meet the quality thresholds for inclusion in the Gaia DR2.
Since the majority of large parallaxes are unreliable and some of the nearest objects are missing, it is premature to attempt to find all UCDs to the Gaia magnitude limit and, therefore, we concentrate on developing criteria for a robust selection procedure in the future. The first step in developing such criteria is the identification of known UCDs that we can use as a training set. In Paper 1 we showed that the most distant single L0 that we expected to see in Gaia is at 80 pc. There are unresolved binary L dwarf systems outside the 100 pc limit that have a combined magnitude greater than the Gaia DR2 limit. There are also very young L dwarfs that have very bright intrinsic magnitudes for their spectral type and these may enter the Gaia DR2 even though they are at a distance greater than 100 pc. For example some of the L dwarfs identified in the Upper Scorpius OB association (see Lodieu et al. 2008, and reference therein) at a distance of 1452 pc (de Zeeuw et al. 1999) with an age of 5 Myr (Preibisch & Zinnecker 1999) have predicted Gaia apparent magnitudes mag from Paper 1. However, the vast majority of LT dwarfs seen by Gaia are within 80 pc, so we start by selecting all objects from the Gaia DR2 with a parallax greater than 10 mas, e.g. a distance limit of 100 pc, which results in 700,055 sources.
2.2 The M, L, T or Y catalogue
| Short | Discovery Name | Offset | |||||
|---|---|---|---|---|---|---|---|
| name | and Source_ID | ″ | mag | mag | mas | mas yr-1 | ° |
| J0004-4044 | GJ 1001 B | 0.8 | 18.353 | -0.4 | 82.1 0.4 | 1641.6 | 155.9 |
| Bin | 4996141155411983744 | 18.4 | 11.500 | -7.2 | 81.2 0.1 | 1650.7 | 155.8 |
| J0235-2331 | GJ 1048 B | 0.1 | 18.598 | 0.6 | 46.6 0.3 | 97.0 | 77.5 |
| 5125414998097353600 | 12.1 | 7.987 | -10.1 | 47.1 0.0 | 84.5 | 80.4 | |
| J0858+2710 | 2MASS 08583693+2710518 | 0.1 | 19.926 | 0.3 | 18.9 1.3 | 221.4 | 155.9 |
| Bin | 692611481331037952 | 15.2 | 15.067 | -4.6 | 17.9 0.1 | 215.0 | 156.8 |
| J1004+5022 | G 196-3 B | 0.2 | 20.170 | 0.3 | 44.4 0.8 | 250.0 | 213.5 |
| Bin | 824017070904063104 | 15.9 | 10.612 | -9.3 | 45.9 0.0 | 246.8 | 214.9 |
| J1004-3335 | 2MASSWJ1004392-333518 | 0.3 | 19.615 | 0.3 | 53.3 0.6 | 495.1 | 135.7 |
| Bin | 5458784415381054464 | 12.0 | 12.908 | -6.5 | 53.5 0.1 | 488.8 | 135.0 |
| J1047+4046 | LP213-067 | 4.4 | 15.183 | -1.3 | 40.1 0.1 | 299.9 | 263.7 |
| J1047+4047 | LP213-068 | 4.5 | 16.931 | -0.7 | 38.9 0.5 | 303.3 | 263.5 |
| J1202+4204 | 2MASS 12025009+4204531 | 0.2 | 19.321 | -0.5 | 31.5 0.4 | 366.6 | 217.5 |
| Bin | 1537249785437526784 | 7.8 | 16.430 | -3.4 | 31.6 0.1 | 368.9 | 218.3 |
| J1219+0154 | ULAS J121932.54+015433.0 | 0.1 | 19.792 | -0.6 | 18.9 0.6 | 114.9 | 229.9 |
| Bin | 3700975728440669184 | 10.9 | 13.441 | -6.9 | 19.8 0.1 | 115.2 | 230.4 |
| J1245+0156 | ULAS J124531.54+015630.9 | 0.1 | 20.612 | -0.5 | 13.5 1.2 | 76.0 | 234.7 |
| Bin | 3702489721592680832 | 8.2 | 12.860 | -8.3 | 13.2 0.0 | 75.6 | 235.1 |
| J1304+0907 | 2MASS 13043318+0907070 | 0.1 | 20.173 | -0.4 | 18.2 0.8 | 134.8 | 278.6 |
| Bin | 3734192764990097408 | 7.6 | 15.160 | -5.4 | 17.8 0.1 | 134.3 | 277.9 |
| J1442+6603A | G 239-25 A | 0.2 | 9.851 | -2.3 | 91.5 0.0 | 301.6 | 262.6 |
| J1442+6603 | G 239-25 B | 0.2 | 15.302 | -1.4 | 91.7 0.2 | 338.5 | 274.3 |
| J1520-4422 | WDS J15200-4423A | 0.4 | 18.293 | -0.3 | 54.5 0.2 | 736.7 | 238.6 |
| J1520-4422B | WDS J15200-4423B | 0.4 | 19.817 | 1.0 | 53.7 0.6 | 753.4 | 238.6 |
| J1540+0102 | ULAS J154005.10+010208.7 | 0.0 | 19.851 | -0.7 | 14.8 0.6 | 51.7 | 253.1 |
| 4416887712294719104 | 13.6 | 14.863 | -5.6 | 17.0 0.7 | 50.9 | 267.0 | |
| J1711+4028 | G 203-50 B | 5.5 | 20.232 | -0.4 | 47.4 0.7 | 263.5 | 72.4 |
| Bin | 1341903196663707904 | 8.7 | 14.233 | -6.4 | 47.1 0.1 | 265.5 | 72.0 |
| J2200-3038A | DENIS-PJ220002.05-303832.9A | 3.7 | 18.437 | -0.3 | 25.4 0.4 | 247.2 | 104.9 |
| J2200-3038B | DENIS-PJ220002.05-303832.9B | 0.1 | 19.042 | -0.6 | 25.3 0.5 | 253.7 | 105.6 |
| J2308+0629 | ULAS J230818.73+062951.4 | 0.1 | 18.059 | -0.7 | 24.7 0.3 | 118.5 | 162.3 |
| Bin | 2665079816223169664 | 3.8 | 13.467 | -5.3 | 24.1 0.1 | 119.8 | 160.5 |
| J2322-6151 | 2MASS 23225299-6151275 | 0.0 | 20.682 | 0.3 | 23.2 1.0 | 114.6 | 135.7 |
| Bin | 6487249243899899904 | 16.6 | 14.902 | -5.5 | 23.6 0.1 | 110.3 | 135.2 |
The initial list of known UCDs was the input catalogue from Paper 1 of 1885 objects with M, L, T or Y spectral classification. To this we added the photometrically-identified LT dwarfs from Skrzypek et al. 2016 and a few other recent discoveries (Marocco et al. 2017; Scholz & Bell 2018; Smith et al. 2018, e.g.). The current list contains 3093 UCDs ranging from M8 to Y2 dwarfs. The M dwarfs were retained to facilitate differentiation of the spectral types in the magnitude and colour space, as some objects are classed as M in optical spectra and L in infrared spectra and vice-versa. Since this input catalogue is dominated by L and T dwarfs we refer to it as the LT catalogue (hereafter LTC).
For all objects we have collected photometry from the Two Micron All Sky Survey (Skrutskie et al. 2006, 2MASS; ), the Panoramic Survey Telescope and Rapid Response System release 1 (Chambers et al. 2016, PS1; ), and the Wide-field Infrared Survey Explorer extension (Wright et al. 2010, AllWISE; ), providing up-to 11 homogeneous magnitudes in passbands ranging from Gunn to . The band was not included as the number of objects with reliable magnitudes were very low.
We started by searching for any objects in the Gaia DR2 release that had a parallax larger than 10 mas and was within ″ of the LTC entry at the Gaia DR2 epoch. We choose ″ as not all entries have published proper motions, the epoch difference can be up to 20 years, and typical proper motions are 500–1000 mas yr-1. This resulted in 753 entries from Gaia DR2. For each entry we then propagated the Gaia DR2 position to the epoch of the LTC positions in the input catalogue using the Gaia DR2 proper motions.
2.3 Treatment of duplicate matches
Some multiple LTC dwarfs matched to the same Gaia DR2 source, e.g. J1416+1348A/J1416+1348B to 1227133699053734528 and J1207-3932A/J1207-3932B (TWA 27 A and B) to 3459372646830687104. These are known binary systems where both the primary and secondary are in our LTC and, the primary is observed by Gaia but the secondary is not. This maybe because the secondary is faint, e.g. J1416+1348B has an estimated , or the primary and secondary are very close and are not resolved in the Gaia DR2 e.g TWA 27A/B have a separation of 0.7″(Chauvin et al. 2004). For these multiple LTC entry matches we assumed that the correct match was the brightest of the binary system.
In general the closest of multiple matches in the Gaia DR2 at the epoch of the LTC position is the correct one, but this may not be always the case. Using only unique matches we calibrated robust linear relations between the Gaia DR2 magnitude and the optical spectral types for each LTC entry with external optical photometry, and the NIR spectral types with external NIR photometry. Using these relations, we estimated an average magnitude for all objects in the LTC (see Paper 1). There were 21 LTC entries with more than one Gaia DR2 object within ″. In Table 1 we report for these objects the source identification number, Source_ID, of the matched Gaia DR2 entries, the offset on the sky of the LTC position (generally 2MASS coordinates) and the Gaia DR2 entry, magnitude, difference, parallax in milli-arcseconds (hereafter mas), total proper motion in mas yr-1 and position angle of the proper motion in degrees.
In all cases the nearest positional match also has the smallest , consistent with being the LT dwarf. Extra objects within ″ are in most cases the other component in known physical binary systems, as is evident when the “Discovery Name” indicates the LT dwarf is the B component in a known system. To all these combinations we applied the binary test described in Section 5, and if a pair satisfies it - i.e. we consider the pair to be a physical system - we label it ‘Bin’ in the first column.
There are three matches that did not pass our binarity test: J0235-2331, J1442+6603A, and J1540+0102. Both J0235-2331 (GJ 1048 B) and J1442+6603 (G239-25B) are in known binary systems where the primary has been correctly identified in Table 1. These represent a failure of our binarity test; reasons for this could be that the orbital motion is significant so the proper motions are not within 10%, or simply bad solutions; we discuss this in Section 5. For J1540+0102, the nearby object 4416887712294719104 has a parallax that differs by more than 3, but it is at the limit and has consistent proper motions, so it warrants further consideration. Most binary systems are already noted in the literature except J1219+0154 and J2308+0629, which were first published in Skrzypek et al. 2016 and photometrically classified as single L dwarfs. Since this is quite a recent study, the entries have not received a significant amount of follow up, so new candidate binary system discoveries are not unexpected. Systems of particular interest are discussed in Section 5.
2.4 Cleaning of matched objects
| Short | Discovery | Source_ID | Offset | |||
|---|---|---|---|---|---|---|
| name | name | ″ | mag | mag | mag | |
| J1207-3932A | TWA 27 A | 3459372646830687104 | 0.02 | 17.408 | 17.450 | 13.363 |
| J1610-0040 | LSRJ 1610-0040 | 4406489184157821952 | 0.67 | 16.595 | 17.066 | 13.917 |
| J0133-6314 | SSSPM J0134-6315 | 4712132354155559040 | 0.05 | 18.206 | 19.652 | 13.919 |
| J1711+4028 | G 203-50 B | 1341903196662424320 | 5.50 | 20.232 | 20.411 | 18.613 |
| J2250+0808 | BRLT 317 | 2713153831843361920 | 5.98 | 20.642 | 20.410 | 17.456 |
The majority (93%) of objects in the Gaia DR2 with mas have Since we are considering each object individually, for our selection purposes it is sufficient to use a simple distance given by the inverse of the parallax, (Bailer-Jones 2015). Using this distance, we calculated an absolute magnitude in the band, . Considering the bulk of L0 dwarfs, we found that a conservative absolute magnitude limit for this spectral type is =14.0 mag. Among the remaining 732 matched objects, only 34 are brighter than this magnitude which we visually inspected. Often they were incorrect matches where the LTC entry is a companion in a binary system that was too faint for Gaia, so instead we matched to the bright component, e.g. the T7 dwarf GJ 229B was matched to its M1 V primary GJ 229A. However, some were just close unrelated stars, e.g. J1119+0021 is a T4.5 that was too faint for Gaia but matched to the unrelated object UCAC4 452-049871. On individual inspection of the 34 sources, only J1207-3932A, J1610-0040 and J0133-6314 appeared to be correct matches to late-type M dwarfs, and all other matches were removed. J1047+4046 was also probably correctly matched, but to a M6.5, so we did not retain it as it is outside our M7 limit. The details of these three objects are included in Table 2.
This absolute magnitude test was not possible for Paper 1 because there were no parallaxes, required to calculate distance moduli. In Gaia Collaboration et al. 2018b they used the Paper 1 input catalogue and did not apply this cleaning, so the very bright “LT objects” on the main sequence of their Figure 9a and the white dwarf track of their Figure 9c are matches of the bright primary star to the fainter LT companion in the Paper 1 input catalogue.
After removing the bright objects we found five objects with an offset from the predicted position and the Gaia DR2 position larger than ″. We retained the first two (J1711+4028, and J2250+0808), listed in Table 2, as both the magnitude difference was not very large, and in a visual inspection of the region there did not appear to be any other nearby objects. For the other three objects (J1108+1535, J1928+2356, and J1456-2747) they have a large offset from the LTC predicted position (19.4, 19.6 and 19.9″respectively) and a large mag difference (-0.8, -2.3 and -2.8 mag, respectively). We conclude that these are objects undetected by Gaia that have been matched to a nearby unrelated star. The target J1928+2356 has a mag, nominally within the Gaia magnitude limit and may appear in later releases, but the other two both have mag, so they will probably not be detected.
2.5 The GUCDS catalogue


| Parameter | Format | Unit | Comment | Example |
|---|---|---|---|---|
| SHORTNAME | a12 | … | Short name used in text of paper | J1807+5015 |
| RA | f13.9 | deg | Right ascension (eq. J2000, ep. 2015) | 271.816572024 |
| DEC | f13.9 | deg | Declination (eq. J2000, ep. 2015) | 50.258197767 |
| DISCOVERYNAME | a25 | … | Common discovery name | 2MASSI J1807159+501531 |
| DISCOVERYREFNAME | a19 | … | Discovery reference | 2003AJ….126.2421C |
| SOURCE_ID | i20 | … | Gaia DR2 source ID | 2123161836615550848 |
| DISTARCSEC | f6.2 | … | Distance DR2 to catalog position | 0.14 |
| MULTIPLEFLAGNAME | a10 | … | Multiple code VB/UR/MG | … |
| MULTIPLEFLAGREFNAME | a19 | … | Multiple code reference BibCodes | … |
| SPTOPTNAME | a10 | … | Optical Spectral type | L1.5 |
| SPTOPTREFNAME | a19 | … | Optical Spectral type BibCode | 2003AJ….126.2421C |
| SPTNIRNAME | a10 | … | Near infrared Spectral type | L1 |
| SPTNIRREFNAME | a19 | … | Near infrared Spectral type BibCode | 2003IAUS..211..197W |
| SPTPHONAME | a10 | … | Photometric Spectral type | … |
| SPTPHOREFNAME | a19 | … | Photometric Spectral type BibCode | … |
| LIT_PARALLAX | f10.3 | mas | Published parallax | 77.250 |
| LIT_PARALLAX_ERROR | f10.3 | mas | Published parallax error | 1.480 |
| LIT_PARALLAXREFNAME | a19 | … | Published parallax BibCode | 2014PASP..126…15W |
| TMASSJ | f10.3 | mag | 2MASS J band magnitude | 12.934 |
| TMASSJERR | f10.3 | mag | 2MASS J band magnitude error | 0.024 |
| TMASSH | f10.3 | mag | 2MASS H band magnitude | 12.127 |
| TMASSHERR | f10.3 | mag | 2MASS H band magnitude error | 0.031 |
| TMASSK | f10.3 | mag | 2MASS K band magnitude | 11.602 |
| TMASSKERR | f10.3 | mag | 2MASS K band magnitude error | 0.025 |
| WISEW1 | f10.3 | mag | ALLWISE W1 Band magntiude | 11.246 |
| WISEW1ERR | f10.3 | mag | ALLWISE W1 Band magntiude error | 0.023 |
| WISEW2 | f10.3 | mag | ALLWISE W2 Band magntiude | 10.971 |
| WISEW2ERR | f10.3 | mag | ALLWISE W2 Band magntiude error | 0.021 |
| WISEW3 | f10.3 | mag | ALLWISE W3 Band magntiude | 10.505 |
| WISEW3ERR | f10.3 | mag | ALLWISE W3 Band magntiude error | 0.056 |
| GUNNG | f10.3 | mag | PANSTARRS G Band magntiude | 21.955 |
| GUNNGERR | f10.3 | mag | PANSTARRS G Band magntiude error | 0.061 |
| GUNNR | f10.3 | mag | PANSTARRS R Band magntiude | 19.748 |
| GUNNRERR | f10.3 | mag | PANSTARRS R Band magntiude error | 0.013 |
| GUNNI | f10.3 | mag | PANSTARRS I Band magntiude | 17.375 |
| GUNNIERR | f10.3 | mag | PANSTARRS I Band magntiude error | 0.003 |
| GUNNZ | f10.3 | mag | PANSTARRS Z Band magntiude | 15.925 |
| GUNNZERR | f10.3 | mag | PANSTARRS Z Band magntiude error | 0.005 |
| GUNNY | f10.3 | mag | PANSTARRS Y Band magntiude | 14.936 |
| GUNNYERR | f10.3 | mag | PANSTARRS Y Band magntiude error | 0.006 |
| PHOT_G_MEAN_MAG | f10.3 | mag | Gaia DR2 G Band magntiude | 17.807 |
| PHOT_G_MEAN_MAG_ERROR | f10.3 | mag | Gaia DR1 G Band magntiude error | 0.002 |
| PHOT_G_MEAN_FLUX | f10.1 | … | Gaia DR2 G Band flux | 1420.5 |
| PHOT_G_MEAN_FLUX_ERROR | f8.1 | … | Gaia DR1 G Band flux error | 2.2 |
| PHOT_BP_MEAN_MAG | f10.3 | mag | Gaia DR2 BP Band magntiude | 20.931 |
| PHOT_BP_MEAN_MAG_ERROR | f10.3 | mag | Gaia DR1 BP Band magntiude error | 0.137 |
| PHOT_BP_MEAN_FLUX | f10.1 | … | Gaia DR2 BP Band flux | 58.6 |
| PHOT_BP_MEAN_FLUX_ERROR | f8.1 | … | Gaia DR1 BP Band flux error | 7.4 |
| PHOT_RP_MEAN_MAG | f10.3 | mag | Gaia DR2 RP Band magntiude | 16.193 |
| PHOT_RP_MEAN_MAG_ERROR | f10.3 | mag | Gaia DR1 RP Band magntiude error | 0.006 |
| PHOT_RP_MEAN_FLUX | f10.1 | … | Gaia DR2 RP Band flux | 2676.0 |
| PHOT_RP_MEAN_FLUX_ERROR | f8.1 | … | Gaia DR1 RP Band flux error | 15.1 |
| GAIAGEST | f10.3 | mag | Estimated DR2 G from SpT | 17.978 |
| PARALLAX | f8.2 | mas | Gaia DR2 parallax | 68.33 |
| PARALLAX_ERROR | f5.2 | mas | Gaia DR2 parallax error | 0.13 |
| PMRA | f8.2 | mas/yr | Gaia DR2 Proper motion in RA | 24.49 |
| PMRA_ERROR | f5.2 | mas/yr | Gaia DR2 RA proper motion error | 0.25 |
| PMDEC | f8.2 | mas/yr | Gaia DR2 Proper motion in Dec | -136.91 |
| PMDEC_ERROR | f5.2 | mas/yr | Gaia DR2 Dec proper motion error | 0.27 |
After cleaning the initial match, our final catalogue is made up of 695 objects in the spectral range M8 to T6 with Gaia astrometry. In the top panel of Figure 1 we show the distribution of the 543 objects with optical spectral classification and the 384 with infrared spectral classification. There were eight unresolved systems where we assumed, for the distributions in Figure 1, the earliest of the two spectral types. For example, J0320-0446 has an infrared spectral type of “M8.5 + T5:” (Burgasser et al. 2008); for the distribution we assumed a spectral type of M8.5. There were also 69 objects with just a photometric spectral type from Skrzypek et al. 2016 that are not included in these figures.
In the lower panel of Figure 1 we show the , , and magnitude distributions. All 695 entries have a magnitude (as well as a proper motion and a parallax), as this is a requirement for inclusion in the Gaia DR2, and 660 UCDs have and magnitudes. In Table 3 we list the astrometry, spectroscopy, photometry and other parameters for the catalogue that are used in the following sections. The full catalogue is available online here and we will refer to it as the GUCDScat.
2.6 Comparison of parallaxes with published results

| Short | Gaia | Published |
|---|---|---|
| Name | mas | mas |
| J0439-2353 | 80.79 0.51 | 110.40 4.001 |
| J0445-3048 | 61.97 0.18 | 78.50 4.901 |
| J0615-0100 | 44.80 0.33 | 45.70 0.112 |
| J0805+4812 | 46.78 0.96 | 43.10 1.003 |
| J1017+1308 | 34.56 0.82 | 30.20 1.403 |
| J1155-3727 | 84.57 0.19 | 104.38 4.691 |
| J1207-3932A | 15.52 0.16 | 19.10 0.404 |
| J1254-0122 | 74.18 2.31 | 84.90 1.905 |
| J1359-4034 | 47.51 0.27 | 64.18 5.481 |
| J1454-6604 | 93.22 0.30 | 84.88 1.716 |
| J1506+7027 | 193.55 0.94 | 310.00 42.007 |
| J1610-0040 | 29.14 0.37 | 31.02 0.268 |
| J1717+6526 | 46.86 0.62 | 57.05 3.519 |
| J1731+2721 | 83.74 0.12 | 113.80 7.0010 |
| J1807+5015 | 68.33 0.13 | 77.25 1.489 |
| J2148+4003 | 123.28 0.46 | 101.01 1.7811 |
Discovery references - 1: Faherty et al. 2012, 2: Sahlmann et al. 2014, 3: Dupuy & Liu 2012, 4: Ducourant et al. 2008, 5: Dahn et al. 2002, 6: Dieterich et al. 2014, 7: Marsh et al. 2013, 8: Dahn et al. 2008, 9: Wang et al. 2014, 10: Dittmann et al. 2014, 11: Liu et al. 2016
In the GUCDScat 151 entries have previously published parallaxes. In Figure 2 we plot the Gaia DR2 versus the published values. In Table 4 we have listed all objects with Gaia DR2 and published values that differ by more than 2.5 times the combined uncertainties. There is only one significant outlier, J1506+7027, which had a parallax estimated in Marsh et al. 2013 of 31042 mas using eight epochs over two years from a combination of , WIRC and compared to the Gaia DR2 value of 193.50.9 mas. The photometric parallax for this object would be 187 mas based on the apparent magnitude-spectral type of the Dupuy & Liu 2012 calibration, consistent with the Gaia DR2 value. It is very difficult to successfully combine observations from different instruments in small field astrometry, and the Gaia DR2 solution does not give any indication of problem. Therefore we adopt the Gaia value.
The Gaia DR2 parallaxes have a median uncertainty of 0.4 mas while the published parallaxes have a median uncertainty of 1.5 mas. For the objects with published parallaxes we calculated the ratio
| (1) |
where is the parallax, the quoted uncertainties, and the subscripts and represent the new and published values, respectively. If the measures were unbiased and the uncertainties correct we would expect this ratio to follow a Gaussian distribution with a mean of zero and a standard deviation of unity. For the 151 common objects, after 3 clipping, the mean is -0.02 and the standard deviation is 1.3. Applying the t-test at the 95% level we find that the mean is not consistent with zero, i.e. P(t)=0.048, while applying the F-test we find that the is significantly different from one, e.g. P(F)=. Since the of the ratio is greater than unity, the implication is that the uncertainties are underestimated. To reconcile the differences, the uncertainties of the published values would have to be increased by 120%, or those of Gaia by 800%. However, as is evident in Table 4, the source of published parallaxes is very heterogeneous, and the calculation of the errors are functions of the different program reduction routines. Hence to obtain applicable corrections the sample should be split into the contributing programs and then individually assessed. The Gaia DR2 will enable a characterisation of the uncertainties of the different small field programs, and the Gaia parallaxes of the anonymous field stars used in the programs allows a precise estimate of the correction from relative to absolute parallax, which is one of the most unreliable steps in small field astrometry. In this way Gaia will contribute to an improvement in the determination and characterisation of parallaxes for objects that are fainter than its magnitude limit.
3 BINARY SYSTEMS
| Discovery Name | RA, Dec | Spec. | |||||
|---|---|---|---|---|---|---|---|
| ″ | ° | Type | mag | mas | mas yr-1 | ° | |
| 2MASS J01415823-4633574 | 2377.2 | 25.4933685,-46.5661305 | L2.0 | 20.02 | 27.4 0.5 | 124.7 | 111.9 |
| 4954453580066220800 | 26.1336010,-46.0756886 | … | 15.67 | 25.9 0.1 | 117.3 | 111.3 | |
| 2MASS J02235464-5815067 | 35.9785858,-58.2519130 | L1.5 | 20.22 | 24.4 0.6 | 105.6 | 99.5 | |
| UCAC4 159-002053 | 1532.6 | 35.2149151,-58.3948241 | M3 | 12.57 | 22.7 0.0 | 97.2 | 99.7 |
| 2MASS J02251947-5837295 | 1499.0 | 36.3319895,-58.6249554 | M9 | 18.41 | 24.3 0.2 | 102.0 | 99.1 |
| 2MASSI J0518461-275645 | 1007.2 | 79.6925197,-27.9460523 | L1.0 | 20.48 | 17.3 0.8 | 32.6 | 98.7 |
| 2954995674982867968 | 79.8573963,-28.1850235 | … | 15.11 | 17.6 0.1 | 32.6 | 98.9 | |
| 2MASS J08430796+3141297 | 819.5 | 130.7828536, 31.6913490 | L2.5 | 20.91 | 14.8 2.3 | 67.9 | 230.3 |
| 709905940243414400 | 130.6127152, 31.8671235 | … | 17.47 | 10.2 0.2 | 73.1 | 235.1 | |
| 2MASS J09073765+4509359 | 301.1 | 136.9073579, 45.1597676 | M9.0 | 18.99 | 26.3 0.4 | 76.8 | 118.1 |
| TYC 3424-215-1 | 137.0239116, 45.1753675 | … | 9.22 | 27.0 0.1 | 80.2 | 123.5 | |
| 2MASS J09175035+2944455 | 1684.7 | 139.4595607, 29.7456267 | L0.0 | 20.74 | 18.5 2.4 | 81.2 | 215.9 |
| 698766581783119872 | 139.8773149, 29.4505981 | … | 17.65 | 12.8 0.3 | 74.4 | 227.6 | |
| 2MASS J11414410+4116568 | 163.5 | 175.4341457, 41.2822985 | L0.0 | 20.36 | 13.2 1.1 | 60.1 | 133.9 |
| HD101620 | 175.4433423, 41.2374147 | F5 | 6.79 | 12.7 0.0 | 58.7 | 130.9 | |
| SDSS J124514.95+120442.0 | 96.4 | 191.3122876, 12.0781604 | L1.0 | 20.98 | 12.3 3.0 | 54.8 | 191.1 |
| SDSS J124520.60+120531.3 | 191.3358362, 12.0918479 | DA | 18.29 | 12.2 0.3 | 54.8 | 186.9 | |
| ULAS J124531.54+015630.9 | 8.2 | 191.3813059, 1.9418705 | … | 20.61 | 13.5 1.2 | 76.0 | 234.7 |
| 3702489721592680832 | 191.3791501, 1.9411384 | … | 12.86 | 13.2 0.0 | 75.6 | 235.1 | |
| WDS J15200-4423A | 1.0 | 230.0053261,-44.3801380 | 18.29 | L1.5 | 54.5 0.2 | 736.7 | 238.6 |
| WDS J15200-4423B | 230.0054769,-44.3798731 | 19.82 | L4.5 | 53.7 0.6 | 753.4 | 238.6 | |
| 2MASS J16325610+3505076 | 57.1 | 248.2342852, 35.0851446 | L1.0 | 19.47 | 28.6 0.3 | 107.8 | 124.2 |
| HD149361 | 248.2192979, 35.0750997 | K0V | 8.03 | 29.0 0.0 | 107.4 | 125.6 | |
| 2MASS J21265040-8140293 | 321.7115878,-81.6752636 | L3.0 | 20.72 | 29.2 0.9 | 128.5 | 153.9 | |
| TYC 9486-927-1 | 217.5 | 321.3662989,-81.6414894 | M1.0V | 10.81 | 29.3 0.1 | 123.2 | 150.9 |
| 2MASS J21192028-8145446 | 1022.2 | 319.8360962,-81.7628668 | … | 14.65 | 29.0 0.1 | 126.0 | 153.3 |
| 2MASS J21121598-8128452 | 2045.7 | 318.0681165,-81.4797055 | M5.5 | 14.04 | 28.6 0.1 | 123.8 | 155.0 |
| DENIS-PJ220002.05-303832.9A | 1.0 | 330.0096692,-30.6428312 | M9.0 | 18.44 | 25.4 0.4 | 247.2 | 104.9 |
| DENIS-PJ220002.05-303832.9B | 330.0096946,-30.6425580 | L0.0 | 19.04 | 25.3 0.5 | 253.7 | 105.6 | |
| ULAS J230818.73+062951.4 | 3.8 | 347.0781929,6.4973599 | … | 18.06 | 24.7 0.3 | 118.5 | 162.3 |
| 2665079816223169664 | 347.0788922,6.4981654 | … | 13.47 | 24.1 0.1 | 119.8 | 160.5 | |
| 2MASS J23225299-6151275 | 16.6 | 350.7215915,-61.8579914 | L2.5 | 20.68 | 23.2 1.0 | 114.6 | 135.7 |
| 2MASS J23225240-6151114 | 350.7191431,-61.8535236 | M5 | 14.90 | 23.6 0.1 | 110.3 | 135.2 |
We searched for resolved binaries using the following criteria:
| (2) |
where is the separation on the sky in arcseconds, is the difference of the GUCDScat and candidate primary parallaxes, and are the parallax and error of the GUCDScat object, is the difference of the total proper motions, and is the difference of the position angles. The chosen criterion is equivalent to 100,000 au, which is a conservative upper limit for a projected physical separation (). This will meet the binding energy criterion of as developed by Caballero 2009 for a 0.1 M⊙ + 2 M⊙ system (Dhital et al. 2010, see also). The criterion is based on a consideration of the errors, standard 3 criterion or 1.0 mas, to allow for solutions that had unrealistically low errors. For the modulus and position angles of the proper motion, criteria based on the errors would remove nearby objects with significant orbital motion, hence we simply choose hard criteria of 10% in both parameters. This is large enough to accommodate most orbital motion, but small enough to avoid false positives. As discussed in Section 2.3 two secondaries in known wide binaries are missed by our criteria – J0235-2331 (GJ 1048 B) and J1442+6603 (G239-25B). We believe that in both cases the orbital motion accounts for a discrepancy in the proper motion criteria.
There are 100 objects in 47 multiple systems including at least one of our GUCDScat objects. We compared this list to a combination of the binary lists from the following publications: Mason et al. 2001; Deacon et al. 2014; De Rosa et al. 2014; Dhital et al. 2015; Gauza et al. 2015; Smith et al. 2015; Scholz 2016; Kirkpatrick et al. 2016; Gálvez-Ortiz et al. 2017; Deacon et al. 2017, and we found that 27 are known systems and 20 are new systems. We found two systems, WDS J15200-4423AB and DENIS-P J220002.05-303832.9AB, that were known spectroscopic binaries that Gaia resolves. In Table 5 we list systems that are particularly worthy of discussion. Several of them include primaries with no previous discussion in the literature, and are therefore identified with their Gaia ID.
- •
SDSS J12451496+1204423 (Zhang et al. 2010) is found to be a wide companion ( au) to the DA white dwarf SDSS J124520.60+120531.3 (Kleinman et al. 2013). L dwarf + white dwarf non-interacting systems are precious benchmarks, since the white dwarf can provide accurate age constraints (Day-Jones et al. 2011, see e.g.).
- •
2MASS J21265040-8140293 was identified by Deacon et al. 2016 as a companion to the young M dwarf TYC 9486-927-1. Analysis of the primary’s spectrum performed by Deacon et al. 2016 revealed Li i 6708 Å absorption consistent with an age range of 10–45 Myr, implying a mass range of 11.6–15 for the secondary. With a projected separation of 7400 au, 2MASS J21265040-8140293 is the widest orbit planetary-mass object known (Caballero 2018). Here we report two new candidate members of this system, namely 2MASS J21192028–8145446 and 2MASS J21121598–8128452. Of them, 2MASS J21121598–8128452 was classified as M5.5 (Gagné et al. 2015), and would be the widest component of the system, with a projected separation of 62700 au. No spectral classification is given for 2MASS J21192028–8145446, but since it is 0.61 mag fainter than 2MASS J21121598–8128452 we expect it to be an m6–7 dwarf (lower case spectral type as this is a photometric estimate). Its projected separation from the M1 primary is 31000 au.
We can compute a lower limit for the binding energy using the known spectral types to estimate masses. For the M1 primary we assume a mass of 0.53 , and for the M5.5 a mass of 0.1 , by interpolating the updated version of Table 5 from Pecaut & Mamajek 201322 2 http://www.pas.rochester.edu/~emamajek/EEM_dwarf_UBVIJHK_colors_Teff.txt. For the m6–7 dwarf, at the age of the system, the Baraffe et al. 2003 isochrones predict a mass in the 35–75 range. We assume the upper limit of this mass range in the following analysis. For the L3 dwarf we adopt a mass of 15 , i.e. the upper limit of the range estimated by Deacon et al. 2016. We also conservatively assume the semi-major axis () to be equal to the observed projected separation (while in reality ). Under the above assumptions, the total binding energy for the system would be , so the system would only be loosely bound (see e.g. Caballero 2009, Figure 1) and unlikely to survive Galactic tides. We can determine an expected lifetime for such a system using Equation 18 from Dhital et al. 2010. We find that for the M5.5 the expected lifetime is 2.9 Gyr, and for the m6–7 is 5.8 Gyr.
An alternative explanation would be that these are simply members of the same young moving group. All four of these objects have indeed been selected as candidate members of the Tucana–Horologium Association by Gagné et al. 2015, while Deacon et al. 2016 argue that 2MASS J21265040-8140293 and TYC 9486-927-1 are members of the Pictoris moving group. However, using Gaia updated astrometry and the BANYAN online tool (Gagné et al. 2018), we find 0% Tucana–Horologium and Pictoris membership probability. The main reason for this discrepancy is probably that the four objects are approximately 5 pc further away than estimated using photometry in Gagné et al. 2015 and Deacon et al. 2016. Their Gaia proper motions on the other hand are consistent with the values used in those papers. Moreover, the initial membership assessments were conducted using BANYAN II (Gagné et al. 2014), and BANYAN is known to provide more accurate membership probabilities (Gagné et al. 2018).
We find a non-zero probability membership only for the AB Doradus moving group, with probability in the range 4.5–10.5%, but the reported age range for the system (10–45 Myr) is inconsistent with the age of AB Doradus (Luhman et al. 2005, 100–125 Myr;). We expect tools such as BANYAN to undergo a major overhaul following Gaia DR2 with the astrometry provided by Gaia strongly constraining the group kinematics. Further discussion of the true nature of this association is therefore deferred to a future paper.
- •
Four systems consist of members of young moving groups and associations. 2MASS J01415823–4633574 forms a wide common-proper-motion pair with the M5.5 2MASS J01443191–4604318. Both objects are members of the Tucana–Horologium Association (Gagné et al. 2015, with 99.5% and 99.8% membership probability, respectively; ). 2MASS J02235464–5815067, 2MASS J02251947–5837295, and UCAC4 159-002053 are also members of the Tucana–Horologium Association (with membership probability of 99.9%, 99.7%, and 99.9% respectively). 2MASSI J0518461–275645 and 2954995674982867968 are both members of Columba (99.9% membership probability for both). These are very wide systems, with typical projected physical separations, 50,000 au, and so the nature of these systems is uncertain. Finally, 2MASS J23225299–6151275 and 2MASS J23225240–6151114 are also members of the Tucana–Horologium Association (with membership probability of 96.7% and 99.9%, respectively), but form a much tighter pair with projected physical separation of 710 au. This system is therefore unequivocally bound.
These systems will provide valuable benchmark systems to constrain atmospheric models and retrieval techniques. However, we have not tried to produce a complete catalogue of binary systems containing UCD objects. As discussed in Section 2 our criteria fails for the binary systems GJ 1048 A/B and G 239-25 A/B in both cases because the modulus of the difference in proper motions is greater than 10%. Hence the production of a complete catalogue will require more sophisticated procedures, such as taking into account the orbital motions of the components based on their predicted masses and distances.
4 Photometric Examination
4.1 Absolute vs.

The most complete set of magnitudes for our UCD objects is in the Gaia passbands, and these are also a new set of bands for studying these objects. In Figure 3 we plot the Gaia DR2 absolute magnitude vs. colour .
The colour shows a tight correlation that gradually increases from 1.5 to 2.1 mag as one descends the main sequence. The standard deviation in colour per absolute magnitude bin varies from 0.06 to 0.13 mag. In the Gaia DR2 there are no published magnitude uncertainties to underline to the user that the magnitude uncertainties are not symmetric. We have transformed the flux uncertainties into magnitude upper and lower bounds and found a median error of 0.02 mag, indicating that the majority of the observed standard deviation is due to intrinsic variations, which is in line with the intrinsic spread seen in similar relations (Filippazzo et al. 2015; Faherty et al. 2016).
There are a number of outliers in Figure 3. In particular, there are six UCD outliers that are 3 from the “main-sequence” locus. We label them in the figure, and discuss them below:
- •
J0543+6422 (2MASS J05431887+6422528) was spectroscopically found to be non-binary in Bardalez Gagliuffi et al. 2014. However, in the Gaia DR2 there is an object detected (287767756635519488) at a separation of 0.6″, slightly brighter (=18.96 vs. 18.97 mag) and slightly redder ( = 2.11 vs. 2.07 mag) but with no parallax estimate. The uncertainty in position is very high (20.8 vs. 1.1 mas in declination), consistent with a nearby object that is being constrained to having a zero parallax. The number of observations is however very different, 42 vs. 191, indicating that it may be the same object with observations assigned to two Source_IDs. The red colour and similar magnitude are consistent with both being an equal-mass binary with a separation of 0.6″ or a single source with two Source_IDs. There is no most probable scenario for this object and it is a prime candidate for observation with a ground-based adaptive optics system to confirm if it is actually a binary system.
- •
J0915+0422 (2MASS 09153413+0422045) is a binary system of two L6 dwarfs with a separation of 0.73″ (Reid et al. 2006), at a distance of 18 pc. In the Gaia DR2 data there is the probable match (Source_ID 579379032257250176) 0.3″ from the GUCDScat position, 579379032258066432 at a separation of 0.6″ȧnd 579379027962863104 at a separation of 3.3″. Neither of the more distant matches have full solutions and the object at 3.3″ is not red ( = 1.4 mag), while the closer detection has only a magnitude. The number of along-scan observations are 111, 80 and 80 for the probable, close and more distant match respectively – this difference in the number of observations for objects close on the sky is large but may not be indicating anything other than the downloading of Gaia observations are complicated. All objects may be real and, in some scan angles, Gaia may resolve them and in others may not. The position uncertainties are very different. For example in declination they are 0.9, 25.6 and 1.3 mas respectively. The high uncertainty is consistent with a nearby object that is being constrained to having a zero parallax.
The most probable scenario is that 579379027962863104 (at 3.3″) is a background star or galaxy and 579379032258066432 (at 0.6″) is the binary companion from Reid at al. (2006), but it could also turn out that the changing scanning direction correlates with the separation, and the matching of the observations were compromised – hence the lower number of along-scan observations. The source of the larger colour for this system compared to a normal L6 is because the and magnitudes are found from integration of the and fluxes in windows, and there is no provision for multiple sources in the same window (Evans et al. 2018). Therefore, an excess in for close binary systems is expected. Indeed, in the or colours J0915+0422 does not stand out, which is expected if the system is made of similar objects and not resolved in both passbands that make up the colour. If we assume the system is an equal mass binary the of an individual component will be 0.75 mag fainter, which is consistent with the 0.6 mag offset from the main sequence in Figure 3. We therefore conclude that the Gaia for this object is the total system magnitude rather than the individual component magnitude.
- •
J1349+5049 (2MASS J13492525+5049544) has no literature indication of binarity and there are no other Gaia DR2 detections nearby. The only Gaia DR2 indication that may suggest a non-single solution is that it has the highest goodness-of-fit statistic for the along-scan observations of 84 (a “good” value would be 3), and the highest astrometric excess noise value for this sample.
- •
J1550+1455 (2MASS J15500845+1455180) is a known L3.5 + L4 system with a separation of 0.9″ (Burgasser et al. 2009). In the Gaia DR2 there is a detection of an object (1192782134013894144) at that separation from J1550+1455, but it has no parallax, , or magnitudes. The position uncertainties are not very high and both the probable match and the companion have over 200 observations, so the two of them are probably real. The very red colour of J1550+1455 could be due to the magnitude including flux form both components.
- •
J1711+5430 (NLTT 44368B) was predicted to be a companion to NLTT 44368, an M3 at 90.2″ based on proper motions (Deacon et al. 2014). In Table 6 we report the Gaia DR2 parallaxes and proper motions. While the values are close, the differences in proper motions are significant and these two objects do not pass our binarity test developed in Section 3. The difference in proper motion may be due to binarity in J1711+5430. However, apart from its red colour for its magnitude, there is no published indication of unresolved binarity, there are no other Gaia DR2 detections nearby, and the only Gaia DR2 parameter that may be indicating multiplicity is the duplicate flag, which is set to 1.
Table 6: J1711+5430 and NLTT 44368 Gaia DR2 parameters. Name mas mas yr-1 mas yr-1 J1711+5430 22.06 0.60 -48.71 1.70 206.73 1.904 NLTT 44368 21.14 0.04 -61.62 0.12 211.31 0.092 - •
J2200-3038A, as noted in Section 3, is the brightest component of the M9 + L0 system DENIS-P J220002.05-303832.9AB with a separation of 1.1″ (Burgasser & McElwain 2006). The second component does not have or magnitudes, and the flux of the primary component probably is the combination of both elements.
4.2 Absolute vs.


In Figure 4 we plot vs and colours, which have a strikingly higher dispersion relative to Figure 3 for a similar baseline in colour. The standard deviation in colour varies from 0.6 to 1.0 mag, while the median formal error is only 0.2 mag. We cannot assign this larger standard deviation to intrinsic variations as there is no indications of this phenomenon in the literature for similar colour baselines. In Gaia Collaboration et al. 2018b they noted the larger scatter but merely commented that these objects have very low flux in the wavelength range, making them intrinsically imprecise, which is evident in the comparison of the three colour-magnitude plots. However, the scatter in Figure 4 is present even for relatively bright UCDs, , and the uncertainties are not consistent with such a large scatter.
Our sample is faint and, particularly in the blue band, at the limit of what the Gaia team considers reliable photometry. If we apply the relative flux error selection that Gaia Collaboration et al. 2018b applied, e.g. phot_g_mean_flux_over_error 50, phot_rp_mean_flux_over_error 20, and phot_bp_mean_flux_over_error 20, then of the 695, 660 and 660 objects with published magnitudes in the , and bands only 693, 14 and 602 would remain. In addition they constrained the flux ratio (phot_bp_rp_excess_factor) to the range phot_bp_rp_excess_factor , which would reduce our 660 sample to only 218. Indeed for the Figure 9 of Gaia Collaboration et al. 2018b they did not apply this filter on fluxes as the size of the sample would have been significantly reduced.
In Arenou et al. 2018 they estimated a unit-weight uncertainty33 3 The “unit-weight uncertainty” is the ratio of the calculated unit weight and an independent estimate of the true error. of 1.3 assuming that the widths of main sequences in Galactic clusters were due solely to photometric uncertainties. The large standard deviation of the colour with respect to the median uncertainty implies a unit-weight uncertainty of 3. Therefore, either there is a large intrinsic scatter or the uncertainties of the are significantly underestimated.
In Figure 5 we show the colour versus the magnitude for all UCDs. We expect the colour to be clustered at a mag, as outlined by the grey box. The brightest examples fall within this range, but for mag the UCDs appear to be spread evenly. To investigate the possibility that the observed scatter is intrinsic we examine the SDSS magnitudes. In Figure 6 we show that the band coverage is roughly equal to the combined SDSS and coverage. We have taken those objects from our sample that have and magnitudes in the SDSS, and constructed a pseudo- magnitude, dubbed , by adding the fluxes in the and SDSS bands. We restricted the selection to objects with uncertainties in , and to less than 0.6 mag, which provided a sample of 75 M9-L1 objects with between 20.17 mag and 22.25 mag. The objects with SDSS counterparts are plotted as open circles in Figure 5.
In the top panel of Figure 7, the objects with colours (filled circles) centre on 2 mag with a dispersion of 0.2 mag that increases slightly as the objects get fainter. The colours of the same objects (open circles) show a lack of clustering with a dispersion of 0.70 mag, even though the median error is 0.25 mag. The offset between the colour at 2 mag and the predicted colour at mag is not unexpected, as the and passbands cover the same spectral range as , but the combined profile is different. Besides, the SDSS magnitudes are on the AB magnitude system, while the zero point of the Gaia magnitudes are set by Vega.
Another indication of problems in the passband for faint red objects can be seen in Figure 33 of Arenou et al. 2018, where the main sequence of the Alessi 10 cluster deviates from the expected path at mag. As this cluster is considered a dense field they cited a number of possible contributing factors (underestimated sky background, overlapping spectra, extended objects and blended objects), but these factors would not be appropriate for our targets, which are primarily in low density regions.


In order to test the reliability of in another cluster, we constructed a sample of the Praesepe cluster members using only the astrometric parameters in the Gaia DR2. We selected all objects with () in the range (126–135, 16–24)°, in the range 3.–7. mas and (, ) in the ranges (-30.—40., -10.—18.) mas yr-1 based on the membership sample provided in Gaia Collaboration et al. 2018b, resulting in 1336 members listed here. There was no limit made on the quality of the photometry, as this would have removed all of the faint members. This cluster was chosen as it has a proper motion that is significantly different from the field so we can be quite confident that the sample is dominated by Praesepe members. In Figure 8 we plot vs. in the top panel, where a deviation of the main sequence from the expected path for faint red objects is seen, as in Arenou et al. 2018 for Alessi 10. The authors colour-coded the Alessi 10 members by the number of observations in the band, and noted that the objects with the lowest number of observations are predominantly in the deviated region. We have made the same colour coding in Figure 8, but the objects with lower numbers of observations are not confined to the deviated part. More examples are required to see if the the correlation of deviation with number of observations observed in Alessi 10 is significant.
In the lower panel of Figure 8 we plot the same objects using instead of . The spread in the main sequence is larger than the top panel because the SDSS magnitudes are less precise; this is also a very dense region that adversely impacts the SDSS measurements compared to the Gaia DR2 ones. The distinct discontinuity in the main sequence at 7.0 mag is due to the brightest objects being saturated in the SDSS. However, the lower main sequence in follows an expected increasingly redder path for fainter objects not unexpected deviated path of the top panel.
We examined other samples of selected red sources and found the colour was significantly noisier than the for the late type M dwarfs catalog from Schmidt et al. 2010 but the colours are consistent for early M dwarfs (West et al. 2011), carbon stars (Downes et al. 2004), white dwarfs (Gentile Fusillo et al. 2019), and quasars (Secrest et al. 2015). As a result, we find the and uncertainty values are inconsistent only for very red, faint, objects.
The flux, from which the magnitude is derived, is the mean of the integrated spectra in the aforementioned windows over all the observations. These objects are extremely faint in , many are background-limited, and one possible reason for underestimating the may be because the error of the mean is dominated by the variation of the background flux, not by the variation of the objects flux. Another possibility is the position of the geometric windows are placed for the and filters using the Gaia position, and perhaps the very red colour leads to a systematic offset in the window position.
Since the value comes essentially from aperture photometry, any detection level is crucially dependent on the background determination. A typical example of the differing fluxes can be seen in Table 3 for J1807+5015. It has fluxes of 1420.5, 58.5 and 2676.0 erg cm-2 s-1 Hz-1 for the and , respectively. As our objects are significantly above background in both the and passbands, the simplest explanation is that a magnitude is included when robust and detections are made, even if the detection is not itself significant, hence the derived magnitudes are determined by the background more than by the object. There is considerable complexity in the derivation and calibration of Gaia magnitudes and we conclude that any use of the passband for faint red objects must be made with caution and do not use it further for this work.
4.3 Colour-magnitude diagrams using external magnitudes


In Figures 9 through 11 we plot the colour combinations of the band and the PS1, 2MASS and AllWISE magnitudes versus absolute magnitudes for the GUCDScat objects. Within each sequence of absolute magnitude comparisons with external photometry we have set the relative range on the axes to be the same to simplify inter-comparisons. In each graph we have indicated on the left-hand axis the average spectral type corresponding to the for the main bulk of stars. Old, young or binary systems do not correspond to this scale. If we replace with the overall trends do not change.
In the last panel of each sequence we indicate spectral typing qualifications in the literature with the use of different symbols. For each entry in a binary system we plot as brown squares those unresolved binaries or systems with angular separations 1″ on the assumption that ground-based programs are unable to extract the magnitudes of the different components if the separation is smaller. This is not always the case: e.g. an GUCDScat system has a nominal separation of 1″ but it is not resolved and the magnitude is a combined value: or, the GUCDScat system has a 1″ but the published magnitudes are of the separate components. We assumed that entries that have the gravity indicators , (Cruz et al. 2009), “int-g” or “vl-g” (Allers & Liu 2013), or that are confirmed members of known moving groups are young and we have plotted them as upright triangles with colours as indicated in the legend. Finally, we assumed objects listed as subdwarfs or with km/s are old, and have plotted them as diamonds.
4.3.1 Gaia and Pan-STARRS PS1 magnitudes
We limit our examination for the PS1 catalogue to the and passbands, because we find that 50% and 30% of the values in and , respectively, have bad quality flags or do not have error estimates. As shown in Figure 6, the band has significant sensitivity in these three PS1 bands and from that plot the effective wavelength of appears to be bluer than . However, the effective wavelength is object-dependent and, on average, for L dwarfs the band effective wavelength is very close to that of .
In Figure 9 the sequence for 15.5 mag 18 mag, roughly L0 to L4, has remarkably constant , and colours with widths of 0.07–0.08 mag. The earlier M dwarfs and later LT dwarfs deviate to bluer and redder colours, respectively. The objects with old and young spectral characteristics have dispersions of 0.08 mag in the and colours and up to 0.04 mag in . Even though the overlap of all objects is quite significant, there is some correlation with the old and young dwarfs, being consistently on one side or the other of the main bulk of objects. For types later than L6 (18 mag) in the bluer and redder colours, the deviations from the fixed colours of the earlier types reaches 0.5 mag and the trend increases with cooler spectral types. These colours can be useful for spectral type differentiation of late L and T dwarfs. Alternatively offers an almost constant value from = 15 to 20 mag.
4.3.2 Gaia and 2MASS PSC magnitudes


Figure 10 is the sequence of absolute magnitude comparisons with –2MASS colours. The mean colours vary by 1.5 mag in all three relations. The dispersion increases from 0.16, 0.23 and 0.30 mag for the , and , respectively. The mean colour for the old and young samples separates by 0.6, 1.0 and 1.2 mag for the , and colours, respectively. The underlying sequences maintain relatively linear relations with increasing slopes as the baseline colours increases. Overall, for L dwarfs all three colours continue to get redder as the objects get fainter in . At the L-T boundary the three colours vary differently: redder in , unchanging in , and a turn around to bluer colours in . The two “young” objects (J0355+1133 (Cruz et al. 2009) and J2148+4003 (Kirkpatrick et al. 2010)) along with the bulk of other objects with young indicators continue to move redward in all three colours. A primary cause of the increased spread in colours from , through , to plausibly corresponds to - and -band suppression from atomic and molecular absorption of methane and H2 collision-induced absorption (Murray et al. 2011, e.g.), which leads to relatively brighter and bands for the lower gravity young objects and in turn redder colours relative to the higher gravity older objects.
4.3.3 Gaia and AllWISE magnitudes


The –AllWISE colour-magnitude diagrams are marked by a drop in objects with magnitudes (648 in , 649 in , 446 in ). The sharper lower bound in the main sequence of indicates that the bands are more complete than Gaia for these objects, while the band is incomplete. The blueward trend for late L and T dwarfs seen in is still evident in , but in and the trend turns again redward, indicating that temperature begins to dominate the spectral energy distribution as it does in stars with spectral types M or earlier.
The width of the main sequence in the vs. –AllWISE colour-magnitude diagrams continues to increase as it does in the –2MASS ones. The mean –AllWISE colours vary by 2.5 mag and their dispersions vary from 0.4 to 0.6 mag. The mean colours of the old and young samples separate by 1.4 mag and have dispersions of 0.7 mag. The shallower depth of the band makes it impossible to quantitatively characterise the colour, but the visible trends are consistent with a continuation of an increasing dispersion and separation.
4.3.4 Colour-magnitude diagrams summary
The remarkably tight sequence in many field objects for =17.5 to 19 mag seen in the Figure 9, vs. , reappears in the Figure 10, vs. and , manifesting as two distinct sequences for the youngest and oldest objects. There is a notable concentration of older objects that have largely cooled to follow a relatively narrow temperature versus luminosity sequence. The existence of these sequences and the range of objects between them, which presumably have a younger age or are binaries, is best illustrated by the vs. and plots in the Figure 11, where the scatter of the subdwarfs and T dwarfs is markedly reduced. The 1.5 to 2 magnitudes of spread in colour for a given for the whole spectral range through late M dwarfs, L dwarfs and T dwarfs would likely make this the most useful diagnostic, though the increased errors and lack of depth of magnitudes and consequent loss of subdwarfs limits the utility of this colour.
4.4 Spectral type-Gaia DR2 magnitude diagrams


In Figure 12 we plot the absolute magnitudes in the and bands vs. published optical spectral types. For un-resolved objects the observed spectral type is that of the brightest component, so it reflects the temperature of only that component. If it is an equal mass system the observed spectral type is the approximate type of both components. For these passbands the subdwarfs tend to appear overluminous while the younger objects underluminous. The binaries are in general overluminous as the spectral type is the temperature of only one component, while the magnitude has a contribution from both components. The differences are not always consistent because the contributions of the secondaries vary. However, the magnitudes are more offset than the magnitudes due to those estimates being the combined values instead of the component values. In light of our discussion in Section 4.2 about problems with and the higher signal to noise of , in future Gaia data releases it might well be appropriate to make comparisons using rather than . We have also made similar plots comparing to the spectral types determined from the near infrared colours (not shown) and the relations are similar to those shown, though with larger spreads.
4.5 Absolute Magnitude Relations
There have been many determinations of the relation between absolute magnitude and spectral types. For M, L and T dwarfs this has been derived as a simple polynomial fit to a sample of classified objects with measured parallaxes and apparent magnitudes (Dahn et al. 2002; Vrba et al. 2004; Henry et al. 2004; Dupuy & Liu 2012; Marocco et al. 2013, e.g. for M, L and T dwarfs see). While the number of objects per spectral class bin was small and the relative error of the parallaxes was large, such a simple approach was justified. The Gaia LT dwarf sample is, especially for early L dwarfs, large and the relative error of the Gaia DR2 parallaxes are small so this approach is no longer sufficient.
The determination of an absolute magnitude calibration is not straight forward and there are a number of pitfalls:
- •
when using the parallax with assumed Gaussian uncertainties to determine the absolute magnitude the resulting uncertainties in magnitude are non-Gaussian (Lutz & Kelker 1973; Smith 2003; Bailer-Jones 2015; Luri et al. 2018);
- •
the use of a magnitude limited sample leads to Malmquist-like biases;
- •
young and old objects within the same spectral class have absolute magnitudes that are systematically different, biasing the results;
- •
close unresolved binaries bias the calibration to brighter magnitudes;
- •
there is no physical reason to assume that the absolute magnitude and spectral types are related by a smooth polynomial.
Some of these problems can be alleviated by assuming an absolute magnitude vs. colour relation (Bochanski et al. 2011, e.g. ), but the use of colour introduces other problems such as the inflection in colour at the L-T transition (Tinney et al. 2003).
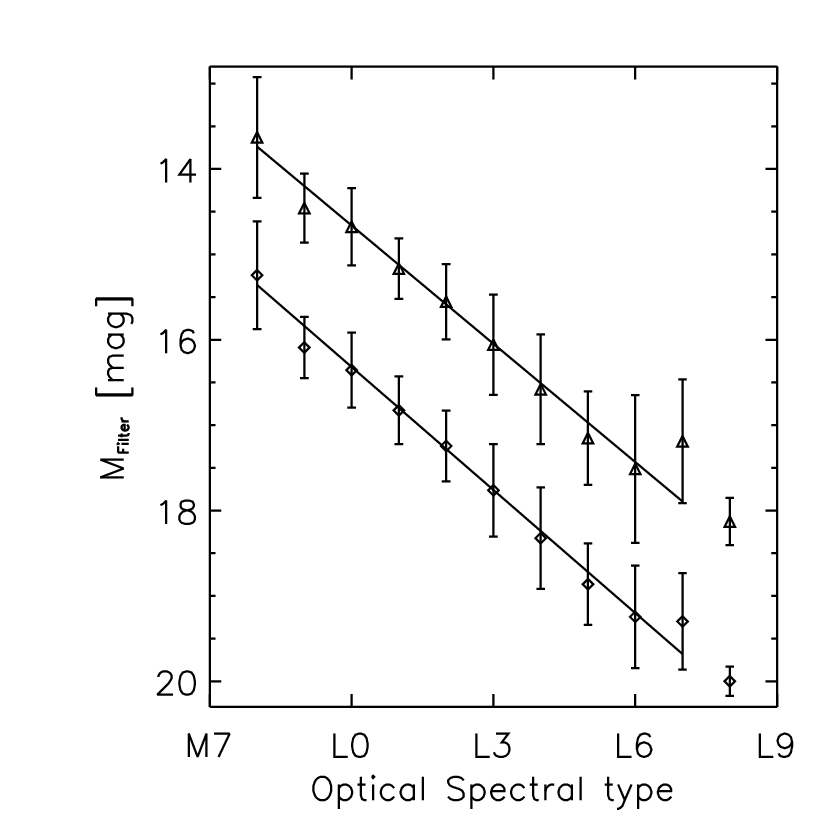
For the Gaia DR2 passbands we find the absolute magnitudes as a function of optical spectral type for the bins where we have four or more objects, as presented in Table 7. The points in Figure 13 are the inferred median absolute magnitudes per spectral type calculated taking into account that the uncertainties in the absolute magnitudes are neither Gaussian nor symmetric. The medians were obtained using a Bayesian hierarchical model assuming that within each spectral type bin there is a natural spread due to evolution and other effects (for example metallicity), and an additional scatter due to the observational uncertainties in the apparent magnitude and parallax. The comparison with the observations that yield the likelihood term is done in the space of parallaxes and apparent magnitudes. No distance estimation is involved and no smoothness constraint is enforced in the model.
As can be seen in Figure 13 the relation between M8 and L6 is linear, which is true for the other passbands. The number of objects in the other passbands is lower and the apparent magnitude precision is worse, so separate absolute magnitude estimates for each spectral bin is not warranted. Over this spectral range the error of a linear fit is smaller than the scatter, so to enable absolute magnitude estimates as a function of spectral type we made robust linear fits to all GUCDScat objects with published magnitudes of the form:
| (3) |
valid in the range SpT=68 (M8) to 76 (L6). In Table 8 we present the parameters for the linear fits for all passbands. We include for completeness the Gaia DR2 passbands, though we recommend using calibration in Table 7 for the most precise absolute magnitude estimates.
| SpT | N | ||
|---|---|---|---|
| Opt | [mag] | [mag] | |
| M8 | 16 | 15.240.63 | 13.630.71 |
| M9 | 17 | 16.090.36 | 14.460.40 |
| L0 | 234 | 16.360.44 | 14.680.45 |
| L1 | 103 | 16.830.40 | 15.170.36 |
| L2 | 68 | 17.240.41 | 15.550.44 |
| L3 | 41 | 17.760.54 | 16.060.59 |
| L4 | 26 | 18.320.60 | 16.580.64 |
| L5 | 17 | 18.860.48 | 17.150.55 |
| L6 | 6 | 19.250.60 | 17.510.87 |
| L7 | 8 | 19.300.56 | 17.190.73 |
| L8 | 4 | 20.000.17 | 18.130.28 |
| Absolute | |||
|---|---|---|---|
| magnitude | [mag] | [mag] | |
| Optical SpT | |||
| MG | 477 | -17.303 0.568 | 0.480 0.004 |
| Mr | 323 | -11.159 1.977 | 0.419 0.033 |
| Mi | 380 | -18.351 0.771 | 0.489 0.008 |
| M | 455 | -17.663 1.162 | 0.462 0.016 |
| Mz | 356 | -18.001 1.436 | 0.463 0.013 |
| My | 358 | -17.957 0.627 | 0.449 0.003 |
| MJ | 475 | -14.479 0.408 | 0.373 0.005 |
| MH | 444 | -11.304 0.750 | 0.317 0.010 |
| M | 442 | -9.342 0.568 | 0.282 0.008 |
| MW1 | 438 | -4.983 1.036 | 0.216 0.008 |
| MW2 | 435 | -4.008 0.955 | 0.198 0.010 |
| MW3 | 422 | -11.554 0.878 | 0.292 0.012 |
| Infrared SpT | |||
| MG | 319 | -7.717 0.979 | 0.347 0.017 |
| Mr | 197 | 0.446 2.305 | 0.257 0.033 |
| Mi | 254 | -10.941 1.488 | 0.386 0.016 |
| M | 300 | -8.294 1.545 | 0.331 0.023 |
| Mz | 234 | -10.109 1.398 | 0.353 0.022 |
| My | 239 | -9.706 1.776 | 0.334 0.026 |
| MJ | 317 | -8.001 0.602 | 0.282 0.009 |
| MH | 313 | -5.238 1.460 | 0.232 0.018 |
| M | 314 | -4.367 1.259 | 0.213 0.019 |
| MW1 | 309 | -0.232 0.575 | 0.150 0.008 |
| MW2 | 308 | 0.051 0.868 | 0.142 0.014 |
| MW3 | 299 | -5.085 0.948 | 0.202 0.014 |
Parameters for Equation 3: , valid in the range M8 to L6. The top set of parameters applies when using optical spectral types and the lower set for infrared spectral types.
5 Conclusion
We have searched for known ultra-cool dwarfs in the Gaia DR2 and found 695 with measured parallaxes, proper motions and magnitudes. We have matched this dataset to publicly available large optical and infrared surveys, and produced a catalogue that we make available to the community and will use as a training set in the Gaia data processing chain of the ultra-cool dwarfs work package. We have discovered 20 new multiple systems in our LT catalogue. We have examined a number of colour-magnitude diagrams finding significant main sequence structure in the ultra-cool dwarf region. We find the magnitude is not reliable for this sample and caution against using it for selection and interpretation.
We are currently using this sample to develop and refine procedures for a large scale search of the full Gaia DR2 to discover previously unknown ultra-cool dwarfs. We expect there to be over 300 new LT dwarfs and there will be 1000s of new late M-type ultra-cool dwarfs. We will catalogue and examine in an automatic way these new objects looking for fine structure in the spectro-photometric trends and find outlier objects that will indicate new physical processes or environments.
Acknowledgments
The authors thank the anonymous referee for a thorough review that increased the quality of this contribution. We thank Jonathan Gagné for useful discussions during the preparation of this manuscript. DB was supported by Spanish grant ESP2015-65712-C5-1-R; JCB by Proyecto FONDECYT postdoctorado 2018 nro. 3180716; FM by the NASA Postdoctoral Program at the Jet Propulsion Laboratory, administered by Universities Space Research Association under contract with NASA; JAC by Spanish grant AYA2016-79425-C3-2-P; HRAJ by the UK’s Science and Technology Facilities Council grant number ST/M001008/1.
This publication makes use of reduction and data products from the Centre de Données astronomiques de Strasbourg (SIMBAD, cdsweb.u-strasbg.fr); the ESA Gaia mission (gea.esac.esa.int/archive/) funded by national institutions participating in the Gaia Multilateral Agreement and in particular the support of ASI under contract I/058/10/0 (Gaia Mission - The Italian Participation to DPAC); the Panoramic Survey Telescope and Rapid Response System (Pan-STARRS, panstarrs.stsci.edu); the Sloan Digital Sky Survey (SDSS, www.sdss.org); the Two Micron All Sky Survey (2MASS, www.ipac.caltech.edu/2mass) and the Wide-field Infrared Survey Explorer (, wise.ssl.berkeley.edu).
References
- Allen et al. (2005) Allen P. R., Koerner D. W., Reid I. N., Trilling D. E., 2005, ApJ, 625, 385
- Allers & Liu (2013) Allers K. N., Liu M. C., 2013, ApJ, 772, 79
- Arenou et al. (2018) Arenou F., et al., 2018, A&A, 616, A17
- Bailer-Jones (2015) Bailer-Jones C. A. L., 2015, PASP, 127, 994
- Baraffe et al. (2003) Baraffe I., Chabrier G., Barman T. S., Allard F., Hauschildt P. H., 2003, A&A, 402, 701
- Bardalez Gagliuffi et al. (2014) Bardalez Gagliuffi D. C., et al., 2014, ApJ, 794, 143
- Bochanski et al. (2011) Bochanski J. J., Hawley S. L., West A. A., 2011, AJ, 141, 98
- Burgasser (2009) Burgasser A. J., 2009, in E. E. Mamajek, D. R. Soderblom, & R. F. G. Wyse ed., IAU Symposium Vol. 258, IAU Symposium. pp 317–326
- Burgasser & McElwain (2006) Burgasser A. J., McElwain M. W., 2006, AJ, 131, 1007
- Burgasser et al. (2008) Burgasser A. J., Tinney C. G., Cushing M. C., Saumon D., Marley M. S., Bennett C. S., Kirkpatrick J. D., 2008, ApJ, 689, L53
- Burgasser et al. (2009) Burgasser A. J., Dhital S., West A. A., 2009, AJ, 138, 1563
- Burrows et al. (2011) Burrows A., Heng K., Nampaisarn T., 2011, ApJ, 736, 47
- Caballero (2009) Caballero J. A., 2009, A&A, 507, 251
- Caballero (2018) Caballero J. A., 2018, Geosciences, 8, 362
- Chabrier et al. (2009) Chabrier G., Baraffe I., Leconte J., Gallardo J., Barman T., 2009, in Stempels E., ed., American Institute of Physics Conference Series Vol. 1094, 15th Cambridge Workshop on Cool Stars, Stellar Systems, and the Sun. pp 102–111
- Chambers et al. (2016) Chambers K. C., et al., 2016, preprint, (arXiv:1612.05560)
- Chauvin et al. (2004) Chauvin G., Lagrange A.-M., Dumas C., Zuckerman B., Mouillet D., Song I., Beuzit J.-L., Lowrance P., 2004, A&A, 425, L29
- Cruz et al. (2007) Cruz K. L., et al., 2007, AJ, 133, 439
- Cruz et al. (2009) Cruz K. L., Kirkpatrick J. D., Burgasser A. J., 2009, AJ, 137, 3345
- Dahn et al. (2002) Dahn C. C., et al., 2002, AJ, 124, 1170
- Dahn et al. (2008) Dahn C. C., et al., 2008, ApJ, 686, 548
- Day-Jones et al. (2011) Day-Jones A. C., et al., 2011, MNRAS, 410, 705
- De Rosa et al. (2014) De Rosa R. J., et al., 2014, MNRAS, 445, 3694
- Deacon et al. (2014) Deacon N. R., et al., 2014, ApJ, 792, 119
- Deacon et al. (2016) Deacon N. R., Schlieder J. E., Murphy S. J., 2016, MNRAS, 457, 3191
- Deacon et al. (2017) Deacon N. R., et al., 2017, MNRAS, 467, 1126
- Dhital et al. (2010) Dhital S., West A. A., Stassun K. G., Bochanski J. J., 2010, AJ, 139, 2566
- Dhital et al. (2015) Dhital S., West A. A., Stassun K. G., Schluns K. J., Massey A. P., 2015, AJ, 150, 57
- Dieterich et al. (2014) Dieterich S. B., Henry T. J., Jao W.-C., Winters J. G., Hosey A. D., Riedel A. R., Subasavage J. P., 2014, AJ, 147, 94
- Dittmann et al. (2014) Dittmann J. A., Irwin J. M., Charbonneau D., Berta-Thompson Z. K., 2014, ApJ, 784, 156
- Downes et al. (2004) Downes R. A., et al., 2004, AJ, 127, 2838
- Ducourant et al. (2008) Ducourant C., Teixeira R., Chauvin G., Daigne G., Le Campion J.-F., Song I., Zuckerman B., 2008, A&A, 477, L1
- Dupuy & Liu (2012) Dupuy T. J., Liu M. C., 2012, ApJS, 201, 19
- Evans et al. (2018) Evans D. W., et al., 2018, A&A, 616, A4
- Faherty et al. (2012) Faherty J. K., et al., 2012, ApJ, 752, 56
- Faherty et al. (2016) Faherty J. K., et al., 2016, ApJS, 225, 10
- Filippazzo et al. (2015) Filippazzo J. C., Rice E. L., Faherty J., Cruz K. L., Van Gordon M. M., Looper D. L., 2015, ApJ, 810, 158
- Gagné et al. (2014) Gagné J., Lafrenière D., Doyon R., Malo L., Artigau É., 2014, ApJ, 783, 121
- Gagné et al. (2015) Gagné J., Lafrenière D., Doyon R., Malo L., Artigau É., 2015, ApJ, 798, 73
- Gagné et al. (2018) Gagné J., et al., 2018, ApJ, 856, 23
- Gaia Collaboration et al. (2016) Gaia Collaboration et al., 2016, A&A, 595, A2
- Gaia Collaboration et al. (2018a) Gaia Collaboration et al., 2018a, A&A, 616, A1
- Gaia Collaboration et al. (2018b) Gaia Collaboration et al., 2018b, A&A, 616, A10
- Gálvez-Ortiz et al. (2017) Gálvez-Ortiz M. C., Solano E., Lodieu N., Aberasturi M., 2017, MNRAS, 466, 2983
- Gauza et al. (2015) Gauza B., Béjar V. J. S., Pérez-Garrido A., Zapatero Osorio M. R., Lodieu N., Rebolo R., Pallé E., Nowak G., 2015, ApJ, 804, 96
- Gentile Fusillo et al. (2019) Gentile Fusillo N. P., et al., 2019, MNRAS, 482, 4570
- Haywood & Jordi (2002) Haywood M., Jordi C., 2002, in Bienayme O., Turon C., eds, EAS Publications Series Vol. 2, EAS Publications Series. pp 199–205, doi:10.1051/eas:2002018
- Henry et al. (2004) Henry T. J., Subasavage J. P., Brown M. A., Beaulieu T. D., Jao W.-C., Hambly N. C., 2004, AJ, 128, 2460
- Kirkpatrick et al. (2010) Kirkpatrick J. D., et al., 2010, ApJS, 190, 100
- Kirkpatrick et al. (2012) Kirkpatrick J. D., et al., 2012, ApJ, 753, 156
- Kirkpatrick et al. (2016) Kirkpatrick J. D., et al., 2016, ApJS, 224, 36
- Kleinman et al. (2013) Kleinman S. J., et al., 2013, ApJS, 204, 5
- Lindegren et al. (2018) Lindegren L., et al., 2018, A&A, 616, A2
- Liu et al. (2016) Liu M. C., Dupuy T. J., Allers K. N., 2016, ApJ, 833, 96
- Lodieu et al. (2008) Lodieu N., Hambly N. C., Jameson R. F., Hodgkin S. T., 2008, MNRAS, 383, 1385
- Luhman (2013) Luhman K. L., 2013, ApJ, 767, L1
- Luhman et al. (2005) Luhman K. L., Stauffer J. R., Mamajek E. E., 2005, ApJ, 628, L69
- Luri et al. (2018) Luri X., et al., 2018, A&A, 616, A9
- Lutz & Kelker (1973) Lutz T. E., Kelker D. H., 1973, PASP, 85, 573
- Marocco et al. (2013) Marocco F., et al., 2013, AJ, 146, 161
- Marocco et al. (2015) Marocco F., et al., 2015, MNRAS, 449, 3651
- Marocco et al. (2017) Marocco F., et al., 2017, MNRAS, 470, 4885
- Marsh et al. (2013) Marsh K. A., Wright E. L., Kirkpatrick J. D., Gelino C. R., Cushing M. C., Griffith R. L., Skrutskie M. F., Eisenhardt P. R., 2013, ApJ, 762, 119
- Mason et al. (2001) Mason B. D., Wycoff G. L., Hartkopf W. I., Douglass G. G., Worley C. E., 2001, AJ, 122, 3466
- Montes et al. (2018) Montes D., et al., 2018, MNRAS, 479, 1332
- Murray et al. (2011) Murray D. N., et al., 2011, MNRAS, 414, 575
- Pecaut & Mamajek (2013) Pecaut M. J., Mamajek E. E., 2013, ApJS, 208, 9
- Preibisch & Zinnecker (1999) Preibisch T., Zinnecker H., 1999, AJ, 117, 2381
- Reid et al. (2006) Reid I. N., Lewitus E., Allen P. R., Cruz K. L., Burgasser A. J., 2006, AJ, 132, 891
- Sahlmann et al. (2014) Sahlmann J., Lazorenko P. F., Ségransan D., Martín E. L., Mayor M., Queloz D., Udry S., 2014, A&A, 565, A20
- Sarro et al. (2013) Sarro L. M., Berihuete A., Carrión C., Barrado D., Cruz P., Isasi Y., 2013, A&A, 550, A44
- Schmidt et al. (2010) Schmidt S. J., West A. A., Hawley S. L., Pineda J. S., 2010, AJ, 139, 1808
- Scholz (2016) Scholz R.-D., 2016, A&A, 587, A51
- Scholz & Bell (2018) Scholz R.-D., Bell C. P. M., 2018, Research Notes of the American Astronomical Society, 2, 33
- Scholz et al. (2003) Scholz R.-D., McCaughrean M. J., Lodieu N., Kuhlbrodt B., 2003, A&A, 398, L29
- Secrest et al. (2015) Secrest N. J., Dudik R. P., Dorland B. N., Zacharias N., Makarov V., Fey A., Frouard J., Finch C., 2015, ApJS, 221, 12
- Skrutskie et al. (2006) Skrutskie M. F., et al., 2006, AJ, 131, 1163
- Skrzypek et al. (2016) Skrzypek N., Warren S. J., Faherty J. K., 2016, A&A, 589, A49
- Smart (2014) Smart R. L., 2014, Mem. Soc. Astron. Italiana, 85, 649
- Smart et al. (2017) Smart R. L., Marocco F., Caballero J. A., Jones H. R. A., Barrado D., Beamín J. C., Pinfield D. J., Sarro L. M., 2017, MNRAS, 469, 401
- Smith (2003) Smith H., 2003, MNRAS, 338, 891
- Smith et al. (2015) Smith L. C., et al., 2015, MNRAS, 454, 4476
- Smith et al. (2018) Smith L. C., et al., 2018, MNRAS, 474, 1826
- Soderblom (2010) Soderblom D. R., 2010, ARA&A, 48, 581
- Tinney et al. (2003) Tinney C. G., Burgasser A. J., Kirkpatrick J. D., 2003, AJ, 126, 975
- Vrba et al. (2004) Vrba F. J., et al., 2004, AJ, 127, 2948
- Wang et al. (2014) Wang Y., et al., 2014, PASP, 126, 15
- Wenger et al. (2000) Wenger M., et al., 2000, A&AS, 143, 9
- West et al. (2011) West A. A., et al., 2011, AJ, 141, 97
- Wright et al. (2010) Wright E. L., et al., 2010, AJ, 140, 1868
- Zhang et al. (2010) Zhang Z. H., et al., 2010, MNRAS, 404, 1817
- de Zeeuw et al. (1999) de Zeeuw P. T., Hoogerwerf R., de Bruijne J. H. J., Brown A. G. A., Blaauw A., 1999, AJ, 117, 354