The global stability of M33: still a puzzle2018The global stability of M33: still a puzzle–References
Abstract
The inner disc of the local group galaxy M33 appears to be in settled rotational balance, and near IR images reveal a mild, large-scale, two-arm spiral pattern with no strong bar. We have constructed -body models that match all the extensive observational data on the kinematics and surface density of stars and gas in the inner part of M33. We find that currently favoured models are unstable to the formation of a strong bar of semi-major axis kpc within 1 Gyr, which changes the dynamical properties of the models to become inconsistent with the current, apparently well-settled, state. The formation of a bar is unaffected by how the gas component is modelled, by increasing the mass of the nuclear star cluster, or by making the dark matter halo counter-rotate, but it can be prevented by either reducing the mass-to-light ratio of the stars to or in solar units or by increasing the random motions of the stars. Also a shorter and weaker bar results when the halo is rigid and unresponsive. However, all three near-stable models support multi-arm spirals, and not the observed large-scale bi-symmetric spiral. A two-arm spiral pattern could perhaps be tidally induced, but such a model would require an implausibly low mass disc to avoid a bar and there is no visible culprit. Thus the survival of the current state of this exceptionally well-studied galaxy is not yet understood. We also suspect that many other unbarred galaxies present a similar puzzle.
Keywords:
galaxies: kinematics and dynamics — galaxies: evolution — galaxies: spiral — galaxies individual: M33 — (galaxies:) Local Group1 Introduction
It has long been known (Hohl 1971; Kalnajs 1978) that many models of galaxy discs are unstable to the formation of a strong bar, yet a significant fraction of disc galaxies lack any trace of a bar, and another large fraction have only weak bars (Sellwood & Wilkinson 1993; Eskridge et al. 2000; Menéndez-Delmestre et al. 2007; Masters et al. 2011). Many reviews have addressed how and why bars form (Toomre 1981; Sellwood & Wilkinson 1993; Binney & Tremaine 2008; Sellwood 2013) and both Berrier & Sellwood 2016 and Bauer & Widrow 2019 highlighted the problem of accounting for the observed bar fraction. As these questions raise a host of both theoretical and observational issues related to normal mode analysis, halo responsiveness, bulges, non-linear behaviour at resonances, tidal interactions, bar destruction, the role of gas, galaxy formation and disc assembly, the evolution of the bar fraction over cosmic time, secular changes, etc., we will not review all this material here and simply refer the reader to these articles.
Our puropse in this paper is to focus on one simply stated question: can we understand why the Local Group galaxy M33, also known as NGC 598 or the Triangulum galaxy, does not possess a strong bar? Recent observational studies, most notably that by Corbelli et al. 2014, have provided a quite detailed level of information about the distribution of stars, gas, and dark matter in the inner parts of this galaxy, and some kinematic information about stellar velocities near the disc centre. Our objective is to create and evolve a dynamical model that is as close a match as possible to the observed constraints and to determine whether the model does or does not form a strong bar in a short time period. In posing this question, we deliberately set aside questions of how the galaxy came to be in its observed state, and assume only that the inner galaxy is reasonably settled and is not presently undergoing rapid changes to its internal structure.
The outer gas disc of M33 has long been known to be strongly warped (Rogstad et al. 1976; Corbelli et al. 2014; Kam et al. 2017) and the extended stellar disc is also similarly warped (Lewis et al. 2013), but to a slightly lesser extent. This feature has been attributed to a relatively recent passage of M33 past its much larger neighbour M31 as modeled, for example, by Semczuk et al. 2018. However, the most recent proper motion measurements (van der Marel et al. 2018) suggest that M33 has yet to pass close to M31, which if confirmed would require a different origin for the misalignment of the outer disc.
But whatever the cause of the warp, the careful analyses of the HI emission by C14 and of the excited gas by Kam et al. 2015 find the kinematics of the gas inside a radius of kpc of the nucleus of M33 to be characterized by a well-ordered elliptical flow pattern, that suggests a flat, rotationally-supported, nearly axisymmetric disc, observed at an inclination to our line of sight.
Humphreys & Sandage 1980 identified a large number of spiral arms in M33 from B- and V-band photometry, although many are just spurs and fragments. Some of these features are also weakly visible in the outer parts of the WISE 1 3.4 m image presented by Kam et al. 2015. These last authors also fit multiple arms to their H image. However, near IR photometry at J, H and K (Regan & Vogel 1994) and the 2MASS image (Jarret et al. 2003) reveal a regular 2-arm spiral pattern, with a third weaker arm, and these features also dominate the inner disc in the 3.4 m image. We conclude that many of the arms counted by Humphreys & Sandage 1980 reflect star-forming features that are bright in visible bands due to young stars and begin to show up again at longer wavelengths due to warm dust, but the old stellar disc, which is most easily seen at wavelengths of a few m, supports a more regular bi-symmetric density wave.
Regan & Vogel 1994 note an apparent weak, inner bar, but were uncertain that it was not just the inward extension of the spiral arms. Corbelli & Walterbos 2007 reported mild non-circular motion in the inner 200 pc, which they argued was indicative of a short, weak bar. The analysis of the lower spatial resolution HI observations presented in the appendix of C14 suggests that these mild non-axisymmetric features do not strongly distort the circular flow pattern in the neutral gas. This conclusion was reinforced by Kam et al. 2015, who obtained small velocity residuals from their measurements of the H line, shown in their Figure 11, after subtracting an axisymmetric flow pattern.
We conclude that this evidence supports our assumption that the inner disc of M33, which contains most of the galaxy’s stars and gas, is indeed reasonably settled, lacks a strong bar, and is not presently undergoing changes in its internal structure on an orbital time-scale, which is Myr at kpc.
Despite the abundance of data on M33, there have been rather few attempts to model its internal structure in detail, although the warp has attracted more attention (see Semczuk et al. 2018, and references therein). Both Rahimi & Kawata 2012 and Dobbs et al. 2018 focused on the “flocculent” spirals that are prominent in visual images (Humphreys & Sandage 1980), which they model with hydrodynamics. Rahimi & Kawata 2012 compared different numerical recipes for stellar feedback over short periods of evolution in a disc model embedded in a rigid halo that approximated M33. The simulations by Dobbs et al. 2018 had a dynamically cool and heavy stellar disc with no halo in some cases, but their simulations also covered a brief period and none continued the evolution beyond 1 Gyr. Here we report simulations of longer duration, most of which form strong bars.

2 Modelling M33
We adopt the standard estimated distance to M33 of kpc (Freedman et al. 2001; Kam et al. 2015), so that projects to pc, and inclination of the inner disc of (Warner et al. 1973; Corbelli & Salucci 2000).
2.1 Distribution of mass
C14 derived the deprojected rotation curve of M33 from Doppler measurements of the 21 cm line of neutral hydrogen, which is in excellent agreement with that obtained by Kam et al. 2015 from a Fabry-Pérot data cube of the H emission line of excited hydrogen. The radial variation of the circular speed, with error bars, is reproduced here in Fig. 1 from Figure 12 of C14, and takes account of the pronounced warp in the disc of M33, which begins at kpc. The solid curve indicates our least-squares fit to these data, which has the following form
| (1) |
where the values of the fitted parameters are: km/s, kpc, and . This form forces the curve to start from the origin, which is not fully supported by the input data. Although Kam et al. 2015 obtain a gentle rise from a fit to their 2D velocity map obtained by from Fabry-Pérot observation of the H line, Corbelli & Walterbos 2007 report a velocity jump across the nucleus of km s-1 between the approaching and receding sides in their major axis slit position (Rubin 1987, see also). An unresolved rise of the deprojected circular speed to km s-1 would be consistent with the dense nuclear star cluster, which has an estimated mass of M⊙ (Kormendy & McClure 1993; Kormendy et al. 2010). Aside from this possible velocity jump, which we will return to, we consider the smooth curve to be an adequate fit to the data.


C14 combined BVIgi photometry, SED fitting based on a revised Bruzual & Charlot 2003 method, and the “Padova 1994” stellar evolutionary library to create stellar mass maps for each pixel. The black points in their Figure 11, show azimuthally averaged values of the mass-to-light ratio in solar units of for kpc, rising inside this radius to . C14 also find slightly higher values for when they use only the BVI colours.
Kam et al. 2015 present surface brightness profiles derived from Spitzer IRAC 3.6 m and WISE 1 3.4 m images, and fit an exponential disc with a length scale of 1.7 kpc with a small bulge that accounts for 3% of the total IR light. Kam et al. 2015 adopted for the disc, giving a total stellar mass of M⊙(Kam et al. 2017), which is much heavier than the heavier disc model of C14, but these authors preferred a lower in their later paper, which yields a similar stellar mass to that of the heavier disc proposed by C14.
Since heavier discs are more difficult to stabilize, we have adopted the more conservative lower disc surface density of the two models fitted by C14, which is presented in their Figure 10. They extrapolate the surface density from kpc with two exponential functions, adopting a slope change at kpc, to give a total mass for the stellar disc integrated to kpc of M⊙. In the same figure, they also give the HI surface density they derived from the intensity of the 21 cm line, which they correct for helium content to yield a smoothed neutral gas density profile. The upper panel of Fig. 2 shows the fitted surface density profiles of the various baryonic components, which includes the helium correction and the molecular contribution given by eq. (1) of C14. The total mass of the gas disc integrated to kpc is M⊙.
We computed the central attractions of the stellar and total gaseous discs separately by the elliptic integral method (Binney & Tremaine 1987), which takes account of the flattening of the disc to yield stronger central attraction in the mid-plane and manifests features associated with the changes in the slopes of the surface density. We subtracted the attractions of the disc stars and gas from the fitted circular speed (eq. 1), and attribute the remaining attraction to a spherical dark halo in the usual way. We adopt the cored halo density profile
| (2) |
where the central density M⊙ pc-3 and core radius kpc. The sums of the attractions of the two disc components together with that of the halo yield our model rotation curve, given by the dashed line, which is in satisfactory agreement with the observed data. Our non-standard halo density profile (eq. 2) differs from both the NFW function (Navarro et al. 1996) adopted by C14 and Hague & Wilkinson 2016 and the common pseudo-isothermal function also used by Kam et al. 2015.11 1 The denominator is and not .
2.2 Distribution functions
We wish to realize an axisymmetric, equilibrium -body model that resembles the current properties of M33 as closely as possible. In order to achieve this, we must select particles from distribution functions (DFs) for each component that would yield the desired density profiles, together with any velocity dispersion constraints, in the adopted total potential.
2.2.1 Disc components
As we are interested in the bar stability of the M33 disc, we limit the radial extent of both the stellar and gaseous disc components by applying an outer density taper that reduces their surface density from the full observed value at kpc to zero at kpc using a smooth cubic function. The adopted truncation, which discards almost 11% of the stellar mass and 22% of the gas mass, limits our focus to the roughly co-planar inner part of the disc and neglects the low surface density outer part, which is strongly warped and halo-dominated.
Kormendy & McClure 1993 used the Fourier quotient method to obtain a line-of-sight velocity dispersion from the Ca II triplet absorption line, finding values between 25 – 30 km s-1 over the inner 1″ of M33. Corbelli & Walterbos 2007 measured mostly emission line velocities in multiple long slits at a variety of position angles. However, they also estimated the stellar velocity dispersion “along the major axis of the inner disc”, again using the Ca II triplet, finding values in the range 28 – 35 km s-1, in agreement with the other study. Neither paper attempted to follow the outward radial variation of the velocity dispersion, probably because of decreasing surface brightness and/or instrumental spectral resolution limits.
We therefore adopt a uniform for the stellar disc, where
| (3) |
(Toomre 1964). Here is the Gaussian width of the radial velocity component of the particles, and is the epicyclic frequency. Adopting a constant yields a velocity dispersion in both the radial and azimuthal components that decreases outwards from a central value of km s-1. Our model also has a central value of the vertical velocity dispersion of km s-1, which is constructed as described below. While the true axis ratio of the velocity ellipsoid in M33 is unknown, a flattening of may be reasonable. Combining the in-plane and vertical components at an adopted inclination of yields a line-of-sight dispersion of km s-1, which is consistent with reported values. We determine the appropriate in-plane DF by the method given by Shu 1969 in the numerically determined attraction of the thickened discs and halo mass distributions.
We also model the gaseous disc with collisionless particles in some of our simulations. In these cases, we adopt and select velocities for the particles using the Jeans equations (Binney & Tremaine 2008) which are adequate when .
We adopt a Gaussian function with a spread of 100 pc in the -direction to create the volume density profiles of both the star and gas discs and assign velocities using the vertical Jeans equation at each radius in the numerically determined gravitational attraction.
These procedures allow us to realize the discs with particles that result in satisfactory equilibria at the outset. The radial variation of the velocity dispersion in the stellar disc is shown in the lower panel of Fig. 3.
2.2.2 Halo component
Holley-Bockelmann et al. 2005 demonstrated that a satisfactory equilibrium halo DF can be determined by Eddington inversion (Binney & Tremaine 2008) in the potential of a composite disc-halo mass distribution by neglecting the flatness of the disc i.e., the attraction of the disc should be , where is the disc mass enclosed within a sphere of radius ; this spherical average is generally weaker than the attraction in the disc mid-plane. They showed that the mild flattening of the final potential has a negligible effect on the equilirium of the halo, as we have also found in our own work. We therefore use Eddington’s formula to derive an isotropic DF for the halo of M33 in the presence of the disc components.
Since our adopted halo density (eq. 2) yields an enclosed mass that asymptotically increases linearly with radius, we limit its extent by setting the density to zero for kpc. In previous work, we have found it acceptable to limit the radial extent of an infinite live halo having a steeply declining density profile simply by computing the DF assuming an infinite radial extent and then discarding from the DF any particles having , where is the gravitational potential of the total mass distribution. This bound eliminates all particles having sufficient energy that even part of their orbits extend beyond , thereby creating a smooth density decrease to at . Even though the resulting particle density falls below that required to maintain the central attraction in the outer parts, we have generally found that the consequential slight disequilibrium of the outer halo led to negligible adjustments to the outer density profile as the model evolved.
However, this was not the case with our current halo model, whose density decreases with radius only as . An isotropic DF within the shallower potential well of this halo includes many orbits that have a wide radial range, and our previously adopted truncation rule resulted in a density of active particles that fell far below the expected density even inside , with the result that the halo model began to expand, reducing the density of all but the very inner part, as it relaxed towards equilbrium. Inclusion of the boundary term from the inversion formula Binney & Tremaine 2008, which we had at first neglected, made only a minor improvement.
We therefore have revised the halo density profile to taper to zero at as
| (4) |
and compute the DF in the total potential of the discs plus this revised halo by Eddington inversion which, with the inclusion of the boundary term, results in an equilibrium halo. The cosine taper shaves mass from the halo at all radii, but it has a negligible effect on the halo mass interior to 10 kpc, which is the radial extent of the discs, and the circular speed is decreased by just 5%, or 7 km s-1, at kpc.
2.3 Combined model
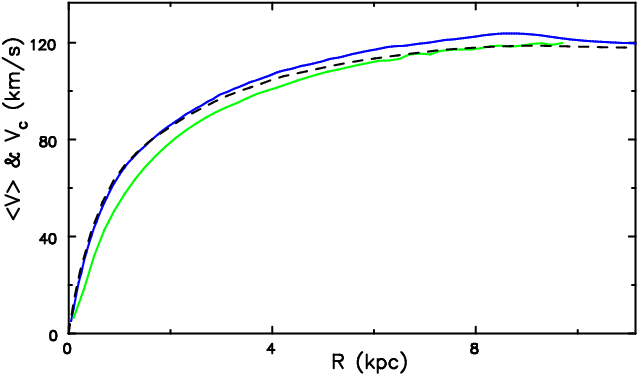
The rotation curve in the mid-plane of the combined three-component model, which takes account of disc thickness and gravity softening, is given by the blue curve in the top panel of Fig. 3; it is in reasonable agreement with the dashed line that is drawn using eq. (1). The bump near kpc is caused by our truncation of the disc components at that radius (Casertano 1983, see e.g.). The mean orbital speed of the star particles, green curve, is lower because of asymmetric drift. The virial ratio of the complete model is , and no significant adjustment to the mass or velocity distribution of any component occurs in the initial evolution.


3 Simulations
Both the stellar disc and halo were each represented by 1 million particles in our fiducial simulation. These collisionless particles were drawn from the DFs described above using the smooth procedure outlined in the appendix of Debattista & Sellwood 2000. The gaseous disc was represented by particles, chosen at random from the truncated gas density profile.
3.1 Collisionless particle only simulations
We computed the evolution of this three component model using the hybrid option of the GALAXY code (Sellwood 2014).
3.1.1 Numerical parameters
The gravitational attraction of the two disc components was computed using a 3D cylindrical polar grid having 330 rings, 512 spokes and 75 planes. The outer edge of the grid was at 11.13 kpc, the vertical spacing of the grid planes was 50 pc, so that it extended to kpc from the disc mid-plane. We softened gravity using the cubic-spline kernel recommended by Monaghan 1992, which yields the full Newtonian attraction at distances , where the softening length pc. We further smooth away small-scale density fluctuations by discarding sectoral harmonics in the solution for the gravitational field.
The field of the halo particles was computed using a spherical grid having 200 shells and extending to 42 kpc, and we used a surface harmonic expansion to compute aspherical terms of the field on each shell, up to and including the terms. Naturally, the mutual attraction of the disc and halo particles was included.
We employed a basic time step of years, which was increased by two factors of two at spherical boundaries of radii 1 kpc and 2.5 kpc. As usual, we ran comparison models in which all numerical parameters were varied within reasonable ranges, which generally caused little change, except that a ten-fold increase in the number of particles in each component caused bar formation to be slightly delayed, since the seed amplitude of the instability was lower, while increasing the softening length to 200 pc also resulted in slower bar formation, but the ultimate outcome was unchanged.
3.1.2 Basic result
The evolution of our fiducial model is shown in Fig. 4. The initially axisymmetric disc forms multi-arm spirals at first, in agreement with the behaviour reported by Dobbs et al. 2018 in their short simulations. However, a pronounced bar becomes established before 1 Gyr of evolution, which settles and persists to the end of the simulation. The bar forms through the standard global bar instability mechanism (Toomre 1981; Binney & Tremaine 2008) and has no inner Lindblad resonance. The semi-major axis kpc when it first forms and kpc by the end. The study by Semczuk et al. 2018 was focused on the tidal interaction with M31, but these authors reported a simulation of M33 in isolation that also formed a bar in the inner 3 kpc of the disc. Their simulation included gas dynamics, star formation, and feedback but they gave few details about the bar.
Our fiducial simulation includes a disc component having a much lower initial velocity dispersion and the density profile of the total gas. Since we also modelled this component using collisionless dynamics, it is hardly surprsing that its evolution, shown in the bottom four panels of Fig. 4, follows that of the more massive stellar disc. We report simulations in §3.2 in which this component is treated more like a gas.
The instability we find that forms a strong bar on the timescale of a few orbit periods is a surprising result, since it seems likely that M33 is stable today. To argue otherwise, is to assume that we see M33 at a special time, when something has happened recently to make its inner disc unstable, while it was stable Gyr ago. It might be argued that the triggering event was a possible tidal interaction with M31; this interaction may have created the warp, as modelled by Semczuk et al. 2018. But there is no evidence for a disturbed flow pattern in the distribution and kinematics of the stars and gas of the inner disc, and this is the region that would need to have been changed recently to have tipped the disc from stability into the unstable state we find.

3.1.3 How could a bar be avoided?
We therefore discount the possibility of a recent change to the stability of the inner disc that has not yet had time to manifest itself. Instead we address the question of how must the properties we have adopted for M33 be changed in order that the disc remains stable. We have run additional simulations to examine all of the following possibilities, and compare, in Fig. 5, the time evolution of the bar amplitude in each case, with that in our fiducial model (solid red curve). We discuss the implications of these results in the next section.
- 1.
Athanassoula 2002 and others have shown that bars grow more rapidly in responsive halos than in rigid ones. We have therefore experimented with replacing the halo by the fixed central attraction that would arise if the halo particles were replaced by a rigid mass distribution. As expected, this change substantially reduced the growth rate of the bar, as shown by the blue curve in Fig. 5, but a weak bar of length kpc was present by the end of the simulation.
- 2.
Saha & Naab 2013 found that bars grew yet more rapidly when the halo was given some angular momentum in the same sense as the disc, and conversely growth was slowed slightly when the halos rotated in a retrograde sense. We have therefore experimented with adding a large amount of angular momentum to the halo to make it counter-rotate against the disc, to almost the maximum extent possible by reversing the sign of the -component angular momentum of most of the halo particles having initially. Although this change slowed the initial growth of the bar, as indicated by the cyan curve in Fig. 5, the bar amplitude rose steadily until it exceeded that in the isotropic halo (red curve).
- 3.
Reducing the disc mass, while increasing the halo mass to preseve the same total rotation curve has historically been regarded as the favoured way suppress the bar instability (Ostriker & Peebles 1973; Efstathiou et al. 1982; Christodoulou et al. 1995). We report two experiments in which we reduced the stellar disc mass to 75% and to 50% of the values we adopted from C14. (The mass of the gas component was unchanged.) In both cases we fitted a new halo density profile to compensate for the reduced disc mass and derived a new isotropic DF for it by Eddington inversion. The evolution of the bar amplitude in these cases is shown in Fig. 5. The dashed red line (75% disc mass) indicates that a slightly shorter (kpc), but still pronounced, bar developed in this case, while no significant bar developed when the disc mass was halved (dotted red line).
- 4.
Berrier & Sellwood 2016 were able to stabilize some of their galaxy models by reducing the surface density of the inner disc only. Accordingly, we tried tapering the inner disc density from the full density at kpc to half the central density at . The resulting reduced attraction of the inner disc allows an approximately four-fold increase in , the central density of the halo, and a smaller core radius . The dot-dashed curve in Fig. 5 shows that a bar still forms; the final bar is somewhat shorter (kpc) than in our fiducial run.
- 5.
Athanassoula & Sellwood 1986 demonstrated that the bar instability could also be quelled by increasing . The green curve in Fig. 5 shows that the amplitude of a possible bar-like feature remains very low when disc random motion is raised by 33% to , and the initial thickness of the stellar disc was also doubled.
- 6.
Toomre 1981 argued, on the basis of linear perturbation theory, that the bar instability could be inhibited by a dense center (Sellwood 1989; Sellwood & Evans 2001; Saha & Elmegreen 2018, see also). As noted above, we have so far ignored the nuclear star cluster in M33 whose properties were characterized by Kormendy & McClure 1993. As the mass of this object is small (Kormendy et al. 2010, give M⊙), we thought it unlikely to affect the global dynamics of the disc, but we include it in an additional test for completeness. Here we model the nuclear cluster as a rigid central Plummer sphere having a mass of M⊙ and a core radius of 10 pc, which is over 20 times the estimated mass and also more diffuse than the nuclear star cluster in M33, but causes the circular speed to rise to km s-1 at pc or 2.85″. This dense component required us to shorten the basic timestep by a factor of 10. As expected, the initial bar amplitude evolution, magenta curve in Fig. 5, is little affected by this small extra mass. Although the bar length kpc does not change much, its amplitude is substantially weakened as the evolution continued. The formation and subsequent weakening of the bar almost doubles the velocity spread of particles in the inner disc, making this mildly barred model at later times again inconsistent with the current state of M33.


3.2 Modelling the gas
All the above models employed a second set of collisionless particles for the gas component. Here we present simulations using a different code to determine whether the bar instability is altered by a hydrodynamical treatment for this component, both with and without star formation and feedback. We use the publicly available GIZMO code22 2 We downloaded the public version at: http://www.tapir.caltech.edu/phopkins/Site/GIZMO.html (Hopkins 2015) which is able to simulate both hydro- and stellar dynamics. The -body part of GIZMO is almost identical to that in GADGET3, and the code offers several modern hydrodynamical solvers which share some common features with moving-mesh codes such as Arepo (Springel 2010). We adopt the recommended Meshless Finite-Mass method for the hydrodynamics. The minimum softening length for gas and star particles is 50 pc, while that for dark matter particles is 100 pc.
In most of our simulations with GIZMO, we employed five times as many gas particles as we used in GALAXY, but otherwise the initial positions and velocities of star, gas, and dark matter particles are the same as in our fiducial model. The outcomes of tests with gas physics that employed the smaller number of gas particles were very similar to those with the larger number, but all the hydrodynamical results we present here use the larger number of gas particles (). We also tried mimicking the effect of the nuclear star cluster (NSC) in M33 by including a massive particle of M⊙ (the mass of star particles) and a softening length of pc. Since we found that including or omitting the NSC had almost no effect on the bar instability, we here present only results without a NSC.
The top row of Fig. 6 presents a check of the evolution using the GIZMO code with both disc components treated as collisionless particles for comparison with our fiducial GALAXY model. The agreement with the result shown in Fig. 4 is entirely satisfactory; the bar amplitude at Gyr is and the bar lengths are very similar in both codes.
We have experimented with different ways to model the gas component in order to test their effect on the bar instability. The second two rows of Fig. 6 show the behaviour of a simulation with gas that includes radiative heating and cooling by metal species, star formation, and mechanical feedback from star formation (Springel & Hernquist 2003; Krumholz & Gnedin 2011; Hopkins et al. 2013; Hopkins et al. 2017). The result in the bottom two rows of Fig. 6 shows the different behaviour when thermal, instead of mechanical, feedback is used. A strong bar forms in the stellar component by Gyr in both cases, and weakens only slightly after Gyr. It is still very prominent in the bottom two rows, where the bar amplitude is at Gyr. The mechanical feedback creates larger “holes” in the gas in (middle two rows) than happens with just thermal feedback (bottom), in agreement with the findings of Dobbs et al. 2018.

We have also tried other prescriptions to model the gas; in one case treating it as an isothermal gas (K), and another as having an adiabatic equation of state () with cooling, but without feedback in both cases. We do not show the evolution of these simulations, but note that a strong bar also formed in both and the absence of feedback allowed a large fraction of the gas to be driven into the centre. The inflow in the adiabatic case was sufficient to cause the bar to weaken at later times.
In summary, we find that a strong bar still forms independently of how we choose to model the hydrodynamics of the gas component.
4 Discussion
We have found that a strong bar forms in our stars-only models unless (a) the stellar disc mass is halved, (b) the velocity dispersion and disc thickness are increased, or (c) the responsive halo is replaced by a rigid halo. While a bar also formed in all our simulations with gas, it subsequently dissolved in one case apparently due to gas inflow to the center, as also happened in the GALAXY simulation with a central mass to represent an excessively massive nuclear star cluster. But the early formation of a bar confirmed that the current state of M33 is unstable and the subsequent evolution altered the mass distribution and velocity dispersion to be inconsistent with that currently observed.
4.1 A rigid or rotating halo
Our results have confirmed the finding by Athanassoula 2002, Saha & Naab 2013, and Berrier & Sellwood 2016 that galaxy models that might be bar-stable in rigid halos can be unstable when the same halo is composed of responsive particles. While it has long been known (Sellwood 1980; Weinberg 1985) that strong bars can exchange angular momentum with a responsive halo, Sellwood 2016 showed that the bar instability in the disc could also elicit a supporting response from mobile halo particles even in the linear growth phase, when amplitudes are tiny. Thus live haloes exacerbate the bar stability problem (Athanassoula 2002), as was confirmed by our test reported in Fig. 5. Changing the halo DF to include rotation (Saha & Naab 2013) or velocity anisotropy (Sellwood 2016) has some effect on the growth rate of the bar, but freezing the halo reduces it to a much greater extent.
Thus the stability criteria proposed by Ostriker & Peebles 1973, Efstathiou et al. 1982, and Christodoulou et al. 1995 do not apply in more realistic models. Sellwood 2016 found that a disc in a live halo can still be stabilized by reducing its mass, and estimated that the ratio of disc-to-halo attraction must be reduced to between 30% and 50% of that required for a rigid halo. Nevertheless, our disc model embedded in a rigid halo still formed a weak bar with kpc and having about 1/3 the amplitude of that shown in Fig. 4, while the live halo model with half the disc mass was stable, which is consistent with these earlier results.
4.2 Stability and disc mass
C14 estimated a mean over the radial range kpc from modeling surface brightness measurements in the colour bands, and a slightly higher value from photometry alone. Adopting the lower mass, we have found that the disc forms a strong bar of semi-major axis kpc. We also obtained a strong, but slightly shorter, bar when we tried reducing to 75% of their lower value, but we found no evidence for a bar throughout the evolution in a model in which we halved the disc mass from that in our fiducial model. In this last case, our model assumed that everywhere and over most of the disc. Kam et al. 2017 reported that their originally favoured (Kam et al. 2015) yielded a stellar disc mass of M⊙, while we had to reduce the disc mass to M⊙ to obtain stability, which would seem to imply for our stable disk model. While values derived from photometric broadband colours can be quite uncertain, because the fraction of mass in dim, low-mass stars is not well constrained, and are lower than typically expected values (Conroy 2013; Schombert et al. 2018, e.g.) and would imply an unusually top-heavy IMF in the disc of M33. We also note that this low value for makes the stellar mass within 20 kpc less even than the corresponding gas mass.
Furthermore, if it were the case that the presence of bar in a galaxy is determined by halo dominance, then barred galaxies would have systematically heavier discs than their unbarred cousins. Such a difference would be manifested in a systematic offset in the Tully-Fisher relation, since unbarred galaxies of a given luminosity would be predicted to have higher circular speed, which is not observed (Mathewson & Ford 1996; Courteau et al. 2003). Indeed, Bosma 1996 was unable to find any systematic differences between barred and unbarred galaxies.
Tapering the surface density of the inner disc to half its value at , which Berrier & Sellwood 2016 reported could stabilize some models, did not prevent a strong bar from forming in the case of M33. As noted above, this change effectively reduces in the inner disc to be below that of the outer disc, which seems the wrong way round.
4.2.1 Spiral constraints on disc mass
It should also be noted that all the spiral patterns in our simulation of this low mass disc were multi-armed, as shown in Fig. 7 and there was little sign of the dominant pattern that stands out in near-IR images of M33 (Regan & Vogel 1994; Jarret et al. 2003). The multiplicity of spiral arm patterns that develop through gravitational instabilities in a stellar disc is determined by the swing-amplification parameter (Toomre 1981, defined by); vigorous amplification occurs over the range when the rotation curve is flat, and for smaller values when the rotation curve rises. Recall that , which is the ratio of the azimuthal wavelength of an -armed spiral to the characteristic scale for gravitational instabilities in discs (Toomre 1964), evaluated at , the corotation radius of the spiral. Thus the preferred arm multiplicity in a family of models having a fixed rotation curve rises as the inverse of the disc surface mass density (Sellwood & Carlberg 1984; Athanassoula et al. 1987). The low-mass disc whose evolution is shown in Fig. 7 has at kpc, where the rotation curve is still rising, and this quantity increases to at kpc, accounting for the spirals that were preferred in this model. Thus the fact that the clearest spiral pattern at near-IR wavelengths is bi-symmetric in M33 is an additional argument against preventing bar formation by reducing the disc mass. In fact, the great majority of spiral galaxies, both with and without bars, have two spiral arms (Davis et al. 2012; Hart et al. 2016; Yu et al. 2018), which is an indicator of a heavy disc (Sellwood & Carlberg 1984; Athanassoula et al. 1987).
The preceding discussion applies to self-excited instabilities in discs, but it has long been known that bi-symmetric spirals can also be driven by bars (Sanders & Huntley 1976; van Albada & Roberts 1981; Li et al. 2015) or tidal perturbations (Toomre & Toomre 1972; Noguchi 1987; Toomre 1981; Byrd & Howard 1992), for which there is also observational support (Kormendy & Norman 1979; Kendall et al. 2011). As reviewed in the introduction, there is some evidence for a weak bar in M33 with a semi-major axis that is perhaps only 360 pc (Regan & Vogel 1994) which, if it is there at all, is associated with the inner ends of the much more extensive spiral arms. If the bi-symmetric spiral pattern observed in M33 is a response to external forcing, then it weakens the above conclusion that its bi-symmetry is an indicator of a heavy disc. We here report additional simulations to determine whether the pattern could be the response to either type of forcing.
4.2.2 Spiral response forced by an inner bar
Our objective here is to test whether the large-scale bi-symmetric spiral pattern in the old stellar disc of M33 could be the forced response to the very mild inner bar. We therefore report additional simulations of the low-mass disc model in which we apply an external forcing field to represent the bar.
The amplitude of the imposed potential varies as
| (5) |
causing it to rise from near zero to its full value over the period of . We adopt the bar-like quadrupole form that rotates at the angular rate
| (6) |
The semi-major axis of the bar is , is the mass of the assumed uniformly-dense ellipsoid, and the dimensionless constants and depend on the axis ratios of the bar and and are chosen to give the correct asymptotic variation of the quadrupole potential at small and large radii (Weinberg 1985; Sellwood 2008, see).


We deliberately exaggerated the size and mass of the bar in M33, since a smaller, weaker bar would have less effect. Accordingly we set the semi-major axis of the bar kpc, made it a prolate homogeneous ellipsoid with axes that rotates about a short axis, and adopt M⊙. We hold constant such that corotation is at , and choose the bar turn-on time scale .
The early part of the evolution of the stellar disc in the resulting simulation is shown in the top row of Fig. 8. The imposed potential elicited a supporting response from the particles in the very center of the disc, but the evolution of the outer disc at all times is barely distinguishable from that in Fig. 7. This similarity is hardly surprising given the rapid outward decay of the perturbing field (eq. 6). We have not examined the gaseous response, since we wish to know how the old stellar disc would respond, but previous work (e.g. Li et al. 2015, and references therein) has shown that the spiral response of the gas is transient as the bar turns on and extends only as far as the outer Lindblad resonance, which is at kpc for our adopted pattern speed. Thus we find that the large-scale bisymmetric spiral in the old stellar disc of M33 could not be the forced response from any visible bar in that galaxy.
4.2.3 Spiral response forced by a tidal encounter
Rather than attempt fully self-consistent simulations of encounters between two galaxies, such as reported by Semczuk et al. 2018, we here follow the simpler approach pioneered by Toomre 1981. When two galaxies move on eccentric orbits about their common center of mass, the internal tidal stresses within each can be approximated as a rotating quadrupole perturbation that is strong during the period of peri-centre passage only. Our objective is not to match any specific perturber or orbit, but merely to explore how the disc responds to a generic stretch of this kind.
In this case, we adopt the following time dependence for the perturbing potential
| (7) |
where is the approximate duration of closest approach, and we adopt the same form for as given in eq. (6). In order to achieve the desired duration, we choose , causing the perturbing field to be strong as it turns through an angle of radians. We choose kpc, set , with km s-1, so that the perturbation peaked Gyr after the start of the simulation. This somewhat arbitrary set of values deserves some discussion. The quadrupole field (eq. 6) rises simply as for , so that other choices for kpc would merely rescale the perturbation amplitude within the disc. We chose a prograde, in-plane encounter since it would excite the greatest response, and moderately inclined orbits should exert similar forces in the disc plane. Our choice of a constant matters only while , since the forcing frequency is immaterial when the perturbation is weak. The circular orbit frequency at corresponds to a higher-than-circular frequency during a peri-centric passage at a larger radius, although the frequency would be lower if the orbit were also inclined. Thus the only significant free parameter is the perturbation amplitude. Here we choose such that the peak perturbed acceleration at the disc edge (kpc) is 2.5% of the centripetal acceleration at the same point.
The evolution after the closest passage is shown in the bottom row of Fig. 8. In this case, the external field has indeed provoked an initial bi-symmetric spiral response in the stellar disc, which is tightly wrapped in the very centre, while the outer disc supports an oval distortion. The oval distortion persists at later times, while the stronger spiral features fade, leaving a double-bar structure. An additional simulation with twice the amplitude of the perturbing field quickly formed a strong bar.
The obvious candidate for a tidal perturbation of M33 is a possible encounter with M31, and the models of Semczuk et al. 2018 find a best fit for the warp when closest approach occurred about 1 Gyr ago. However, the inner disc of M33 at the last two frames in the bottom row of Fig. 8 that bracket 1 Gyr after the closest approach has a clear double bar structure, which is quite inconsistent with the morphology of M33 now. As there is also the argument that M33 may be on its first approach to M31 (van der Marel et al. 2018), we do not consider forcing by M31 an attractive explanation for the current spiral appearance of M33. If the spirals in our low-mass disc model of M33 are to have been tidally induced, they must have been forced by the very recent passage of a substantial unseen companion.
4.2.4 Conclusion on disc mass
Halving the disc mass from the value in our fiducial model did allow the disc to remain stable. The above discussion has not only stressed that the stellar M/L of this stable model is extraordinarily low, but the self-excited spirals in the disc are multi-armed, which is inconsistent with the pattern observed in the old stellar disc. We have shown that the observed spiral could not be the forced response to any reasonable visible, bar in the inner disc of M33. We have found that a transient, large-scale bi-symmetric spiral can be excited in a stable low-mass disc by a recent tidal encounter, although we argue that M31 seems a most unlikely culprit. Without extensive additional exploration, we cannot exclude the doubly speculative scenario that the disc of M33 has an extremely low M/L and the bi-symmetric spiral results from of a favourable tidal perturbation by a substantial unseen companion within the last Gyr.
Albeit with this caveat, it seems unlikely that the solution to the stability of M33 is that the disc has a lower-than-expected mass.
4.3 Stability and random motion
We successfully inhibited bar formation in our simulation by setting and doubling the disc thickness, as shown by the green line in Fig. 5. The projected velocity dispersion of the star particles near the disc centre in this case is km s-1, which is substantially larger than the observed dispersion of 25 – 35 km s-1. Note that it is possible that the measurements of the stellar velocity dispersion could be biased low (Aniyan et al. 2016, e.g.) because the brighter stars belong to a younger population having less random motion, and therefore the mass-weighted velocity spread in the disc of M33 could be larger than the reported luminosity-weighted values. Note that Kormendy & McClure 1993 were aware of this possible bias, and deliberately selected the Ca II triplet line for their measurement, as did Corbelli & Walterbos 2007, because a line in the red part of the spectrum would yield a value more representative of the older stars than would other lines.
Somewhat surprisingly, the stellar disc in this model did manifest some mild multi-arm spiral activity, which we attribute to responses to instabilities in the gas component. The surface mass density of the gas disc is substantially lower than that of the stars, causing it to prefer instabilities on a small spatial scales, as discussed above, and these disturbances seemed able to elicit a weak suporting response from the stars. However, the amplitudes of two-armed disturbances in the combined star-gas disc remained very low throughout (Fig. 5), so that this hot-stellar disc model was unable to reproduce the dominant spiral pattern in near-IR images of M33.
Thickening our disc model slightly reduces the innermost gradient of the circular speed that arises from the disc component, and allows the central halo density to be slightly larger. However, disc thickness must be supported by vertical velocity dispersion. As we discussed above, our models really should satisfy the observational constraint on the line-of-sight velocity dispersion, and therefore invoking increased vertical dispersion would require us to reduce the in-plane random velocities, although we ignored this constraint in the above test. Were we to take account ot this constraint while increasing the disc thickness to allow a slightly higher central halo density, we really should also have reduced the in-plane motions, which would have been destabilizing.
Sellwood & Merritt 1994 demonstrated that heavy discs could be globally stable when they contain two almost equal cool components of direct and counter-rotating stars, such as was found in NCC 4550 (Rubin et al. 1992; Rix et al. 1992). Unfortunately, the low surface brightness of the M33 disc creates challenges to measurements of the stellar velocity distribution and absorption-line measurements are available only very close to the nucleus of this galaxy (Kormendy & McClure 1993; Corbelli & Walterbos 2007; Kormendy et al. 2010). We therefore have little direct evidence against a possible large counter-rotating stellar population in M33. However, the existence of a regular spiral pattern seen in the NIR images is good indirect evidence that the stellar disk has significant net rotation in the same sense as the gas disc, and that counter-rotation is an unlikely explanation for the absence of a bar within the disc of M33.
4.4 More exotic ideas for stability
Milgrom 1987; Milgrom 2015 has argued that observed orbital speeds in galaxies that are higher than expected from the Newtonian attraction of the visible matter need not imply dark matter if the laws of Newtonian dynamics break down at weak accelerations. His hypothesis, known as MOND, introduces a critical acceleration scale with a value cm s-2 at which gravitational attraction transitions from the Newtonian behaviour to a slower decrease, and it has met with surprising success (Sanders & McGaugh 2002). (The radial acceleration at kpc in M33 is cm s-2.) Brada & Milgrom 1999 found that as the mean acceleration in the disc was lowered from the Newtonian to the MOND regime the instability to bar formation was reduced, until the degree of stability levelled off deep in the MOND regime. Other simulations by Tiret & Combes 2007 and Lüghausen et al. 2015 confirmed that bars still form in MOND, although the final bars are shorter and weaker than in comparable Newtonian simulations with responsive halos because bar secular growth is suppressed.33 3 I. Banik (2019, private communication) confirmed that a model of M33 computed using a MOND gravity law did form a strong bar. A different non-Newtonian gravity law, known as MOG (Moffat & Rahvar 2013), invokes a Yukawa-like law of gravitational attraction, and Roshan 2018 also found that the bar instability was weakened, but not suppressed, in simulations that employed this law. Thus neither of these hypotheses, seems able to account for the apparent stability of M33.
A rigid, unresponsive halo would be unphysical for most conventional dark matter candidates. However, axion-like particles, sometimes described as fuzzy dark matter (FDM), are increasingly being discussed as a possible dark matter candidate for a number of reasons (Hui et al. 2017, e.g.). Halos composed of such ultra-light, quantum mechanical, bosonic particles are believed to form a quasi-uniform density condensate (Marsh & Pop 2015), known as a “soliton” core, which transitions to a declining density outside the core. It is unknown whether such a halo core would behave more like a rigid mass component, but its response to rotating non-axisymmetric distortions in the disc might be expected to be very different from that of usual collisionless dark matter.
However, the soliton core is expected to be small, and the dynamical behaviour of FDM outside the core is the same as for any other collisionless DM candidate. The core radius is of order the de Broglie wavelength of the particles, and the core mass for a given mass halo is also set by the particle mass and fundamental constants. Using the virial mass of M⊙ for M33 (Kam et al. 2017) in equations (29 – 31) of Hui et al. 2017, together with their suggested mass for the FDM particle of eV, we find a soliton core mass with the half-mass radius pc. These values imply a central density for the soliton core of M⊙ pc-3, over 30 times higher than our fitted value (eq. 2), which would cause the total rotation curve to rise more steeply than is observed (Fig. 2). Since the value of eV (Schive et al. 2014b, e.g.) should be universal, the fact that the expected soliton core in M33 is too dense could present a difficulty for FDM models. Setting that concern aside, it is clear than the dynamics of an FDM halo should be similar to that of any other collisionless DM candidate at radii kpc while the bar that forms in the disc is several times larger. Thus a soliton core does not seem like a promising solution to the challenge presented by the apparent stability of M33.
5 Conclusions
The inner disc of the Local Group galaxy M33 appears to be in settled rotational balance and the old stellar distribution, as revealed in near IR images, supports a mild, bi-symmetric spiral pattern with no sign of a strong bar. The origin of the warp in the outer disc is uncertain, but even if it had been tidally induced during an encounter with M31 some 1 Gyr ago (Semczuk et al. 2018), the inner disc within kpc of the centre appears to have been little affected by the disturbance.
We have constructed a good equilibrium model of the inner parts of M33 that matches the surface mass density of the stars and gas with a dark matter halo that fits the well-observed rotation curve of the galaxy. The stellar velocity dispersion in our model matches the central value, which is the only observational constraint, and we assume and a constant disc thickness at all radii.
We have computed the evolution of this model, which carefully matches all available observational constraints, in order to determine whether it is stable. We find that it is not, and it forms a strong and persisting bar with a semi-major axis of between kpc on a time scale Gyr. We discount the possibility that the properties of the inner disc of M33 have been changed within the last Gyr, or 2.5 orbit periods, in order to cause it to be unstable today when it was stable earlier.
Further simulations have shown that the instability persists no matter what prescription we use to model the gas. Raising the mass of the nuclear star cluster or making the halo counter rotate in the opposite sense of the disc did change the evolution, but bars still formed and the final states of the simulations were inconsistent with the current observed state of the galaxy.
We succeeded in preventing a bar from forming at all in two models, and found a substantially weakened the instability in a third. Halving the stellar disc mass prevented a bar from forming entirely, but the mass-to-light ratio in solar units of the stellar disc was changed to and from the lower value preferred by Corbelli et al. 2014, and such values are well below the ranges that are believed to apply in most galaxies (Conroy 2013; Schombert et al. 2018). Increasing the random motion of the disc stars also suppressed the bar, but the random motions exceeded those observed (Kormendy & McClure 1993; Corbelli & Walterbos 2007). Replacing the responsive dark matter halo by the fixed potential of a mass distribution of the same density resulted in a shorter and weaker bar. However, all three of these “solutions” are unattractive for a different reason also: the self-excited spiral patterns that developed in the stellar component of the simulations were multi-armed, and were quite inconsistent with the lare-scale bi-symmetric pattern seen clearly in images taken in the near IR. We did obtain a transient bi-symmetric spiral response to a simplified tidal forcing of a low-mass disc model, but to argue that the current state of M33 can be explained in this way requires both an exceptionally low M/L for the stellar disc and the recent passage of a substantial unseen companion on a favourable orbit.
We discussed, but did not test, modified gravity laws and soliton cores of “fuzzy dark matter”, concluding that neither seemed to offer a promising solution to the puzzle presented by apparent stability of the inner disc of M33. We therefore conclude that the survival of the currently observed state M33 is not yet understood.
We selected M33 for this study because it is so well-observed and enables us to make the clearest possible case, but we strongly suspect that many other galaxies would present a similar challenge. It is shocking that we still do not understand how the bar instability is avoided in real galaxies, despite Hohl 1971 having first sounded the alarm about its prevalence nearly half a century ago. Our direct tests have shown that none of the ideas proposed over the subsequent years can account for the absence of a bar in M33. The lack of a satisfactory explanation is perhaps central to another outstanding issue, also noted in the opening paragraph of the introduction, of what determines the distribution of bar strengths in galaxies? These stubborn problems present still daunting challenges to galactic dynamics.
Acknowledgements
We thank John Kormendy, Claude Carignan, Hsi-Yu Schive, Justin Read, Larry Widrow, and the referee, Paolo Salucci, for comments on a draft of the paper. This work was begun during a visit by JAS to Shanghai Observatory, which was supported by Grant No. 2018VMA0051 from the Chinese Academy of Sciences President’s International Fellowship Initiative, and he also acknowledges the continuing hospitality of Steward Observatory. The paper was completed at KITP, which is supported in part by NSF grant PHY-1748958. The research presented here was partially supported by the National Key R&D Program of China under grant no. 2018YFA0404501, by the National Natural Science Foundation of China under grant nos. 11773052, 11761131016, 11333003, and by a China-Chile joint grant from CASSACA. JS acknowledges the support of a Newton Advanced Fellowship awarded by the Royal Society and the Newton Fund. This work made use of the facilities of the Center for High Performance Computing at Shanghai Astronomical Observatory.
References
- Aniyan et al. (2016) Aniyan, S., Freeman, K. C., Gerhard, O. E., Arnaboldi, M. & Flynn, C. 2016, MNRAS, 456, 1484
- Athanassoula (2002) Athanassoula, E. 2002, ApJ, 569, L83
- Athanassoula et al. (1987) Athanassoula, E., Bosma, A. & Papaioannou, S. 1987, A&A, 179, 23
- Athanassoula & Sellwood (1986) Athanassoula, E. & Sellwood, J. A. 1986, MNRAS, 221, 213
- Bauer & Widrow (2019) Bauer, J. S. & Widrow, L. M. 2019, MNRAS, 486, 523
- Berrier & Sellwood (2016) Berrier, J. C. & Sellwood, J. A. 2016, ApJ, 831, 65
- Binney & Tremaine (1987) Binney J. & Tremaine S. 1987, Galactic Dynamics (Princeton University Press, Princeton NJ) (BT08)
- Binney & Tremaine (2008) Binney J. & Tremaine S. 2008, Galactic Dynamics 2nd ed. (Princeton University Press, Princeton NJ) (BT08)
- Bosma (1996) Bosma, A. 1996, in Barred Galaxies & Circumnuclear Activity, eds. Sandqvist, Aa. & Lindblad, P. O. (Heidelberg: Springer) p 67
- Brada & Milgrom (1999) Brada, R. & Milgrom, M. 1999, ApJ, 519, 590
- Bruzual & Charlot (2003) Bruzual, G. & Charlot, S. 2003, MNRAS, 344, 1000
- Byrd & Howard (1992) Byrd, G. G. & Howard, S. 1992, AJ, 103, 1089
- Casertano (1983) Casertano, S. 1983, MNRAS, 203, 735
- Christodoulou et al. (1995) Christodoulou, D. M., Shlosman, I. & Tohline, J. E. 1995, ApJ, 443, 551
- Corbelli & Salucci (2000) Corbelli, E. & Salucci, P. 2000, MNRAS, 311, 441
- Corbelli et al. (2014) Corbelli, E., Thilker, D., Zibetti, S., Giovanardi, C. & Salucci, P. 2014, A&A, 572, A23 (C14)
- Corbelli & Walterbos (2007) Corbelli, E. & Walterbos, R. A. M. 2007, ApJ, 669, 315
- Conroy (2013) Conroy, C. 2013, ARA&A, 51, 393
- Courteau et al. (2003) Courteau, S., Andersen, D. R., Bershady, M. A., MacArthur, L. A. & Rix, H.-W. 2003, ApJ, 594, 208
- Davis et al. (2012) Davis, B. L., Berrier, J. C., Shields, D. W., et al. 2012, ApJS, 199, 33
- Debattista & Sellwood (2000) Debattista, V. P. & Sellwood, J. A. 2000, ApJ, 543, 704
- Dobbs et al. (2018) Dobbs, C. L., Pettitt, A. R., Corbelli, E. & Pringle, J. E. 2018, MNRAS, 478, 3793
- Efstathiou et al. (1982) Efstathiou, G., Lake, G. & Negroponte, J. 1982, MNRAS, 199, 1069
- Eskridge et al. (2000) Eskridge, P. B., Frogel, J. A., Pogge, R. W., et al. 2000, AJ, 119, 536.
- Freedman et al. (2001) Freedman, W. L., Madore, B. F., Gibson, B. K., et al. 2001, ApJ, 553, 47
- Hague & Wilkinson (2016) Hague, P. R. & Wilkinson, M. I. 2015, ApJ, 800, 15
- Hart et al. (2016) Hart, R. E., Bamford, S. P., Willett, K. W., et al. 2016, arXiv:1607.01019
- Hohl (1971) Hohl, F. 1971, ApJ, 168, 343
- Holley-Bockelmann et al. (2005) Holley-Bockelmann, K., Weinberg, M. & Katz, N. 2005, MNRAS, 363, 991
- Hopkins (2015) Hopkins, P. 2015, APS, APRC11003
- Hopkins et al. (2013) Hopkins, P. F., Narayanan, D. & Murray, N. 2013, MNRAS, 432, 2647
- Hopkins et al. (2017) Hopkins, P. F., Quataert, E., Faucher-Giguere, C-A., Keres, D., Wetzel, A. R. & Murray, N. W. 2017, AAS, 229, 331.01
- Hui et al. (2017) Hui, L., Ostriker, J. P., Tremaine, S. & Witten, E. 2017, Phys. Rev. D, 95, 03541
- Humphreys & Sandage (1980) Humphreys, R. M. & Sandage, A. 1980, ApJS, 44, 319
- Jarret et al. (2003) Jarrett, T. H., Chester, T., Cutri, R., Schneider, S. E. & Huchra, J. P. 2003, AJ, 125, 525
- Kalnajs (1978) Kalnajs, A. J. 1978, in IAU Symposium 77 Structure and Properties of Nearby Galaxies eds. E. M. Berkhuisjen & R. Wielebinski (Dordrecht:Reidel) p. 113
- Kam et al. (2015) Kam, Z. S., Carignan, C., Chemin, L., Amram, P. & Epinat, B. 2015, MNRAS, 449, 404
- Kam et al. (2017) Kam, S. Z., Carignan, C., Chemin, L., Foster, T., Elson, E. & Jarrett, T. H. 2017, AJ, 154, 41
- Kendall et al. (2011) Kendall, S., Kennicutt, R. C. & Clarke, C. 2011, MNRAS, 414, 538
- Kormendy et al. (2010) Kormendy, J., Drory, N., Bender, R. & Cornell, M. E. 2010, ApJ, 723, 54
- Kormendy & McClure (1993) Kormendy, J. & McClure, R. D. 1993, AJ, 105, 1793
- Kormendy & Norman (1979) Kormendy, J. & Norman, C. A. 1979, ApJ, 233, 539
- Krumholz & Gnedin (2011) Krumholz, M. R. & Gnedin, N. Y. 2011, ApJ, 729, 36
- Lewis et al. (2013) Lewis, G. F., Braun, R., McConnachie, A. W., et al. 2013 ApJ, 763, 4
- Li et al. (2015) Li, Z., Shen, J. & Kim, W.-T. 2015, ApJ, 806, 150
- Lüghausen et al. (2015) Lüghausen, F., Famaey, B. & Kroupa, P. 2015, Can. J. Phys., 93, 232
- Marsh & Pop (2015) Marsh, D. J. E. & Pop, A.-R. 2015, MNRAS, 451, 2479
- Masters et al. (2011) Masters, K. L., Nichol, R. C., Hoyle, B., et al. 2011, MNRAS, 411, 2026
- Mathewson & Ford (1996) Mathewson, D. S. & Ford, V. L. 1996, ApJS, 109, 97
- Menéndez-Delmestre et al. (2007) Menéndez-Delmestre, K., Sheth, K., Schinnerer, E., Jarrett, T. H. & Scoville, N. Z. 2007, ApJ, 657, 790
- Milgrom (1987) Milgrom, M. 1983, ApJ, 270, 365
- Milgrom (2015) Milgrom, M. 2015, Phys. Rev. D, 92, 4014
- Moffat & Rahvar (2013) Moffat, J. W. & Rahvar, S. 2013, MNRAS, 436, 1439
- Monaghan (1992) Monaghan, J. J. 1992, ARA&A, 30, 543
- Navarro et al. (1996) Navarro, J. F., Frenk, C. S. & White, S. D. M. 1996, ApJ, 462, 563
- Noguchi (1987) Noguchi, M. 1987, MNRAS, 228, 635
- Ostriker & Peebles (1973) Ostriker, J. P. & Peebles, P. J. E. 1973, ApJ, 186, 467
- Rahimi & Kawata (2012) Rahimi, A. & Kawata, D. 2012, MNRAS, 422, 2609
- Regan & Vogel (1994) Regan, M. W. & Vogel, S. N. 1994, ApJ, 434, 536
- Rix et al. (1992) Rix, H.-W, Franx M, Fisher D & Illingworth G 1992, ApJ, 400 L5
- Rogstad et al. (1976) Rogstad, D. H., Wright, M. C. H. & Lockhart, I. A. 1976, ApJ, 204, 703
- Roshan (2018) Roshan, M. 2018, ApJ, 854, 38
- Rubin (1987) Rubin, V. 1987, in “Observational Evidence of Activity in Galaxies”, IUAS 121, (Kluwer: Dordrecht) 461
- Rubin et al. (1992) Rubin, V. C., Graham, J. A. & Kenney, J. D. P. 1992, ApJ, 394 L9
- Saha & Naab (2013) Saha, K. & Naab, T. 2013, MNRAS, 434, 1287
- Saha & Elmegreen (2018) Saha, K. & Elmegreen, B. 2018, ApJ, 858, 24
- Sanders & Huntley (1976) Sanders, R. H. & Huntley, J. M. 1976, ApJ, 209, 53
- Sanders & McGaugh (2002) Sanders, R. H. & McGaugh, S. S. 2002, ARA&A, 40, 263
- Schive et al. (2014a) Schive, H-Y., Liao, M-H., Woo, T-P., Wong, S-K., Chiueh, T., Broadhurst, T. & Hwang, W.-Y. P. 2014, PhRvL, 113, 261302
- Schive et al. (2014b) Schive, H-Y., Chiueh, T. & Broadhurst, T. 2014, Nat. Ph. 10, 496
- Schombert et al. (2018) Schombert, J., McGaugh, S. & Lelli, F. 2018, arXiv:1811.10579
- Sellwood (1980) Sellwood, J. A. 1980, A&A, 89, 296
- Sellwood (1989) Sellwood, J. A. 1989, MNRAS, 238, 115
- Sellwood (2008) Sellwood, J. A. 2008, ApJ, 679, 379
- Sellwood (2013) Sellwood, J. A. 2013, in Planets Stars and Stellar Systems, v.5, eds. T. Oswalt & G. Gilmore (Heidelberg: Springer) p. 923 (arXiv:1006.4855)
- Sellwood (2014) Sellwood, J. A. 2014, arXiv:1406.6606 (on-line manual: http://www.physics.rutgers.edu/sellwood/manual.pdf)
- Sellwood (2016) Sellwood, J. A. 2016, ApJ, 819, 92
- Sellwood & Evans (2000) Sellwood, J. A. & Evans, N. W. 2001, ApJ, 546, 176
- Sellwood & Carlberg (1984) Sellwood, J. A. & Carlberg, R. G. 1984, ApJ, 282, 61
- Sellwood & Evans (2001) Sellwood, J. A. & Evans, N. W. 2001, ApJ, 546, 176
- Sellwood & Merritt (1994) Sellwood, J. A. & Merritt, D. 1994, ApJ, 425, 530
- Sellwood & Wilkinson (1993) Sellwood, J. A. & Wilkinson, A. 1993, Rep. Prog. Phys., 56, 173
- Semczuk et al. (2018) Semczuk, M., Łokas, E. L., Salomon, J.-B., Athanassoula, E. & D ’Onghia, E. 2018, ApJ, 864, 34
- Shu (1969) Shu, F. H. 1969, ApJ, 158, 505
- Springel (2010) Springel, V. 2010, MNRAS, 401, 791
- Springel & Hernquist (2003) Springel, V. & Hernquist, L. 2003, MNRAS, 339, 289
- Tiret & Combes (2007) Tiret, O. & Combes, F. 2007, A&A, 464, 517
- Toomre (1964) Toomre, A. 1964, ApJ, 139, 1217
- Toomre (1981) Toomre, A. 1981, In ”The Structure and Evolution of Normal Galaxies”, eds. S. M. Fall & D. Lynden-Bell (Cambridge, Cambridge Univ. Press) p. 111
- Toomre & Toomre (1972) Toomre, A. & Toomre, J. 1972, ApJ, 178, 623
- van Albada & Roberts (1981) van Albada, G. D. & Roberts, W. W. 1981, ApJ, 246, 740
- van der Marel et al. (2018) van der Marel, R. P., Fardal, M. A., Sohn, S. T., et al. 2018, arXiv:1805,04079
- Warner et al. (1973) Warner, P. J., Wright, M. C. H. & Baldwin, J. E. 1973, MNRAS, 163, 163
- Weinberg (1985) Weinberg, M. D. 1985, MNRAS, 213, 451
- Yu et al. (2018) Yu, S-Y., Ho, L. C., Barth, A. J. & Li, Z-Y. 2018, ApJ, 862, 13