The Synthetic ALMA Multiband Analysis of the Dust Properties
of the TW Hya Protoplanetary DiskJournal: ApJ
Abstract
Analyzing multiband observations of dust continuum emission is one of the useful tools to constrain dust properties which help us to understand the physical properties of the disks. We perform the synthetic ALMA multiband analysis to find the best ALMA band set for constraining the dust properties of the TW Hya protoplanetary disk. We find that the Band [10,6,3] set is the best set among the possible combinations of ALMA Band [3,4,5,6,7,8,9,10]. We also find two conditions for the good ALMA band sets providing narrow constraint ranges on dust properties; (1) Band 9 or 10 is included in the band set and (2) Enough frequency intervals between the bands. These are related with the conditions which give good constraints on dust properties: the combination of optically thick and thin bands are required, and large ( is the power-law index of dust opacity, ) and low dust temperature are preferable. To examine our synthetic analysis results, we apply the multiband analysis to ALMA archival data of the TW Hya disk at Band 4, 6, 7, and 9. Band [9,6,4] set provides the dust properties close to the model profile, while Band [7,6,4] set gives the dust properties deviating from the model at all radii with too broad constraint range to specify the accurate values of dust temperature, optical depth, and . Since these features are expected by the synthetic multiband analysis, we confirm that the synthetic multiband analysis is well consistent with the results derived from real data.
Keywords:
methods: observational — protoplanetary disks — stars: individual (TW Hydrae)I INTRODUCTION
With the high-resolution ALMA observation of HL Tau (ALMA Partnership et al. 2015), TW Hya has been one of the representative protoplanetary disks (PPDs) which have axisymmetric ringed structure. The central star of TW Hya is a T Tauri star with the mass of (Andrews et al. 2012). The gas-rich protoplanetary disk surrounding TW Hya has the disk mass derived from HD emission line observations by Herschel. The estimated age of the disk is (Bergin et al. 2013). Considering the typical lifetime of gaseous PPDs is (Hernández et al. 2007), the TW Hya disk is an old population. Its proximity, (Gaia Collaboration et al. 2016), provides good chance to see the detailed structure of the disk ( corresponding ). By those characteristics, the TW Hya disk is one of the important targets to study the formation of axisymmetric gap structures and the planet formation in the disks.
Recently, ALMA high spatial resolution observations have confirmed its clear multiple ring structure (Tsukagoshi et al. 2016; Andrews et al. 2016; Huang et al. 2018). This structure has been thought to be an important signpost of planet formation in the disks. Although some theoretical/numerical scenarios have been established for an individual object to explain the origins of their disk structures, there is no clear general consensus yet; (1) gravitational interaction between a protoplanet and the disk (Kanagawa et al. 2016; Dong et al. 2017; Bae et al. 2017; Fedele et al. 2018, e.g.), (2) Magneto-rotational instability (Flock et al. 2015, e.g.), (3) secular gravitational instability (Youdin 2011; Takahashi & Inutsuka 2014, e.g.), and (4) growth and destruction of dust particles near snowlines (Zhang et al. 2015; Okuzumi et al. 2016, e.g.). The origin of gap structures in the TW Hya disk is also still under debate.
Dust properties such as dust temperature , dust opacity , and dust opacity power-law index are the key parameters to distinguish the models explaining the origin of those disk structures. They are expected to behave differently in the disk structures like rings, gaps or spiral arms depending on the formation mechanism of the structures. Beckwith et al. 1990 and Beckwith & Sargent 1991 are the pioneering works to constrain and from the millimeter wavelength single-dish observations of the pre-main sequence stars in Taurus-Auriga clouds. Kitamura et al. 2002 extended this approach to the interferometer observations to additionally measure the outer radii of the disks and then estimate the dust properties. After that, some studies (Andrews & Williams 2007; Andrews et al. 2009, e.g.) made further constraints on the dust properties by comparing the theoretical models with the observed visibility data. Moreover, lots of studies (Guilloteau et al. 2011; Pérez et al. 2012; Pérez et al. 2015; Tazzari et al. 2016, e.g.) have tried to derive the radial profiles of dust properties, such as or , from the interferometric observations of various PPDs. In those works, the radial profiles of dust temperature have been mainly derived using the SED modeling and the radiative transfer calculations or a simple assumption of dust temperature profile is adopted. But the ALMA observations with high spatial resolution have made it possible to derive the temperature profiles directly from the observed intensity profiles.
As a previous research, Tsukagoshi et al. 2016 also derived the radial profiles of and from the dust continuum observations of the TW Hya disk at ALMA Band 4 and 6 with an assumed dust temperature radial profile. They made meaningful constraints on the dust properties in the disk from the deprojected azimuthally-averaged intensity profiles of dust continuum emission obtained by the high-resolution ALMA observations. However, since the uncertainty of dust size distribution and then the dust opacity, and also the structures in the disk, such as gaps opened by the planets, will affect the dust temperature profile (Jang-Condell & Turner 2012), more direct observations are necessary for better understanding of the dust properties without any assumption of the dust temperature. In order to drop the assumed dust temperature profile, and then obtain the improved radial profiles of dust properties, we need additional observations at a different frequency.
In this paper, we perform the synthetic ALMA multiband analysis to find which ALMA band set provides us good constraints on the dust properties in the TW Hya disk. And then, we apply this multiband analysis to ALMA archival data to examine whether the results derived from ALMA archival data of the TW Hya disk are consistent with our synthetic analysis. In Section II, we describe how the synthetic ALMA multiband analysis derives the dust properties. Section III describes the results of synthetic multiband analysis and the conditions required for good band sets. We will explain the dust properties derived from ALMA archival data through multiband analysis and the consistency between the synthetic results and real data in Section IV. Section V will discuss some points to improve the multiband analysis. Finally, Section VI summarizes the conclusions of our multiband analysis.
II The Synthetic ALMA Multiband Analysis
For finding which ALMA band set provides us good constraints on the dust properties of the TW Hya disk, we perform the synthetic ALMA multiband analysis. This synthetic analysis consists of two parts, setting up the model radial profiles of intensity at each ALMA band and performing sensitivity analysis for extracting the constraint ranges of synthetic dust properties corresponding to the model intensity and observational errors. We apply the synthetic multiband analysis for all the possible combinations of three ALMA bands among ALMA Band 3 to Band 10. Table 1 lists the representative frequency and frequency coverage of each ALMA band used in the synthetic multiband analysis in a unit.
| Band | 3 | 4 | 5 | 6 | 7 | 8 | 9 | 10 |
|---|---|---|---|---|---|---|---|---|
| [GHz] | 84 | 125 | 166 | 211 | 275 | 385 | 602 | 787 |
| [GHz] | 112 | 145 | 190 | 233 | 346 | 450 | 670 | 870 |
| [GHz] | 119 | 163 | 211 | 275 | 370 | 500 | 720 | 950 |
II.1 The model radial intensity profiles at each ALMA band
As a first part of the synthetic multiband analysis, we calculate the model radial intensity profiles at each ALMA band. For the calculation, we use the formal solution of the radiative transfer equation for dust continuum emission,
| (1) |
where is the Planck function at dust temperature and frequency . is the dust optical depth for which we adopt
| (2) |
by assuming the dust opacity obeys the power-law, . In this case, the spectral index of dust continuum emission can be written as
| (3) |
where Boltzmann constant and Planck constant. We note that we simply assume that the source function is , and the dust temperature and the absorption coefficient, ( is the dust density), are constant along the line-of-sight in equation (1) for simplicity.
First, we derive the frequency independent radial profiles and using Equation (1)(3) and the observed radial intensity profiles, , and spectral index, , at together with the assumption of . The observations were performed with high-resolution ( mas62.1 mas) by ALMA (Tsukagoshi et al. 2016). The profile is obtained by fitting the temperature profile at the disk midplane in Andrews et al. 2012; Andrews et al. 2016, which is derived using radiative transfer calculations. We note that the distance of TW Hya is assumed as in the previous works, but we used the updated value (Gaia Collaboration et al. 2016). Using the derived and , we calculate frequency dependent optical depth from equation (2). Then we obtain the model radial intensity profiles, , at each ALMA band using Equation (1) with the assumed and the derived .
II.2 Sensitivity analysis
After calculating the model radial intensity profiles and frequency-independent and , we perform the sensitivity analysis to extract the constraint ranges of the synthetic dust temperature , optical depth , and opacity power-law index at a given radius. To perform this analysis, we establish the parameter space of synthetic intensity at three frequencies which are picked arbitrarily among ALMA Band 3 to 10 corresponding to , , and . Then, we extract the constraint ranges of synthetic dust properties satisfying the ranges of where is the model radial intensity profile derived in Section II.1 and are observational errors which vary depending on ALMA band.
We practically obtain the constraint ranges of the synthetic dust properties , and in the following way. We pick three different ALMA bands [] among ALMA Band [3,4,5,6,7,8,9,10] as one band set. Then, at a given radius, we set which corresponds to the range of for and where the accuracy of amplitude calibration for ALMA data for Band 3, 4, 5 and 6, for Band 7 and 8, for Band 9 and 10 (Warmels et al. 2018, p.155). Next, we derive , and from , and Equations (1)-(2) with the synthetic dust temperature . And then, we estimate using , , , and Equations (1)-(2). Finally, we extract the sets of which satisfy . Performing these calculations for every radius, we obtain the minimum and maximum values of , and , which corresponds to at three frequencies as shown in Figure 2.
III The results of the synthetic ALMA multiband analysis
III.1 The synthetic multiband analysis results
We perform the synthetic ALMA multiband analysis (see Section II) for all the possible combinations of three bands among ALMA Band 3 to 10. Among total 56 possible combinations, some ALMA band sets provide us narrow constraint ranges on the radial profiles of , , and , while the others have very broad constraint ranges of the synthetic dust properties. Since the upper limit of the synthetic dust temperature () is sensitive to the observational errors in the synthetic intensities between and , as shown in Figure 2, we calculate the average normalized deviation of from for quantitative comparison. Figure 1 presents examples of the averaged normalized deviation of from within , that is, , where is the number of grids among . The bottom-left triangle shows the results for Band [10,x1,y1] sets and the top-right triangle shows those for Band [x2, y2, 3] sets, where x1=[9,8,7,6,5,4], y1=[8,7,6,5,4,3], x2=[10,9,8,7,6,5], and y2=[9,8,7,6,5,4]. According to the calculation, Band [10,6,3] set gives us deviates from in average within . It is the best band set among all the possible 56 band sets.
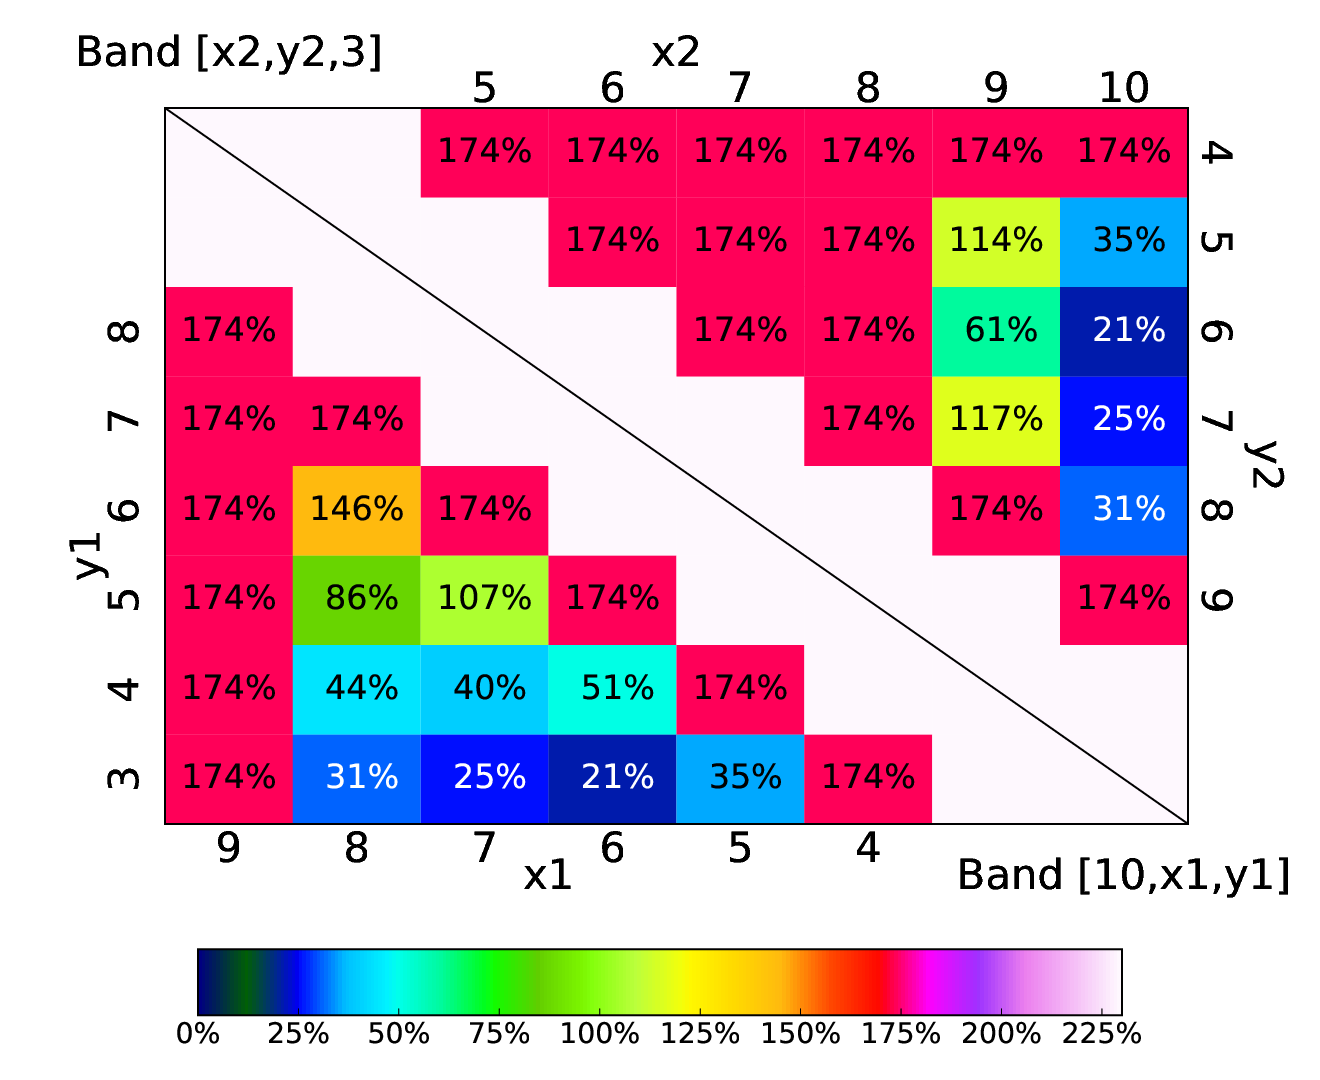


Based on the analysis in Figure 1, Figure 2 shows the constraint ranges of the synthetic dust properties of four good ALMA band sets ([10,7,3], [10,6,3], [9,7,3], [9,6,3]) and one bad ALMA band set ([7,6,3]) as examples selected from Figure 1. The constraint ranges of synthetic dust temperature (top), synthetic optical depth at Band 3 (middle), and synthetic dust opacity power-law index (bottom) derived by the synthetic multiband analysis are plotted by different color-shaded regions; yellow indicates Band [7,6,3] set, purple is [9,7,3] set, blue is [9,6,3] set, red is [10,7,3] set, and green is [10,6,3] set. The black line in each panel indicates the assumed model radial profile of and the derived model radial profile of and , respectively (see Section II.1).
In Figure 2, Band [10,6,3] set is the best set for constraining dust properties. Then, the better results are derived from the following band sets in the order of Band [10,7,3] set, [9,6,3] set, and [9,7,3] set. Including other good band sets in Figure 1, they have two common conditions.
- 1.
Band 9 or 10 is included in the band set
- 2.
Enough frequency intervals between the bands
For the minor accuracy, Band 10 has the priority for the better constraints on the dust properties than Band 9 if the other two bands in the sets are the same. We can see this tendency in Figure 1 and 2 comparing the band sets of [9,7,3] vs [10,7,3] and [9,6,3] vs [10,6,3]. In addition, even for two similar good ALMA band sets, one band set is slightly better than the other. For instance, the Band [9,6,3] set shows better constraint ranges on the synthetic dust properties than the Band [9,7,3] set due to the relatively large frequency intervals between the bands.
For the band sets which do not satisfy two conditions, the uncertainties of the synthetic dust properties become large. For instance, the band sets including Band 8 instead of Band 9 or 10 (i.e. Band [9,6,3] set vs [8,6,3] set) have broader constraint ranges of dust properties and the upper limit of dust temperature at every radius and give an error of 174% in Figure 1, even though the observational error at Band 8 () is smaller than that of Band 9 (). Meanwhile, even if Band 9 or 10 is included, in the cases that two bands among the three bands are sequential, the upper limit of the derived dust temperature becomes and gives large errors of 174% in Figure 1.
III.2 Interpretations of the synthetic analysis results
According to the results of synthetic ALMA multiband analysis, we find that the ALMA band sets including Band 9 or 10 and having enough frequency intervals between the bands provide us better constraint ranges of , , and . To understand why those conditions are necessary for good ALMA band sets, we examine the effect of each dust property to see how the behaviors of the synthetic analysis results vary by artificially changing the dust parameters.
III.2.1 effect
We analyze the behaviors of the synthetic multiband analysis results when the optical depth varies by artificially multiplying some factors to the profile (see Section II.1). Figure 3 illustrates the constraint range of derived from Band [10,7,3] set with the artificially adjusted model optical depth profile . From top-left to bottom-right panel, = 0.05, 0.2, 0.5, 2, 5, and 20. The green shaded region in all panels indicates the constraint range derived from the original as the comparison. The black solid line in all panels indicates the model profile of dust temperature .
Figure 3 shows that it becomes difficult to constrain the dust temperature when the becomes large or small. The range of provides good constraints on for Band [10,7,3] set. These behaviors can be understood by Equation (1). In the optically thick () and thin () limit, Equation (1) is approximated as
| (4) |
and
| (5) |
respectively. If the band set contains only optically thick bands, as in the case of , we are not able to constrain the optical depth, , accurately from the observed intensities because Equation (4) does not depend on . Meanwhile, if the band set contains only optically thin bands, as in the case of , it is also difficult to constrain the dust properties because the dependence of the observed intensities on the dust temperature and the optical depth are completely degenerated as is shown in Equation (5). Therefore, we can obtain better constraints on the dust properties only when the band set contains both optically thick and thin bands. That’s because optically thick bands constrain the dust temperature well as is indicated in Equation (4) and optically thin band constrains the dust optical depth as is indicated in Equation (5).


III.2.2 effect
Similarly, we examine the behavior of the synthetic analysis results with artificially adjusted profile. We derive the constraint range of the with which is at all radii where is the original model profile. Figure 4 illustrates the constraint range of derived from Band [10,7,3] set with the (red) and with the original (green). The constraint range of profile becomes much better as increases even in the inner disk, , and at the bump around .
We can interpret this behavior by the similar way described in Section III.2.1. If is large, the optical depth becomes thick at high-frequency bands and thin at low-frequency bands. Therefore, we can obtain good constraints on the dust properties from the observed intensities using Equations (1) and (2). Meanwhile, if is small, the optical depths become similar at all the bands. That is, all the bands become optically thick or thin, and then we are not able to constrain the dust properties accurately.
III.2.3 effect
In Figure 4, the blue shaded region shows the constraint range of derived with and at every radius, which reflects only the effect of the dust temperature. Meanwhile, The red shaded region contains the dependence on the dust opacity as well, for example, the errors become slightly large at the gap regions where the optical depths become small. This result shows that the error becomes larger if the dust temperature is higher. It is explained by the deviation of blackbody curves from the Rayleigh-Jeans (RJ) limit.
Figure 5 presents the blackbody curves at the dust temperature of (black), (blue), (red), and (green) represented by solid lines, respectively. The dashed linear lines indicate the formula of the RJ limit where . The grey shaded regions indicate the frequency coverage and the vertical dashed-dotted lines are the representative frequencies of each band listed in Table 1. For the very cold dust temperature (), the peak of the blackbody curves locates at the frequency regimes of ALMA Band 9 or 10. Thus, the blackbody curves largely deviate from the RJ limit at Band 9 and 10. If the deviation from the RJ limit becomes larger, the dust temperature can be constrained well from the slope of the observed intensities. This is one of the reasons why we need to include Band 9 or 10 in order to obtain better constraints on the dust properties. In addition, since the deviation from the RJ limit at Band 10 is larger than one at Band 9, Band 10 data gives more precise constraints than Band 9 data.

III.2.4 Frequency intervals between Bands
The frequency intervals between the bands of the set also affect the accuracy of the derived dust properties. Since spectral index is defined as , the error of becomes smaller when the frequency interval increases for a given . As shown in Equation (3) in Section II.1, is strongly related with the dust properties, , and , and thus we can derive the dust properties from the observed intensities. If we adopt at a certain frequency and a certain temperature, in the optically thick limit, which corresponds to Equation (4). In the optically thin limit, , which corresponds to Equation (5). We note that in the RJ limit. Therefore, the error of directly affects the constraints on the dust properties. Due to this effect, we need large frequency intervals between Bands for the good ALMA band sets to reduce the error of .
In principle, this interpretation suggests that we can extend this analysis to the longer or shorter wavelengths beyond the ALMA to obtain larger frequency intervals between the data. However, we should be cautious about the differences in spatial resolution and sensitivity when we combine the data observed by different telescopes. For example, VLA is another good instrument to obtain longer wavelength data but the spatial resolution and sensitivity may not be comparable to ALMA data.
III.3 The generalization of the synthetic multiband analysis
We investigate the physical reasons of two conditions for the good ALMA band sets in Section III.2. Here, we apply the synthetic multiband analysis to more generalized cases adding Monte-Carlo (MC) method to mimic the observations, not restricted on the TW Hya disk. To do this analysis, we focus on the ALMA Band [10,6,3] set for minimizing the loss of the generated random data because it is the best one in the synthetic multiband analysis.
III.3.1 The degeneracy of [, , ]
The interpretations investigated in Section III.2 infer that the dust properties have degeneracy on the multiband analysis. First, to examine their degeneracy on the synthetic multiband analysis, we survey the parameter space by Monte-Carlo method for a certain combination of the model dust properties, [, , ]. To do this parameter survey, we calculate the model intensities at ALMA Band 10, 6 and 3 corresponding to the model dust properties using Equation (1) and (2) in Section II.1. Then, we generate 1000 combinations of the synthetic intensity with the random errors within for Band 6 and 3 and for Band 10. And we derive the dust properties using the multiband analysis.
Figure 6 presents 3-dimensional (3D) scatter plot of the derived [, , ] and 2-dimensional (2D) scatter plots projected to each axis for examining their degeneracy. The 827 points are plotted from 1000 combinations of the randomly generated synthetic intensities for [,,]=[20 , 0.5, 1.5]. Since some intensity combinations don’t have the solutions, we lose some portion of them. The red points in 2D scatter plots indicate this model value. With these conditions, the black points are concentrated in a diagonal line in the 3D scatter plot of Figure 6. The 2D scatter plots of Figure 6 show the projected correlation between dust properties. The blue ellipses in 2D scatter plots indicate the confidence ellipse which contains of the plotted points. They indicate the correlation direction and their strength. Based on it, we confirm has negative correlations to and and has the strongest correlation. We can understand this trend as follows. By Equation (1) in Section II.1, should be smaller to cancel out the increment of as increases for given intensities. At the same time, when becomes higher, the deviation from RJ limit gets smaller (see Section III.2.3). To match the observed spectral index of intensities at three ALMA bands, should be smaller to cancel out the effect of variations. Thus, and have a positive correlation.
III.3.2 The synthetic analysis for general disk conditions
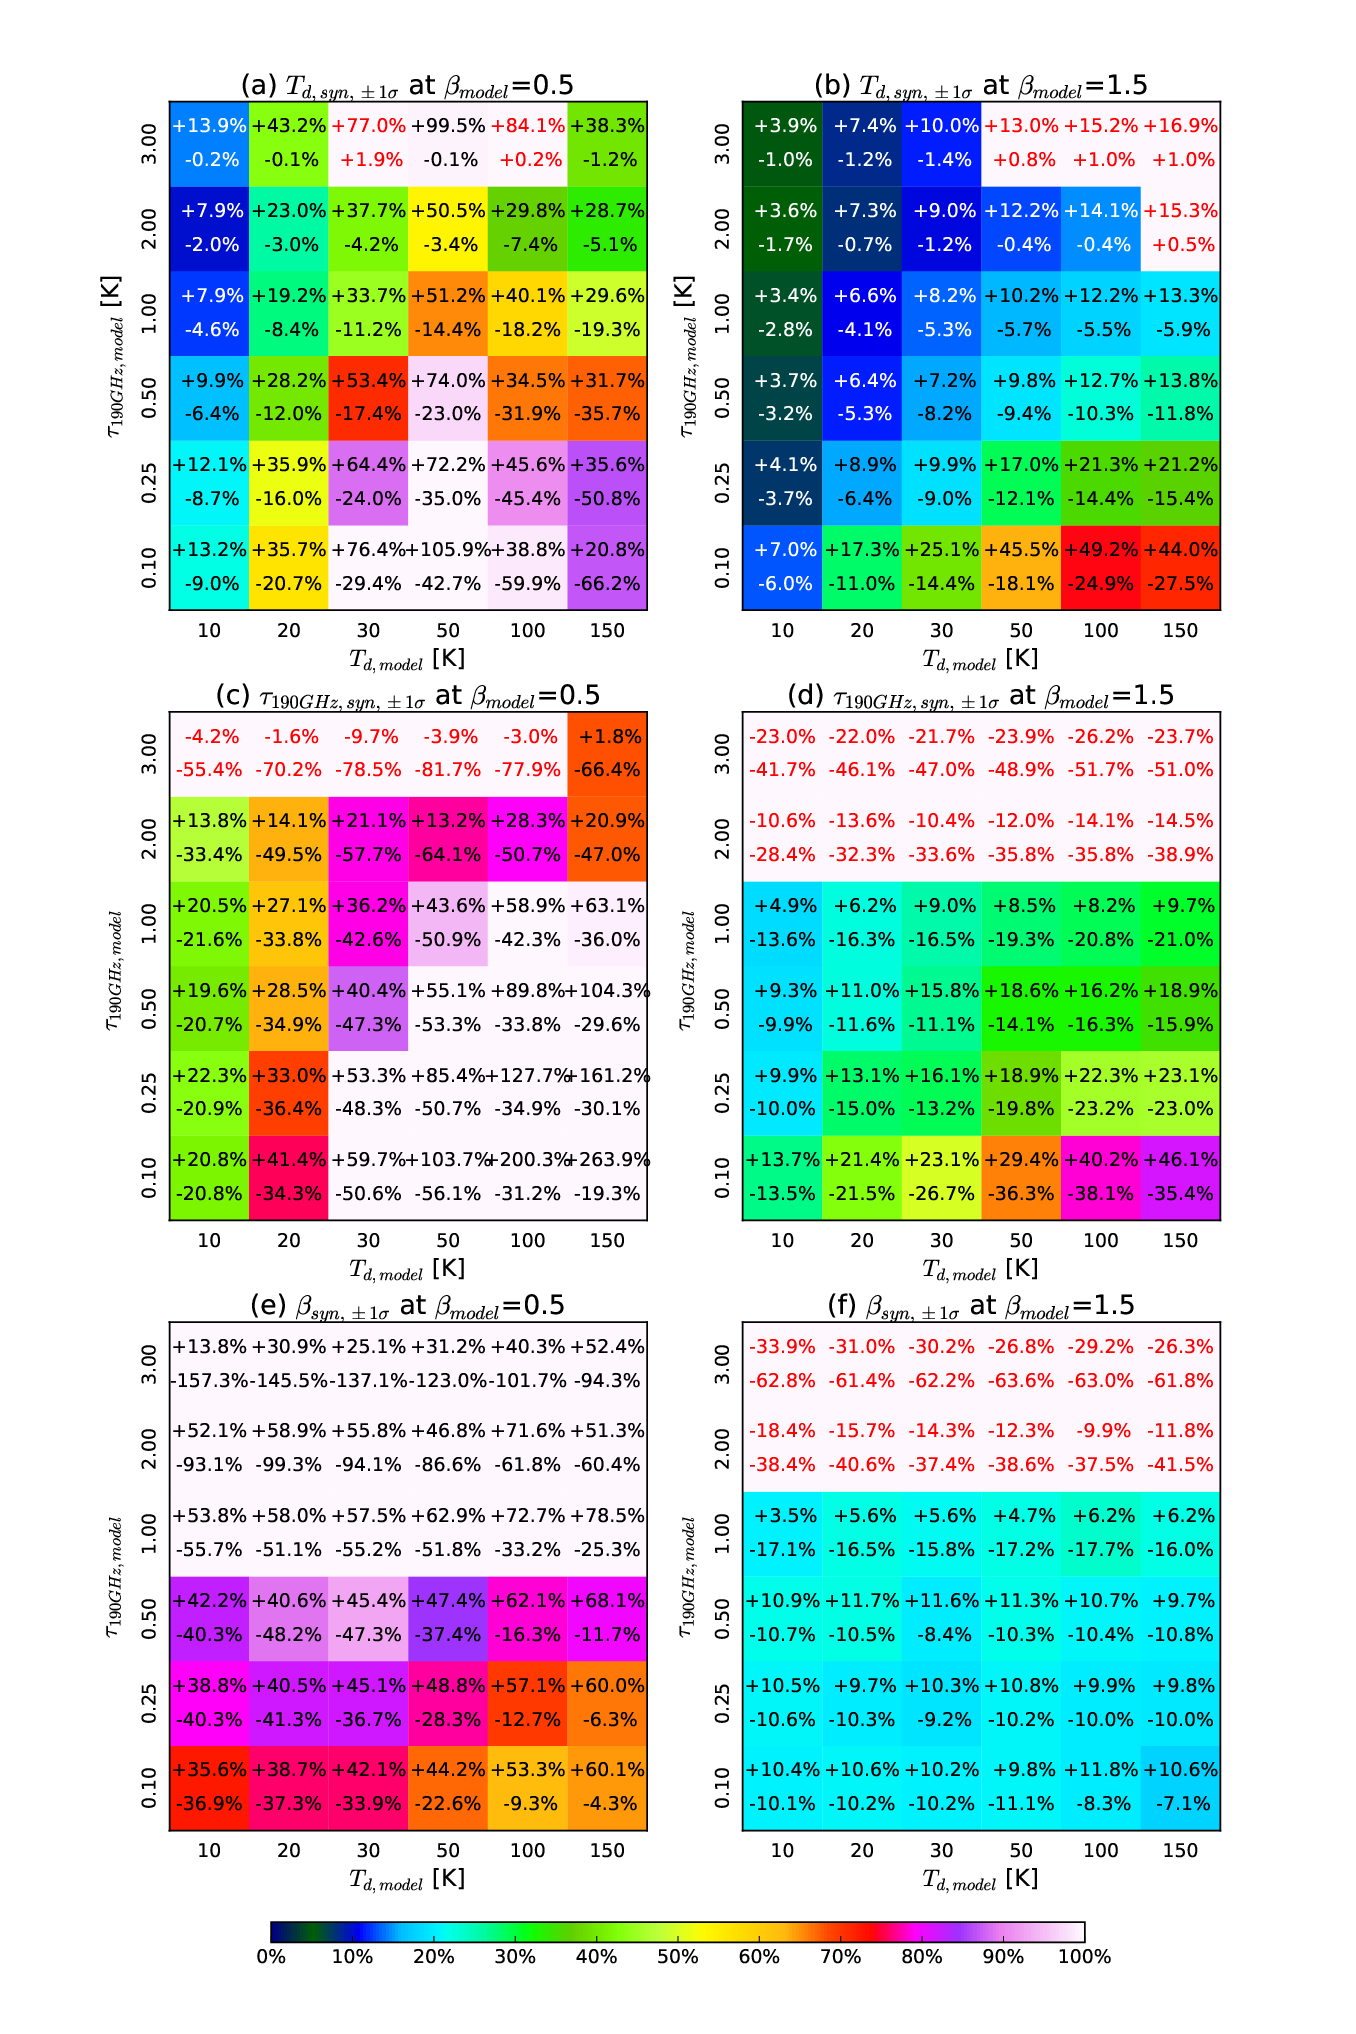
Next, by changing the model values, we examine the applicability of the multiband analysis to various situations. We set some representative model dust properties as =[10, 20, 30, 50, 100, 150], =[0.1, 0.25, 0.5, 1.0, 2.0, 3.0], and =[0.5, 1.5]. Those parameters cover a wide range of possible disk conditions, from cold () to hot (), from optically thin () to thick (), and with small grains (, ) and large grains (, ) (Draine 2006, e.g.).
We perform the same calculation applied to Figure 6 for various combinations of the model values. Then, we make the occurrence histogram of the derived , , and , and then pick their values (the values at from the mean values of all the derived points of dust properties), , for example. Figure 7 summarizes the normalized values of the derived dust properties from the model values, that is, , for example. The normalized (top row), (middle row), and (bottom row) are shown for a certain set of [,,] in each block where x-axis shows and y-axis shows . and 1.5 are used for the figures in the left and right columns, respectively. The numbers in the upper and lower parts in each block show the normalized deviation of the and values, respectively. We note that the red numbers indicate the cases in which the model value is not included in range, that is, the model value is not well reproduced by the multiband analysis. It occurs when large errors exist in the derived dust properties, for example, in the case of large . The background colors indicate the total width between values normalized by the model value, that is, where is , , or . For example, in Figure 7 (a), for the model values are [,,]=[20 , 1.0, 1.5], () and (). Therefore, the normalized total width is 10.7%.
According to the results, we obtain good constraints on dust properties with low , intermediate , and high . This is consistent with the interpretations in Section III.2. In addition, and have more strict ranges for good constraints than . That is, making the combination of optically thick and thin bands is the primary factor for good band sets. For , it is a situation that Band 10, 6 and 3 are all optically thick which is not suitable for the multiband analysis. Due to the degeneracy on and in Equation (1), the derived constraints on dust properties are not able to reproduce the model values.


IV Applications of the multiband analysis to ALMA archival data
In Section III, we present the synthetic multiband analysis results and find two conditions for the good ALMA band sets deriving accurate constraints on the dust properties. In this section, we apply the multiband analysis to ALMA archival dust continuum data of the TW Hya protoplanetary disk at Band 4, 6, 7, and 9 in order to derive the dust properties and to examine whether our synthetic multiband analysis results are consistent with the real observational data.
Tsukagoshi et al. 2016 and Andrews et al. 2016 reported the high spatial resolution dust continuum images of the TW Hya disk at Band 4, 6 and 7. We use Band 4 and 6 data in Tsukagoshi et al. 2016 and Band 7 fits image at Sean Andrews’s science homepage11 1 https://www.cfa.harvard.edu/ sandrews/data/twhya/. In the ALMA archive, we also find Band 9 observation of the TW Hya disk (Schwarz et al. 2016) which is low spatial resolution data. We retrieved this data from JVO portal22 2 http://jvo.nao.ac.jp/portal/alma/archive.do operated by the NAOJ. We summarize the beam size and 1 noise level of those archival data in Table 2. We make two ALMA band sets, Band [7,6,4] set as high-resolution data and Band [9,6,4] set as low-resolution data.
| Band | Beam size | PA | 1 level | |
|---|---|---|---|---|
| [GHz] | [masmas] | [∘] | [mJy/beam] | |
| 4 | 145 | 88.162.1 | 57.8 | 0.0124 |
| 6 | 233 | 75.455.2 | 38.0 | 0.0287 |
| 7 | 346 | 2418 | 78 | 0.0350 |
| 9 | 661 | 434247 | -85.8 | 10 |
For the consistent analysis, we match the beam size of the continuum images in each set using command in CASA. We match the beam size of mas for Band [7,6,4] set and mas for Band [9,6,4] set. After matching the beam size, we extract the azimuthally-averaged de-projected radial intensity profiles. Figure 8 (a) presents the azimuthally-averaged de-projected radial intensity profiles by the different colors; black for Band 4, blue for Band 6, green for Band 7, red for Band 9, and magenta for the intensity profile at 190 obtained by the Multi-Frequency Synthesis (MFS) method from Band 4 and 6 (Tsukagoshi et al. 2016). The solid lines indicate the radial profiles of high-resolution ( mas) data and the dashed lines indicate the profiles of low-resolution ( mas) data. Figure 8 (b) presents the brightness temperatures derived from the radial intensity profiles in Figure 8 (a).
IV.1 Application to Band [7,6,4] set
We apply the multiband analysis to the azimuthally-averaged de-projected radial intensity profiles of Band [7,6,4] set. The dust properties are derived from the intensity at Band 7 (346 ) and the intensity and spectral index at 190 obtained by the MFS method from Band 4 and 6 data. The radial profiles of , , and derived from Band [7,6,4] set are shown in Figure 9 (a) as blue dotted lines. These dotted lines are used as the model profiles to derive the blue shaded region which indicates the constraint range of the derived dust properties corresponding to the observational errors for Band 4 and 6 and for Band 7. The black solid line in each panel indicates the model profiles of the dust properties. The profile is derived from the profile by convolution to mas circular beam, which is the mean value of mas. The frequency independent model profiles and are derived using the convolved by the same method mentioned in Section II.1.
In the top panel, the dotted lines are lower than the model profile, at , with a strange bump around . The bump seems to appear because the uncertainty becomes large around due to small as is shown in Section III.2.2. The derived optical depth at Band 4 radial profile, , is close to the model profile, especially at , including the shallow drop at the gap locations, and . The derived values at are in range and optically thin. The derived profile is also similar to the model profile, especially at , but the enhancement at the inner gap location () is larger than the model. At where , the deviation becomes very large. These shifts of the dust properties are consistent with the degeneracy described in Section III.3.1.
In the inner disk, , the dust properties are not able to be estimated by the multiband analysis. In this region, the brightness temperatures of Band 4 and 6 are higher than that of Band 7 (see Figure 8 (b)). When the images are convolved with the beam mas, this inversion of the brightness temperature disappears. One possible cause of it is a significant phase noise of Band 7. Since phase noise makes a positional offset, the resultant image has been blurred and the peak intensity becomes smaller.
According to the interpretation of the synthetic multiband analysis, Band [7,6,4] set is not a good band set because it does not satisfy two conditions for the good ALMA band sets. The , and profiles derived from Band [7,6,4] set seem to be affected by the errors in the observations, which is consistent with our synthetic analysis results in Section III. Also, the constraint range of derived from Band [7,6,4] set is too broad to specify the dust temperature at every radius. The constraint ranges of and profiles also have relatively large uncertainties at all radius.
IV.2 Application to Band [9,6,4] set
We apply the same method to the low-resolution dust continuum data of the TW Hya disk, Band [9,6,4] set. The dust properties are derived from the intensity at Band 9 (661 ) and the beam-convolved intensity and spectral index at 190 obtained by MFS method from Band 4 and 6 data. We derive the radial profiles of , , and from those smoothed radial intensity profiles presented by the dashed lines in Figure 8 (a).
The derived , , and radial profiles are shown in Figure 9 (b) as red dotted lines. The format of the plots are the same as Figure 9 (a). The profile is derived from convolved with mas circular beam, which is the mean value of mas. The and profiles are derived using this convolved profile by the same method described in Section II.1.
The derived profile from Band [9,6,4] set follows the model profile well having in region. Similarly, the derived and profiles are also very close to the model and profiles. Meanwhile, the derived dust properties deviate from the model in the outer disk, , probably due to the rapid drop of (see Section III.2.2). The rapid drop of seems to be affected by the drop of at 190 , which is obtained by the MFS method, at where the Signal-to-Noise ratios of the observed intensities become small. By the beam convolution, this effect can be extended to the region.
We derived red shaded regions based on the red dotted lines as the model profiles of the dust properties. The red shaded regions in each panel indicate the constraint ranges of the derived dust properties corresponding to the observational errors for Band 4 and 6 and for Band 9. While the constraint range of is still too broad at all radii, it has relatively narrow constraint range of and profiles than the ranges derived from Band [7,6,4] set. It is because that Band [9,6,4] set satisfies two conditions for the good band sets; It contains Band 9 in the band set and the frequency intervals between the bands are large. Thus, we confirm that the results derived from the archival Band [9,6,4] set seems less affected by the observational errors than those derived from Band [7,6,4] set, which is consistent with our synthetic analysis results in Section III.
The radial profiles of the derived dust properties are smooth because the bump at and the drop of and enhancement of at the gap locations ( and ) are smoothed out. It is because of the large difference in the beam sizes between Band 9 and the others. To check whether those small-scale structures are smoothed out by the large beam size, we derive the dust properties from the smoothed radial intensity profiles at Band [7,6,4] set at beam size. Figure 9 (c) presents the radial profiles of the dust properties derived from the smoothed radial intensity profiles at Band [7,6,4] set as green dotted lines. The derived profile has no bump around . The and profiles also have no structure at the gap location (). It infers that the small-scale structures in the disk are smoothed out by the large beam size. Therefore, we need a high spatial resolution observation at Band 9 for constraining the dust properties in the gap structures of the TW Hya disk.
V Discussion
In Section IV, we describe the dust properties derived from the ALMA archival dust continuum images at Band 4, 6, 7, and 9. The results derived from the archival data are well consistent with the synthetic multiband analysis. In this section, we will discuss some points to improve our multiband analysis in the future.
V.1 The vertical structure of the disk
In the processes of the synthetic multiband analysis, we assume the homogeneous vertical structure of the disk. However, according to model calculations, protoplanetary disks have gradients in the vertical temperature and density structure (Chiang & Goldreich 1997; Dullemond et al. 2002; Inoue et al. 2009, e.g.). Furthermore, observationally, Teague et al. 2018 has reported that the gas temperature in the inner region () of the TW Hya disk derived from multiple transition lines of CS molecule. Similarly, Loomis et al. 2018 also derive the rotational temperature from multiple transition lines of CH3CN molecule in the TW Hya disk. Since those molecular lines are emitted from the upper layer or surface of the disk, they indicate the vertical structure can exist in the TW Hya disk.
If the dust continuum emission is optically thin, the emission is the result of integration throughout the vertical direction of the disk, and mainly traces the disk midplane since dust grains are concentrated near the midplane by settling. Therefore, the assumption of homogeneous vertical structure would not affect the result very much. Meanwhile, if the dust continuum emission is optically thick, we need to be more careful about the vertical structure. Now, the dust opacity generally increases with frequency. That is, if the column density is high enough, the dust continuum emission at different frequencies becomes optically thick at different layers in the vertical direction of the disk. In this case, the assumption of the homogeneous vertical structure of dust temperature could affect the result of the synthetic analysis.
If the irradiation from the central star is the dominant heating source, the dust temperature increases along the vertical direction. Figure 2 of Inoue et al. 2009 shows the temperature profile as a function of the optical depth in the vertical direction of the disk, indicating that in the region where the Planck mean optical depth with the stellar effective temperature () is larger than one, the temperature is almost constant in the vertical direction, although it depends on the dust model. Now, the optical depths at the ALMA Bands are times smaller than the Planck mean optical depth at a given , depending on the dust size (Miyake & Nakagawa 1993, e.g.). For example, the optical depths at ALMA Band 3 () and Band 10 () are and respectively, where the Planck mean optical depth at becomes unity () if we adopt the dust model with the dust size of . Thus, the dust temperature is nearly constant in the region where the dust emission becomes optically thick at the ALMA Bands and it could be reasonable to assume that the effect of the dust temperature gradient on the synthetic analysis is not very large in this case.
Meanwhile, if the viscous heating is dominant, the dust temperature increases near the midplane. In this case, the temperature gradient could affect the result of the synthetic analysis more significantly. According to model calculations (D’Alessio et al. 1998, e.g.), the viscous heating will be dominant only in the inner region () if the accretion rate is small (). The viscous heating becomes dominant in the outer disk for larger accretion rates (Dullemond et al. 2007, e.g.).
The inclination angle of the disks could also affect the result. If the disk is almost edge-on, the dust continuum emission becomes optically thick and the assumption of a homogeneous structure along the line-of-sight is no more valid. However, in the case of the TW Hya disk, the inclination angle is small (Qi et al. 2008, ,) and the line-of-sight direction is not very different from the vertical direction of the disk. Thus, additional observations at different frequencies will help us to constrain the dust properties when they have non-uniform structure along the line-of-sight.
V.2 The frequency dependency of
We assume the dust opacity is proportional to the frequency as where is independent of the frequency for the ALMA multiband analysis. This power-law index is strongly related to the dust grain models in the disks; the dust size distribution, the maximum/minimum size of the grains, the internal structure of the grains, and the composition of the grains. Thus, we can infer the dust properties in protoplanetary disks by comparing the observed with the theoretical/experimental derived from different conditions (Beckwith et al. 2000, e.g.). of the grains in the interstellar clouds is observationally measured as . Meanwhile, many observations of protoplanetary disks show (Beckwith & Sargent 1991, e.g.), and recent spatially resolved observations show is smaller in the inner region of the disks (Pérez et al. 2012; Tsukagoshi et al. 2016, e.g.), suggesting further grain growth close to the central stars. It is consistent with grain growth theory which leads to planet formation (Armitage 2010, e.g.).
Theoretical/Experimental studies of dust opacity suggests that can vary with the frequency, depending on dust properties, such as dust temperature, grain size distribution and composition (Miyake & Nakagawa 1993; Mennella et al. 1998; Chihara et al. 2002; Draine 2006; Koike et al. 2006; Min et al. 2016; Woitke et al. 2016, e.g.). Demyk et al. 2017a; Demyk et al. 2017b recently reported the variations of on the frequencies by experimental measurements for the particles with the different dust temperatures () and chemical compositions (Mg-rich or Fe-rich amorphous silicates). They suggest that the anti-correlates with at a given frequency for due to the additional absorption processes of the grains. They also find the complex variations at for the different and compositions.
Despite those theoretical/experimental studies on with the dust grain models, it is difficult to fully understand the frequency dependence of of actual grains in protoplanetary disks. Therefore, we simply assumed frequency independent in this work. However, we need to be cautious that can vary depending on the frequency. In this case, we need additional observations at different frequencies in order to constrain the dust properties.
V.3 Extension to ALMA Band 1
We find that frequency intervals between the bands should be large enough for better constraints on the dust properties through the multiband analysis. It infers that we can constrain better dust properties if we add lower frequency band instead of Band 3 () in the band sets. Since ALMA Band 1 receiver is developing now (Huang et al. 2016), we perform the synthetic multiband analysis to the band sets including Band 1 () in order to check the applicability of multiband analysis.
Figure 10 presents the constraint ranges of synthetic dust properties, , , and , derived from five band sets including Band 1. The constraint ranges of dust properties derived from different band sets are represented by different colors; yellow for Band [9,7,1] set, purple for [9,6,1], blue for [10,7,1], red for [10,6,1], and green for [10,5,1]. The black solid lines are the model profiles of , , and derived by the same method described in Section II.1.
The constraint ranges of are better than the ones derived from the band sets including Band 3, such as Band [10,6,3] set. Similarly, the constraint ranges of and become much better than ones in Figure 2 as well. We calculate the same value as in Figure 1 for the band sets with ALMA Band 1 to estimate how Band 1 improve the constraint range. Figure 11 presents the averaged normalized deviation of (left), (middle), and (right) from the model values for Band [x2,y2,1] sets (top-right) comparing to Band [x1,y1,3] sets (bottom-left). The deviation of for Band [10,6,1] set is 10%, which is twice better than the deviation for Band [10,6,3] set (21%). Furthermore, we have more options on band sets having 20% accuracy on the constraints on dust properties, such as Band [10,8,1], [10,7,1], [10,5,1], [10,4,1], [9,6,1], and [9,5,1] sets. Since including Band 1 observation makes larger frequency intervals between the bands than Band 3, the dust properties are accurately constrained by the multiband analysis. Thus, we conclude that Band 1 observations will improve the constraints on the dust properties derived by the multiband analysis.


VI Summary
In this paper, we try to constrain the radial profiles of dust temperature , optical depth and the dust opacity power-law index in the TW Hya protoplanetary disk using the ALMA multiband analysis. To find which ALMA band set provides the best constraints on the dust properties, we perform the synthetic ALMA multiband analysis to all the possible combinations of three ALMA bands among Band 3 to 10 reflecting observational errors for Band 3, 4, 5, and 6, errors for Band 7 and 8, and errors for Band 9 and 10.
According to the synthetic multiband analysis results, Band [10,6,3] set gives us the best constraints of , , and profiles. In addition, we find two conditions for the good ALMA band sets;
- 1.
Band 9 or 10 should be included in the band set
- 2.
The frequency intervals between the bands are large enough
We examine the effect of each dust parameter on the synthetic multiband analysis results to understand why those conditions are required for the good ALMA band sets. We find that the combination of an optically thick band for the accurate estimation and optically thin band for the accurate estimation is essential for the good constraints on the dust properties. We also find that large leads better constraints on the dust properties. When becomes larger, the high-frequency band becomes optically thick and low-frequency band becomes optically thin. Therefore, we can obtain the combination of optically thick and optically thin band. The blackbody curves at low dust temperature deviate from the Rayleigh-Jeans (RJ) limit at high frequency. Band 9 or 10 has an advantage on the estimation due to the large deviation of the blackbody curves from RJ limit. In addition, the large frequency intervals between the bands reduce the error of spectral index . Accurate measurement of leads to good constraints on the dust properties, , and . We also examine the possibility to apply the multiband analysis to various disk conditions using the Monte-Carlo method. For various model dust properties, we obtain good constraint on dust properties with low , intermediate and high . That is, we can apply the multiband analysis to not only the TW Hya disk but the general protoplanetary disks.
To check the synthetic multiband analysis is consistent with the observational data, we apply the multiband analysis to the ALMA archival data of the TW Hya disk at Band 4, 6, 7 and 9. First, we apply the multiband analysis to the high-resolution dust continuum images at Band 7, 6, and 4. The derived profile is smaller than the profile and has a bump around which is probably caused by the large uncertainty on constraint range due to the drop at the same location. The constraint range of corresponding to the observational errors derived from the Band [7,6,4] set is too broad to specify value at every radius. The derived and profiles follow the small-scale structures of the model profiles, especially , but the constraint ranges corresponding to the observational errors are broad like the constraint range. It is consistent with the synthetic multiband analysis result that the dust properties derived from Band [7,6,4] data are sensitive to the observational errors.
We also apply the same analysis to the low-resolution ALMA Band 9 data with the smoothed Band 6 and 4 data. The derived profile shows a smooth profile close to the model profile in . The derived and profiles also follow the model profiles very well in the same region. Although the constraint range of corresponding to the observational errors derived from Band [9,6,4] set is still broad to specify the accurate values, the constraint ranges of and become narrower than the ranges derived from Band [7,6,4] set. It is consistent with the synthetic multiband analysis result that the dust properties derived from Band [9,6,4] data are less affected by the observational errors than those derived from Band [7,6,4] data because Band [9,6,4] set satisfies the two conditions for the good band sets. Unfortunately, the large beam size of Band 9 smoothes out the small-scale structures in the radial profiles of the dust properties during the convolution process of the images. Therefore, we need observations with a high spatial resolution dust continuum observation at Band 9 or 10 to figure out the dust properties in the gap structures at and in the TW Hya disk.
The multiband analysis is a good way to constrain the dust properties in the protoplanetary disks from the observational data. However, we still have some points to improve the multiband analysis. First, we assume the vertical structure of the disk is homogeneous in the calculation but the disks actually have the gradient of temperature and density profiles along the vertical direction. We need to consider those vertical disk structures to obtain better constraints of the dust properties. Another point is that the frequency dependence of is not taken into account in the calculation while the theoretical/experimental researches have reported the possible dependence of on the frequency and temperature. Thus, we should be cautious that could depend on the frequency. We will need more than three bands to constrain the dust properties if the vertical structure of the dust properties is significant and/or has a strong dependence on the frequency.
References
- ALMA Partnership et al. (2015) ALMA Partnership, Brogan, C. L., Pérez, L. M., et al. 2015, ApJ, 808, L3
- Andrews & Williams (2007) Andrews, S. M., & Williams, J. P. 2007, ApJ, 659, 705
- Andrews et al. (2009) Andrews, S. M., Wilner, D. J., Hughes, A. M., Qi, C., & Dullemond, C. P. 2009, ApJ, 700, 1502
- Andrews et al. (2012) Andrews, S. M., Wilner, D. J., Hughes, A. M., et al. 2012, ApJ, 744, 162
- Andrews et al. (2016) Andrews, S. M., Wilner, D. J., Zhu, Z., et al. 2016, ApJ, 820, L40
- Armitage (2010) Armitage, P. J. 2010, Astrophysics of Planet Formation (Cambridge)
- Bae et al. (2017) Bae, J., Zhu, Z., & Hartmann, L. 2017, ApJ, 850, 201
- Beckwith et al. (2000) Beckwith, S. V. W., Henning, T., & Nakagawa, Y. 2000, Protostars and Planets IV, 533
- Beckwith & Sargent (1991) Beckwith, S. V. W., & Sargent, A. I. 1991, ApJ, 381, 250
- Beckwith et al. (1990) Beckwith, S. V. W., Sargent, A. I., Chini, R. S., & Guesten, R. 1990, AJ, 99, 924
- Bergin et al. (2013) Bergin, E. A., Cleeves, L. I., Gorti, U., et al. 2013, Nature, 493, 644
- Chiang & Goldreich (1997) Chiang, E. I., & Goldreich, P. 1997, ApJ, 490, 368
- Chihara et al. (2002) Chihara, H., Koike, C., Tsuchiyama, A., Tachibana, S., & Sakamoto, D. 2002, A&A, 391, 267
- D’Alessio et al. (1998) D’Alessio, P., Cantö, J., Calvet, N., & Lizano, S. 1998, ApJ, 500, 411
- Demyk et al. (2017a) Demyk, K., Meny, C., Lu, X.-H., et al. 2017a, A&A, 600, A123
- Demyk et al. (2017b) Demyk, K., Meny, C., Leroux, H., et al. 2017b, A&A, 606, A50
- Dong et al. (2017) Dong, R., Li, S., Chiang, E., & Li, H. 2017, ApJ, 843, 127
- Draine (2006) Draine, B. T. 2006, ApJ, 636, 1114
- Dullemond et al. (2007) Dullemond, C. P., Hollenbach, D., Kamp, I., & D’Alessio, P. 2007, Protostars and Planets V, 555
- Dullemond et al. (2002) Dullemond, C. P., van Zadelhoff, G. J., & Natta, A. 2002, A&A, 389, 464
- Fedele et al. (2018) Fedele, D., Tazzari, M., Booth, R., et al. 2018, A&A, 610, A24
- Flock et al. (2015) Flock, M., Ruge, J. P., Dzyurkevich, N., et al. 2015, A&A, 574, A68
- Gaia Collaboration et al. (2016) Gaia Collaboration, Brown, A. G. A., Vallenari, A., et al. 2016, A&A, 595, A2
- Guilloteau et al. (2011) Guilloteau, S., Dutrey, A., Piétu, V., & Boehler, Y. 2011, A&A, 529, A105
- Hernández et al. (2007) Hernández, J., Hartmann, L., Megeath, T., et al. 2007, ApJ, 662, 1067
- Huang et al. (2018) Huang, J., Andrews, S. M., Cleeves, L. I., et al. 2018, ApJ, 852, 122
- Huang et al. (2016) Huang, Y. D. ., Morata, O., Koch, P. M., et al. 2016, in , 99111V
- Inoue et al. (2009) Inoue, A. K., Oka, A., & Nakamoto, T. 2009, MNRAS, 393, 1377
- Jang-Condell & Turner (2012) Jang-Condell, H., & Turner, N. J. 2012, ApJ, 749, 153
- Kanagawa et al. (2016) Kanagawa, K. D., Muto, T., Tanaka, H., et al. 2016, PASJ, 68, 43
- Kitamura et al. (2002) Kitamura, Y., Momose, M., Yokogawa, S., et al. 2002, ApJ, 581, 357
- Koike et al. (2006) Koike, C., Mutschke, H., Suto, H., et al. 2006, A&A, 449, 583
- Loomis et al. (2018) Loomis, R. A., Cleeves, L. I., Öberg, K. I., et al. 2018, ApJ, 859, 131
- Mennella et al. (1998) Mennella, V., Brucato, J. R., Colangeli, L., et al. 1998, ApJ, 496, 1058
- Min et al. (2016) Min, M., Rab, C., Woitke, P., Dominik, C., & Ménard, F. 2016, A&A, 585, A13
- Miyake & Nakagawa (1993) Miyake, K., & Nakagawa, Y. 1993, Icarus, 106, 20
- Okuzumi et al. (2016) Okuzumi, S., Momose, M., Sirono, S.-i., Kobayashi, H., & Tanaka, H. 2016, ApJ, 821, 82
- Pérez et al. (2012) Pérez, L. M., Carpenter, J. M., Chandler, C. J., et al. 2012, ApJ, 760, L17
- Pérez et al. (2015) Pérez, L. M., Chandler, C. J., Isella, A., et al. 2015, ApJ, 813, 41
- Qi et al. (2008) Qi, C., Wilner, D. J., Aikawa, Y., Blake, G. A., & Hogerheijde, M. R. 2008, ApJ, 681, 1396
- Schwarz et al. (2016) Schwarz, K. R., Bergin, E. A., Cleeves, L. I., et al. 2016, ApJ, 823, 91
- Takahashi & Inutsuka (2014) Takahashi, S. Z., & Inutsuka, S.-i. 2014, ApJ, 794, 55
- Tazzari et al. (2016) Tazzari, M., Testi, L., Ercolano, B., et al. 2016, A&A, 588, A53
- Teague et al. (2018) Teague, R., Henning, T., Guilloteau, S., et al. 2018, ArXiv e-prints, arXiv:1808.01768
- Tsukagoshi et al. (2016) Tsukagoshi, T., Nomura, H., Muto, T., et al. 2016, ApJ, 829, L35
- Warmels et al. (2018) Warmels, R., Biggs, A., Cortes, P. A., et al. 2018, ALMA Technical Handbook, ALMA Doc. 6.3, Ver. 1.0
- Woitke et al. (2016) Woitke, P., Min, M., Pinte, C., et al. 2016, A&A, 586, A103
- Youdin (2011) Youdin, A. N. 2011, ApJ, 731, 99
- Zhang et al. (2015) Zhang, K., Blake, G. A., & Bergin, E. A. 2015, ApJ, 806, L7