Bayesian Analysis on the X-ray Spectra of the Binary Neutron Star Merger GW170817
Abstract
For the first time, we present a Bayesian time-resolved spectral study of the X-ray afterglow datasets of GW170817/GRB17017A observed by the Chandra X-ray Observatory. These include all 12 public datasets, from the earliest observation taken at d to the newest observation at d post-merger. While our results are consistent with the other works using Cash statistic within uncertainty, the Bayesian analysis we performed in this work have yielded Gaussian-like parameter distributions. We also obtained the parameter uncertainties directly from their posterior probability distributions. We are able to confirm that the power-law photon index has remained constant of throughout the entire year-long observing period, except for the first dataset observed at d when is marginally harder. We also found that the unabsorbed X-ray flux peaked at d, temporally consistent with the X-ray flare model suggested recently by Piro et al (2018). The X-ray flux has been fading since days after the merger and has returned to the level as first discovered after one year. Our result shows that the X-ray spectrum of GW170817/GRB170817A is well-described by a simple power-law originated from non-thermal slow-cooling synchrotron radiation.
Keywords:
gamma-ray burst: individual (GRB170817A) — gravitational waves — X-rays: individual (GW170817)I Introduction
On 17 August 2017, a binary neutron star merging event triggered the first confirmed detection of gravitational wave (GW) signal known as GW170817 (Abbott et al. 2017) accompanied by gamma-ray emission (Goldstein et al. 2017; Savchenko et al. 2017). On-going monitoring to this source has then revealed that the emissions span the whole electromagnetic spectrum. The X-ray counterpart of GW170817 was discovered by the Chandra X-ray Observatory 9 days after the detection of the GW signal (Troja et al. 2017).
Binary neutron star mergers are thought to be the progenitors of short gamma-ray bursts (sGRBs). The sGRB signal associated with GW170817, named GRB170817A, has confirmed this long-standing hypothesis. However, the observational properties of GRB170817A is not similar to the majority of sGRBs across the electromagnetic spectrum, suggesting that GRB170817A is probably observed off-axis and structured (Alexander et al. 2017; Evans et al. 2017; Fong et al. 2017; Haggard et al. 2017; Hallinan et al. 2017; Margutti et al. 2017; Troja et al. 2017, e.g.,). Various models of GRB jet could be distinguished by the afterglow emission mechanism inferred from their spectral shapes. This motivates us to reanalyze all the existing X-ray spectra of GRB170817A with Bayesian statistics.
In the fireball model of GRBs (Goodman 1986; Paczynski 1986; Rees & Meszaros 1992; Piran 1999), materials are accelerated to relativistic speeds in the jet. Ejecta collide with the circumburst medium and the electrons within are shock-accelerated to a power-law population with a minimum injection energy and cutoff energy , above which the electron cools significantly via synchrotron emission. This scenario, called the external shock model, results in a spectral shape with several power-law segments (Sari et al. 1998; Granot & Sari 2002, e.g.,),
| (1) |
where is the spectral index such that is the photon index in the convolved photon spectrum. The observed value of depends on the observing energy band, evolution of the electron population, and the micro-physics in the ejecta. The relative position of the characteristic frequencies, and , changes with the value of (Eqns. (2) and (3)). These characteristic frequencies depend on the electron and magnetic equipartition factors, and (Sari et al. 1998; Panaitescu & Kumar 2000). Moreover, the value of the peak energy of the spectrum also helps to constrain and (Dermer et al. 1999). Constraining the value of can therefore lead to an understanding of the emission processes taking place in the ejecta.
Here, we reanalyzed all archival X-ray spectral data of GRB170817A using Bayesian inference, which is a Bayesian statistical analysis technique mainly used in model parameter estimation. The conventional frequentist statistical method of using various test-statistics (e.g., minimization and its variants) might suffer from low number of photon counts (Greiner et al. 2016, see, Fig. 2 of). For instance, when the photon count is low ( photons), it follows a Poisson statistic such that the Gaussian assumption of minimization may no longer hold. In such cases, the Cash statistic (Cash 1979) should be used instead. However, there remains the issue of estimating the parameter uncertainty (i.e., the error bar). Since these are point estimations, error bars are not given for free as in Bayesian approach and are always estimated around the mode (i.e., the maximum) of the test-statistic. Bayesian inference can derive the posterior distributions of each parameter so that the errors (known as the credible regions) are readily obtained, while the distribution can be skewed or even multi-modal. Since individual time-resolved spectra of GRB170817A shows low signal-to-noise ratio, we therefore employ Bayesian inference in this paper to obtain the measurements and uncertainties of for individual time-resolved spectra from the public Chandra X-ray datasets of GW170817/GRB170817A since its first X-ray detection.
II Data Analysis and Results
| Episode | Obs. ID | Exposure | Time since GW | S/N | Flux (0.3-8.0 keV) | |||
| (ks) | (days) | () | ||||||
| I | 19294 | 49.4 | 8.9 | 3.33 | ()d | |||
| ()e | ||||||||
| 20728 | 46.7 | 15.2 | 2.85 | )d | ||||
| ()f | ||||||||
| II | 20860 | 74.1 | 107.5 | 9.61 | ()d | |||
| 20861 | 24.7 | 110.9 | 6.12 | ()f | ||||
| III | 20936 | 32.0 | 153.5 | 8.89 | ()d ()f | |||
| 20937 | 20.7 | 156.4 | 9.78 | |||||
| 20938 | 16.0 | 157.1 | 9.74 | |||||
| 20939 | 22.5 | 159.9 | 4.41 | |||||
| 20945 | 14.4 | 164.0 | 6.88 | |||||
| IV | 21080 | 50.7 | 259.4 | 4.20 | ()f | |||
| 21090 | 46.0 | 261.0 | 4.67 | |||||
| 21371 | 67.2 | 358.6 | 3.30 |
- •
NOTE. All uncertainties are given at the 1- Bayesian credible level.
- •
a Derived from Sherpa.
- •
b Derived from 3ML.
- •
cReference values of . Big right bracket means time-integrated spectrum.
- •
dFrom Margutti et al. 2018.
- •
eFrom Troja et al. 2018.
- •
fFrom Nynka et al. 2018.
- •
gFrom Haggard et al. 2018
We employed Bayesian inference to analyze all existing public Chandra datasets (Table. 1) observed from 26 August 2017 to 10 August 2018 (a total of 12 observations). Each dataset was processed with the CIAO software package (v4.9).11 1 http://cxc.harvard.edu/ciao/ The centroid position of the X-ray counterpart of GW170817/GRB170817A was determined by the point-source detection algorithm wavdetect. We selected a extraction region for the source, corresponding to a of the encircled energy fraction, while the background was estimated from a nearby source-free region. The spectra and associated response files were obtained using specextract. We performed Bayesian spectral analysis with Sherpa which is the modeling and fitting application of CIAO. A power law in the form of Eqn. (1) with an absorption was fit to each dataset. We fixed the absorption column density at , obtained by converting the Galactic optical extinction (Schlafly & Finkbeiner 2011) to a hydrogen column density according to the relation (Güver & Özel 2009). Uniform priors for the normalization and photon index were used to reflect our ignorance of the intrinsic distribution. In addition, we obtained consistent results using Gaussian priors. Conservatively, the results shown in this paper were adopted from uniform priors. A Poisson likelihood was used for both the source and background spectra. We sampled the posterior distribution using Markov chain Monte Carlo (MCMC) sampling technique. The means and credible intervals of the posterior distributions are then computed. Note that the Bayesian implementation of Sherpa took the background, instrumental response, and telescope’s effective area as well as their uncertainties into account when sampling the posterior distribution (van Dyk et al. 2001).
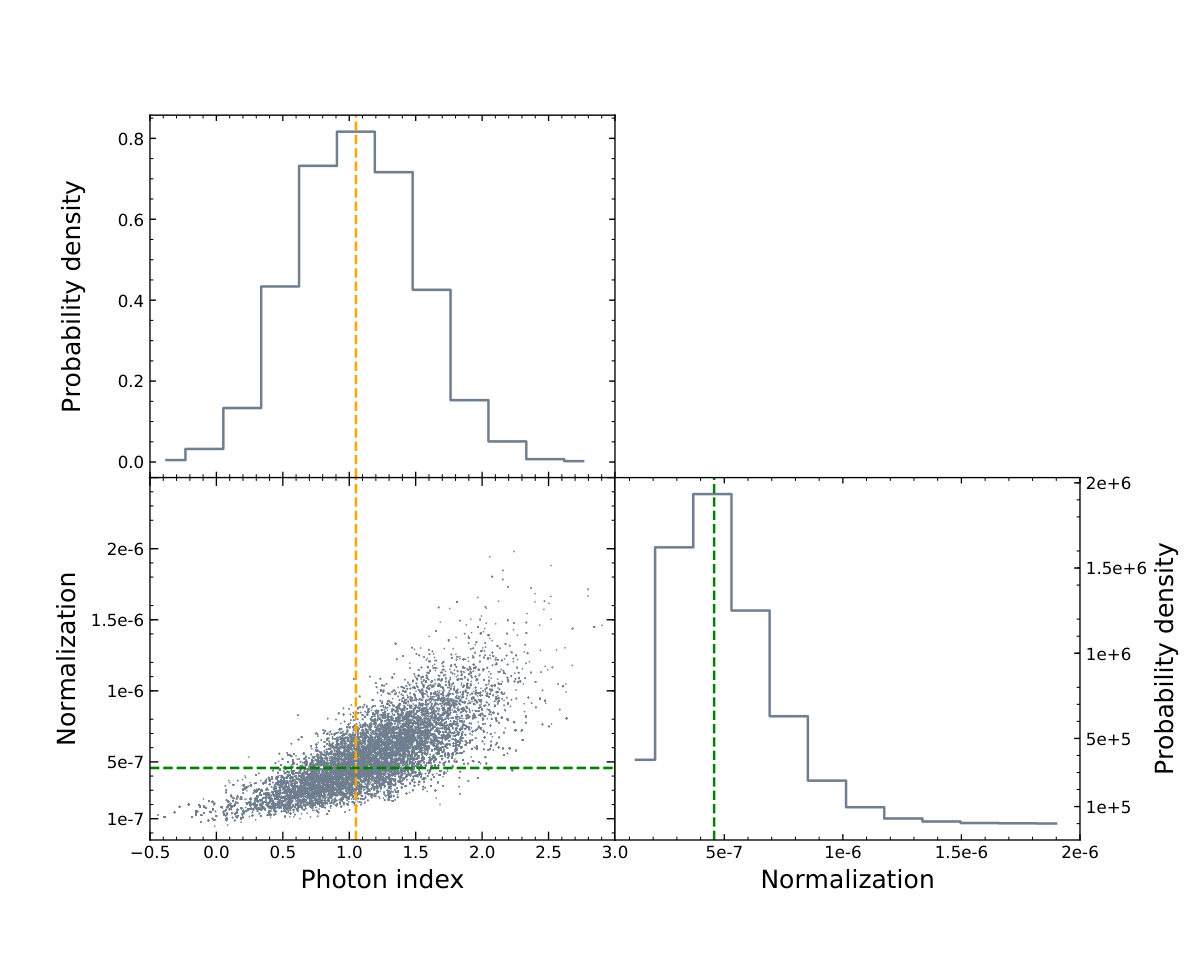
The 12 Chandra X-ray observations and Bayesian inference results are summarized in Table 1 and plotted in Fig. 1. The corner plot of the posterior distribution of the first observation is illustrated in Fig. 2. According to the proximity of the observing time, the 12 observations can be divided into four episodes: (I) 8.9-15.2 days; (II) 107.5-110.9 days; (III) 153.5-164.0 days; and (IV) 259.4-358.6 days. We found an overall photon index ranging between to (except the first dataset discussed below), consistent with a value of from previous analysis (Margutti et al. 2017; Mooley et al. 2018; Troja et al. 2017; Haggard et al. 2017; Margutti et al. 2018; Ruan et al. 2018; Troja et al. 2018; Nynka et al. 2018), which is consistent with an election power-law distribution index . The absorbed flux in 0.3-8.0 keV derived from the first X-ray counterpart detection at d post-merger was , and it gradually rose to a value of in episode II. Subsequent observations in episode III then revealed that the X-ray afterglow had reached its maximum intensity, of flux = at d that was more than four times brighter than the first detection. After the peak, the flux swiftly decreased to within 6 days. Same temporal variation was also noticed by Piro et al. 2018, in which they proposed an X-ray flare from the source was possibly observed. Following the fading trend seen in episode III, the source intensity continued to decrease in the late times. The observed flux at d was . Almost one year after the merging event, the signal from the X-ray counterpart of GW170817 has now dropped to a similar intensity as first discovered.
Unexpectedly, the first dataset observed at 8.9 d post-merger shows a marginally hard spectrum of using our Bayesian analysis method (Fig. 2), in stark contrast to the softer spectrum inferred at a later time. This result is indeed consistent with previous reports using Cash statistic (Margutti et al. 2018; Troja et al. 2018). We therefore further test this result using Monte Carlo simulation. We follow the Sherpa analysis procedure to simulate 500 spectra with , which is the average of the later datasets (ObsIDs 20728-21371). The first two datasets have very low signal-to-noise ratio () due to low photon counts (). Poisson noise was added to the simulated power law to achieve a similar . Finally, we repeat the spectral analysis procedure aforementioned and obtain an average . The cumulative distribution of is shown in Fig. 3 and the probability for obtaining is about 4.4%. The failure to reproduce indicates that the observed hard spectrum is unlikely to be caused by statistical fluctuation in the Chandra observation. However, the large errors prevent us from drawing any firm conclusions regarding this peculiar spectral behavior.
Furthermore, in addition to the standard toolkit Sherpa, we perform the entire spectral analysis procedure using the Multi-Mission Maximum Likelihood framework (Vianello et al. 2015, 3ML,). We import from XPSEC an absorbed power-law model with the neutral hydrogen column density fixed at the Galactic value, which is identical to the analysis using Sherpa. The 3ML results are found to be in agreement with Sherpa.
We notice that the time-integrated obtained by other works (see Table 1) have similar values to the average of ours. This shows that intrinsic spectral evolution of individual time-resolved spectrum is non-negligible. As a matter of fact, we also note that the errors on obtained using Cash statistic are asymmetric, indicating a significantly skewed parameter distribution, while our Bayesian posteriors are highly symmetric (see Fig. 2 and Sect. III for further discussion).
III Discussion
The X-ray emission in GRB afterglow is attributed to non-thermal synchrotron emission by relativistic electrons when the jet ejecta collide with the circumburst medium. In the external shock model, the synchrotron spectrum is divided into segments with different spectral slopes (Sari et al. 1998; Granot & Sari 2002), and the breaks between the segments are where different characteristic frequencies located at. The relative positions of the cooling frequency and the minimum injection frequency depends on the values of and of the electron distribution. These values determine whether the so-called slow-cooling scenario (),
| (2) |
or fast-cooling scenario (),
| (3) |
is taking place in the emission region.22 2 The flux will diverge for when integrating the electron population and the synchrotron kernel (Rybicki & Lightman 1979, see, e.g.,). The GRB afterglow is expected to evolve from fast to slow-cooling regime (Sari et al. 1998; Granot & Sari 2002, e.g.,).
According to Table 1, both Sherpa and 3ML successfully constrained that agrees within 1- uncertainties. It can be seen that remains constant throughout the entire observing period within the error bars. Results derived from Sherpa and 3ML present a consistent picture of a constant , in accordance with the interpretation that the segment is being observed, assuming a typical electron power-law distribution index of (Alexander et al. 2017; Margutti et al. 2017; Margutti et al. 2018; Mooley et al. 2018; Troja et al. 2018), consistent with the conventional slow-cooling scenario of GRB afterglows.
A possible scenario proposed by Piro et al. 2018 is that the appearance of an X-ray flare directly attribute to the increase of flux seen in episode III. X-ray flares are commonly seen in GRB afterglows (Burrows et al. 2005; Zhang et al. 2006; Chincarini et al. 2007), characterized by large flux variations in the X-ray light curves, and are mostly driven by the re-activation of the central source engines. In our analysis, the unabsorbed flux of the source reached its peak value at d post-merger, and then decreased by a factor of within 6 days. Piro et al. 2018 estimated the time duration of this X-ray flare candidate was between 137 to 161 days post-merger, which is temporally consistent with our result. However, due to the lack of observations during the entire period of time, detailed comparison to other GRB X-ray flares is not possible.
Placing the afterglow emission of GRB170817A in the slow-cooling regime provides constraints for the magnetic field. For instance, the cooling frequency can be written as , assuming on-axis and constant circumburst medium density (Panaitescu & Kumar 2000). Since we do not observe in the X-ray band, putting the isotropic energy erg (Abbott et al. 2017), the number density of the circumburst medium cm-3 (Fong et al. 2015, median value of short GRBs;), the Compton parameter , and the time in days d, it is estimated that assuming 10 keV for Chandra’s upper energy limit, or if 100 keV is assumed. Although the estimation is derived from an on-axis model, it is consistent with the values from the cocoon model (Mooley et al. 2018; Troja et al. 2018, , e.g., in) and the off-axis model (Troja et al. 2018, , e.g., in).
As a remark, Margutti et al. 2018 and Troja et al. 2018 also reanalyzed some of the Chandra datasets using Cash statistic. They reported similar spectra: at d and at d (Margutti et al. 2018); at d and at d (Troja et al. 2018). Comparing to our Gaussian-like posterior distribution of (Fig. 2), the highly asymmetric error bars might be an indication that the frequentist approach is limited by the poor . Although these results are skewed towards harder values, they are consistent with our Bayesian results, possibly indicating a hard-to-soft evolution during the first episode.
IV Summary
Taking the advantage of Bayesian statistics in dealing with the low-count X-ray data, we performed a detailed spectral analysis to all the public Chandra observations of the binary neutron star coalescence GW170817/GRB170817A to date. The observed X-ray afterglow can be explained by a simple power-law spectral shape originated from slow-cooling synchrotron radiation. Throughout the one year period since the merger, the photon index is consistently shown to have remained constant at , suggesting an electron power-law distribution index . An unexpectedly hard spectrum of observed at d post-merger is observed, though large uncertainties exist. The unabsorbed flux is found to be peaked at d post-merger, which hints to a possible X-ray flare. This is the first time Bayesian analysis is applied to the X-ray data of GRB170817A. With our straightforward derivation of the posterior distributions of spectral parameters and uncertainties which are consistent with other works, we have shown that the application of Bayesian inference is a viable method in analyzing the low data from this NS-NS merger as well as similar events.
References
- Abbott et al. (2017) Abbott, B. P., Abbott, R., Abbott, T. D., et al. 2017, ApJ, 848, L13
- Alexander et al. (2017) Alexander, K. D., Berger, E., Fong, W., et al. 2017, ApJ, 848, L21
- Burrows et al. (2005) Burrows, D. N., Romano, P., Falcone, A., et al. 2005, Science, 309, 1833
- Cash (1979) Cash, W. 1979, ApJ, 228, 939
- Chincarini et al. (2007) Chincarini, G., Moretti, A., Romano, P., et al. 2007, ApJ, 671, 1903
- Dermer et al. (1999) Dermer, C. D., Chiang, J., & Böttcher, M. 1999, ApJ, 513, 656
- Evans et al. (2017) Evans, P. A., Cenko, S. B., Kennea, J. A., et al. 2017, Science, 358, 1565
- Fong et al. (2015) Fong, W., Berger, E., Margutti, R., & Zauderer, B. A. 2015, ApJ, 815, 102
- Fong et al. (2017) Fong, W., Berger, E., Blanchard, P. K., et al. 2017, ApJ, 848, L23
- Goldstein et al. (2017) Goldstein, A., Veres, P., Burns, E., et al. 2017, ApJ, 848, L14
- Goodman (1986) Goodman, J. 1986, ApJ, 308, L47
- Granot & Sari (2002) Granot, J., & Sari, R. 2002, ApJ, 568, 820
- Greiner et al. (2016) Greiner, J., Burgess, J. M., Savchenko, V., & Yu, H.-F. 2016, ApJ, 827, L38
- Güver & Özel (2009) Güver, T., & Özel, F. 2009, MNRAS, 400, 2050
- Haggard et al. (2018) Haggard, D., Nynka, M., & Ruan, J. J. 2018, The Astronomer’s Telegram, 11945
- Haggard et al. (2017) Haggard, D., Nynka, M., Ruan, J. J., et al. 2017, ApJ, 848, L25
- Hallinan et al. (2017) Hallinan, G., Corsi, A., Mooley, K. P., et al. 2017, Science, 358, 1579
- Margutti et al. (2017) Margutti, R., Berger, E., Fong, W., et al. 2017, ApJ, 848, L20
- Margutti et al. (2018) Margutti, R., Alexander, K. D., Xie, X., et al. 2018, ApJ, 856, L18
- Mooley et al. (2018) Mooley, K. P., Nakar, E., Hotokezaka, K., et al. 2018, Nature, 554, 207
- Nynka et al. (2018) Nynka, M., Ruan, J. J., Haggard, D., & Evans, P. A. 2018, ApJ, 862, L19
- Paczynski (1986) Paczynski, B. 1986, ApJ, 308, L43
- Panaitescu & Kumar (2000) Panaitescu, A., & Kumar, P. 2000, ApJ, 543, 66
- Piran (1999) Piran, T. 1999, Phys. Rep., 314, 575
- Piro et al. (2018) Piro, L., Troja, E., Zhang, B., et al. 2018, ArXiv e-prints, arXiv:1810.04664
- Rees & Meszaros (1992) Rees, M. J., & Meszaros, P. 1992, MNRAS, 258, 41P
- Ruan et al. (2018) Ruan, J. J., Nynka, M., Haggard, D., Kalogera, V., & Evans, P. 2018, ApJ, 853, L4
- Rybicki & Lightman (1979) Rybicki, G. B., & Lightman, A. P. 1979, Radiative processes in astrophysics
- Sari et al. (1998) Sari, R., Piran, T., & Narayan, R. 1998, ApJ, 497, L17
- Savchenko et al. (2017) Savchenko, V., Ferrigno, C., Kuulkers, E., et al. 2017, ApJ, 848, L15
- Schlafly & Finkbeiner (2011) Schlafly, E. F., & Finkbeiner, D. P. 2011, ApJ, 737, 103
- Troja et al. (2017) Troja, E., Piro, L., van Eerten, H., et al. 2017, Nature, 551, 71
- Troja et al. (2018) Troja, E., Piro, L., Ryan, G., et al. 2018, Monthly Notices of the Royal Astronomical Society: Letters, 478, L18
- van Dyk et al. (2001) van Dyk, D. A., Connors, A., Kashyap, V. L., & Siemiginowska, A. 2001, ApJ, 548, 224
- Vianello et al. (2015) Vianello, G., Lauer, R. J., Younk, P., et al. 2015, ArXiv e-prints, arXiv:1507.08343
- Zhang et al. (2006) Zhang, B., Fan, Y. Z., Dyks, J., et al. 2006, ApJ, 642, 354