Evaluating Text-to-Image Matching using Binary Image Selection (BISON)
Abstract
Providing systems the ability to relate linguistic and visual content is one of the hallmarks of computer vision. Tasks such as text-based image retrieval and image captioning were designed to test this ability, but come with evaluation measures that have high variance or are difficult to interpret. We study an alternative task for systems that match text and images: given a text query, the system is asked to select the image that best matches the query from a pair of semantically similar images. The system’s accuracy on this Binary Image SelectiON (BISON) task is interpretable, eliminates the reliability problems of retrieval evaluations, and focuses on the system’s ability to understand fine-grained visual structure. We gather a BISON dataset that complements the COCO dataset and use it to evaluate modern text-based image retrieval and image captioning systems. Our results provide novel insights into the performance of these systems.
1 Introduction
Understanding the relation between linguistic and visual content is a fundamental goal of computer vision. This goal has motivated a large body of research focusing on tasks such as text-based image retrieval [24, 35] and image captioning [24, 27, 56, 58]. Both these tasks have challenges in terms of evaluation: in particular, the open-ended nature of image captioning tasks makes it difficult to develop evaluation measures [3, 55] that reliably and accurately measure image-text relevance without also considering other abilities, such as fluency in language generation [1]. Text-based image retrieval does not have these problems, but is unreliable because retrieval datasets are only partially labeled: they incorrectly assume that images that are not positively labeled for a given text query are negative examples. Our analysis of the errors of caption-based image retrieval systems reveals that more than half of these “errors” are due to errors in the evaluation, that is, due to “negative” images being accurately described by the text query; see Section 2 for a detailed analysis.

Motivated by this issue, we propose an alternative task to evaluate systems that match textual and visual content, called Binary Image SelectiON (BISON). In BISON, the system is provided with two similar images and a fine-grained text query that describes one image but not the other. The system needs to select which of the two images is described in the text query; see Figure 1. The performance of the system is measured in terms of its binary classification accuracy of selecting the correct image. Indeed, BISON can be viewed as a variant of text-based image retrieval in which positive and negative examples are explicitly labeled. BISON can be used as an auxiliary evaluation of generative (captioning) and discriminative (retrieval) vision-language models, which facilitates its use in conjunction with existing evaluations. BISON accuracy differs from existing tasks in that it is reliable, easy to interpret, and focuses on fine-grained visual content.
To facilitate binary image selection experiments, we collected the COCO-BISON dataset using the images and captions in the existing COCO [12] validation set. By using both the text and images from the COCO dataset, we ensure that COCO-BISON has a similar distribution as COCO — this allows for the evaluation of COCO-trained models on the COCO-BISON dataset. We use the COCO-BISON dataset to evaluate state-of-the-art text-based image retrieval and image captioning systems, shedding new light on the performance of these systems. For example, in contrast to prior work, we find these systems are not as good as humans in matching visual and (detailed) linguistic content.
| Recall@1 | Human | Number | Percentage |
|---|---|---|---|
| Incorrect | Incorrect | 165 | 43.9% |
| Incorrect | Correct | 211 | 56.1% |


2 Analyzing Retrieval and Captioning Tasks
We performed two experiments to identify the limitations of popular evaluations of vision-and-language systems via text-based image retrieval and image captioning.
Text-based image retrieval. Evaluations via text-based image retrieval use a single positive image for each text query and assume all other images in the dataset are negative examples for that query [24, 35]. This assumption is often incorrect, in particular, when the image datasets is large. To assess the severity this problem, we performed an experiment in which we analyzed the “errors” made by the state-of-the-art SCAN t2i retrieval system [34] on the COCO captions validation set. We presented each incorrectly retrieved image along with the text query to a set of human annotators, asking them to indicate if the text query appropriately describes the content of the image. The results of this experiment are presented in Table 1 and suggest that more than half of the “errors” made by the SCAN t2i system are, in fact, not errors: the retrieved images are erroneously marked as incorrect due to the lack of explicit negative annotations. Figure 2 illustrates the problem by showing two examples of a text query, an “incorrectly” retrieved image, and the image labeled as positive for the query. Our results suggest that image retrieval measures are very unreliable.
Image captioning. Captioning evaluation measures such as BLEU-4 [43], CIDEr-D [55], METEOR [8], and SPICE [3] compare a generated caption to a collection of reference captions. As a result, the evaluations may be sensitive to changes in the reference caption set and incorrectly assess the semantics of the generated caption. We perform an analysis designed to study these effects on the COCO captions validation set by asking human annotators to assess image captions generated by the state-of-the-art UpDown [4, 50] captioning system11 1 We performed the same experiment using other captioning methods. The results of these experiments were qualitatively similar, and are presented in the supplemental material.. Specifically, we followed the COCO guidelines for human evaluation [1] and asked annotators to evaluate the “correctness” of image-caption pairs on a Likert scale from 1 (low) to 5 (high). We asked a second set of annotators to evaluate the “detailedness” of captions (without showing them the image) on the same Likert scale.
Figure 4 shows the resulting correctness and detailedness assessments as a function of four captioning scores (BLEU-4, CIDEr-D, METEOR, and SPICE) that were normalized to lie between and . The results in the figure suggest that captioning scores do not correlate with the correctness of generated captions very well, and do not encourage generated captions to provide a detailed description of the image. Figure 3 shows three examples of generated captions that have a low CIDEr-D score even though they are correct according to human annotators. The examples highlight the limitations of using a handful of reference captions to evaluate captioning systems: the reference captions do not capture all visual content and all the different ways in which that content can be described [11, 40]. This leads captioning measures to reward systems for generating generic captions.
3 The COCO-BISON Dataset
The goal of binary image selection (BISON) is to provide a reliable and interpretable evaluation task for systems that relate images and text, with a focus on fine-grained visual content. To this end, following [21], we collected BISON annotations for the validation split of the COCO captions dataset [12].
3.1 Collection of BISON Annotations
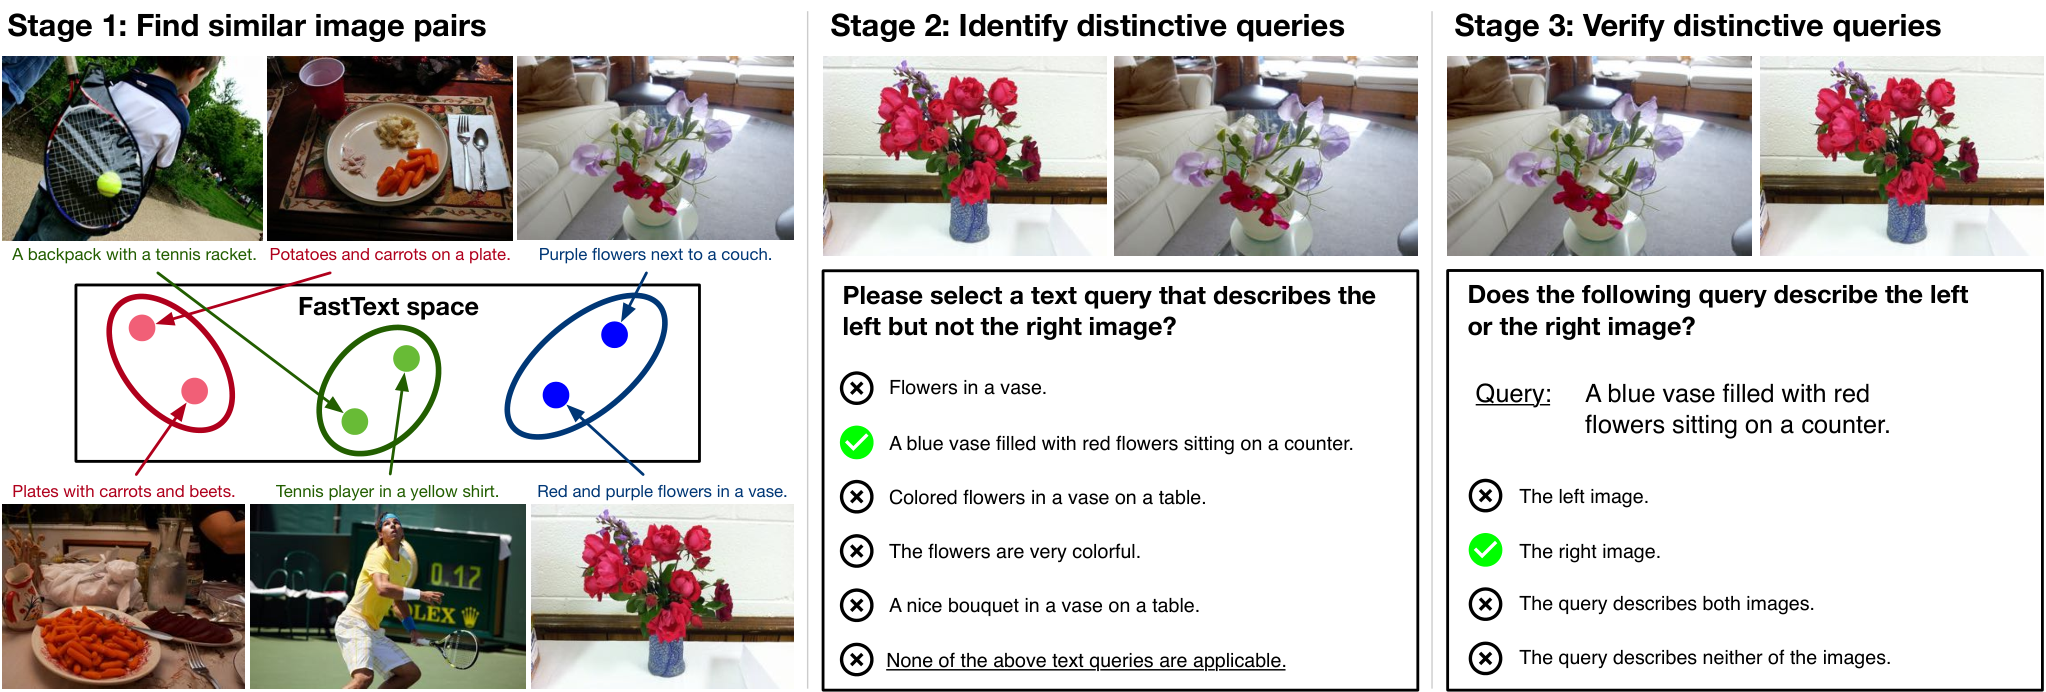
Figure 5 illustrates the three main stages of our pipeline for collecting binary image selection annotations.
1. Collect pairs of semantically similar images. We construct a semantic representation for each image in the COCO validation set by averaging word embeddings (obtained using FastText [26]) of all the words in all captions associated with the image. We use these representations to find the semantically most similar image for each image in the dataset via nearest neighbor search. We label the query image as positive and its nearest neighbor as negative.
2. Identify text queries that distinguish positive and negative images. We present human annotators with an interface22 2 Screenshots of the annotation interface in the supplementary material. that shows: (1) a positive image, (2) the corresponding negative image, and (3) the five captions associated with the positive image in the COCO captions dataset. We ask the annotators to select a text query from the set of five captions that describes the positive image but not the negative image, or to select “none of the above” if no discriminative text query exists. Unless annotators select the latter option, each of their annotations produces a query-positive-negative triple. We discard all image pairs for which annotators indicated no discriminative text query exists.
3. Verify correctness of the query-positive-negative triples. To ensure the validity of each query-positive-negative triple, we presented a different set of human annotators with trials that contained the positive and negative images and the query selected in stage 2. We asked the annotators whether the text query describes33 3 In the verification stage, the annotators do not know which image is positive and which one is negative.: (1) the positive image, (2) the negative image, (3) both images, or (4) neither of the images. Each verification trial was performed by two annotators; we only accepted the corresponding BISON example if both annotators correctly selected the positive image given the text query.
The query-positive-negative triples thus collected form binary image selection (BISON) examples, two of which are shown in Figure 1. The COCO-BISON dataset and corresponding evaluation code is publicly available from http://hexianghu.com/bison/.
3.2 Dataset Characteristics
Table 2 presents key statistics of our COCO-BISON dataset; for reference, it also shows the statistics of the validation splits of two popular captioning datasets. As shown in the table, our three-stage annotation procedure produced a BISON example for of the the images in the COCO captions validation set ().
| Flickr-30K | COCO val | COCO-BISON | |
|---|---|---|---|
| Number of examples | 5,070 | 202,654 | 54,253 |
| Unique images | 1,014 | 40,504 | 38,680 |
| Unique captions | 5,068 | 197,792 | 45,218 |
To ensure our collection procedure did not substantially alter the text distribution of the COCO dataset, we compare44 4 The word distribution and vocabulary overlap of both datasets is shown in the supplementary material. the COCO and the COCO-BISON datasets in terms of caption / text query length and part-of-speech distribution in Figure 6. The figure shows that, on average, COCO-BISON queries tend to be slightly longer than COCO captions: annotators selected the longest captions of the time in the second stage of the dataset collection, presumably, because longer queries tend to be more detailed. However, the part-of-speech distribution of the COCO-BISON queries is very similar to that of COCO captions, facilitating experiments in which image retrieval and captioning systems are trained on COCO but evaluated on COCO-BISON.
3.3 Definition of the BISON Task
In the BISON task, the model is given two images and a text query that describes one of the two images and asked to select the correct image; see Figure 1. The model’s performance is measured in terms of binary classification accuracy. We report the mean accuracy over the COCO-BISON data and refer to it as the BISON score. We only use COCO-BISON for evaluation, i.e., we do not train systems on the annotations in the COCO-BISON dataset.
Existing text-based image retrieval and image captioning systems can be used to perform binary image selection. Doing so requires computing a “compatibility” score between the text query and the two images, and picking the image with the highest score. For image captioning systems, the compatibility score is generally defined as the log-likelihood of the text query given the image. Image retrieval systems naturally compute the compatibility score, e.g., via an inner product of the image and text features.
4 BISON Evaluation of State-of-the-Art
Captioning and Retrieval Systems
We evaluate four state-of-the-art text-based image retrieval systems and three recent image captioning systems on binary image selection using the COCO-BISON dataset.
4.1 Evaluated Retrieval and Captioning Systems
We evaluate four systems for text-based image retrieval: (1) ConvNet+BoW, (2) ConvNet+Bi-GRU, (3) Obj+Bi-GRU, and (4) SCAN [34]. The ConvNet+BoW system represents the text query by averaging word embeddings over all words in the query, and represents the image by averaging features produced by a convolutional network over regions (described later). The resulting representations are processed separately by two multilayer perceptrons (MLPs). We use the cosine similarity between the outputs of the two MLPs as the image-text compatibility score. The ConvNet+Bi-GRU system is identical to the previous system, but it follows [30] and uses a bi-directional GRU [14] to construct the text representation. The Obj+Bi-GRU system is similar to ConvNet+Bi-GRU but uses a Bi-GRU to aggregate image-region features (spatial ConvNet features or object proposal features) and construct the image representation. Finally, SCAN [34] is a state-of-the-art image-text matching system based on image-region features and stacked cross-attention; we implement two variants of this system, viz. one that uses image-to-text (i2t) attention and one that uses text-to-image (t2i) attention. All retrieval systems are trained to minimize a max-margin loss [17].
We also evaluate three image captioning systems: (1) the ShowTell captioning system [56]; (2) an extension of the ShowTell system that can attend to specific parts of the image, called ShowAttTell [47, 58]; and (3) the state-of-the-art UpDown captioning system [4]. Like ShowAttTell, the UpDown system uses a spatial attention mechanism but it differs from ShowAttTell in that it uses two LSTMs: one for decoding captions and another one for generating spatial attention over image features. We train all three captioning systems on the COCO captions [12] training set by minimizing the cross-entropy loss per word over a vocabulary of words, and average the loss over all words in the reference caption. Following common practice [4, 36, 47], we also finetune the systems using self-critical sequence training (SCST; [47]). SCST uses the REINFORCE algorithm [53] to maximize the CIDEr-D score [55] of the captioning system. We report the performance of the captioning systems both before and after SCST finetuning.
Implementation details. Following the current state-of-the-art in image captioning [4, 34], all our systems use the top object proposal features produced by a Faster R-CNN model [46] with a ResNet-101 backbone that was trained on the ImageNet [49] and Visual Genome [32] datasets. In all systems, word embeddings were initialized randomly. We refer the reader to the supplementary material for a complete overview of the hyperparameters we used when training the systems.
| Dataset | COCO-1K [27] | COCO-BISON | |||
|---|---|---|---|---|---|
| Task | Image retrieval | Caption retrieval | |||
| Measure | R@1 | R@5 | R@1 | R@5 | BISON |
| ConvNet+BoW | 45.19 | 79.26 | 56.60 | 85.70 | 80.48 |
| ConvNet+Bi-GRU [30] | 49.34 | 82.22 | 61.16 | 89.02 | 81.75 |
| Obj+Bi-GRU | 53.97 | 85.26 | 66.86 | 91.40 | 83.90 |
| SCAN i2t [34] | 52.35 | 84.44 | 67.00 | 92.62 | 84.94 |
| SCAN t2i [34] | 54.10 | 85.58 | 67.50 | 92.98 | 85.89 |
4.2 Results
Table 7 presents the BISON accuracy of the text-based image retrieval systems on the COCO-BISON dataset. For reference, the table also presents the recall@ (for and ) of these systems on a caption-based image retrieval and an image-based caption retrieval task; these results were obtained on the COCO-1K split of [27]. In line with prior work [34], we find that the SCANt2i system outperforms the competing systems in terms of all quality measures.
As expected, we observe that the ranking of caption-based retrieval systems in terms of their BISON accuracy is similar to their ranking in terms of retrieval measures. However, the BISON score provides a more reliable error measure because it does not erroneously consider correct retrievals to be incorrect just because another image happened to be labeled as the positive image for that query. This is reflected in the fact that the BISON score of all systems is higher than their recall@1, and implies that BISON scores are more reliable. We expect that the reliability of evaluation measures becomes more important as the quality of text-to-image matching systems increases: as error rates decrease, measures with both low variance and bias become essential to reliably compare systems.
Figure 7 displays two correct and two incorrect predictions for BISON examples, obtained using the SCAN t2i retrieval system. The examples illustrate the strong performance of the system, but also highlight how it sometimes fails to incorporate fine-grained visual content in its predictions, such as the color of the chairs or the presence of fog.
Table 6 presents the BISON accuracy of our three image captioning systems on the COCO-BISON dataset. For reference, the table also presents the performance of these systems in terms of four standard captioning scores on the standard COCO validation set, and the performance of human annotators on the COCO test set (adopted from [1]). Again, the results reveal that the ranking of the three systems is identical across all evaluation scores, even though BISON measures different aspects of the system than the captioning scores. In line with prior work [50], we find that the UpDown captioning system outperforms its competitors in terms of all evaluation measures, including BISON.

The main difference between BISON and existing captioning scores is in how they rank the ability of humans to generate captions: all three systems outperform humans in terms of nearly all captioning scores, but they all perform substantially worse than humans in terms of BISON accuracy55 5 Please note that the accuracy of humans on the BISON task is by definition due to the way the COCO-BISON dataset was collected.. Unless one believes that current image captioning systems actually exhibit super-human performance, this suggests that measuring the BISON score of a system provides a more realistic assessment of the capabilities of modern image captioning systems compared to humans.
| Dataset | COCO validation split | COCO-BISON | |||
|---|---|---|---|---|---|
| Measure | BLEU-4 | CIDEr | SPICE | METEOR | BISON |
| Cross-entropy loss | |||||
| ShowTell [56] | 32.35 | 97.20 | 18.34 | 25.51 | 78.59 |
| ShowAttTell [58] | 33.49 | 101.55 | 19.16 | 26.06 | 82.04 |
| UpDown [4] | 34.53 | 105.40 | 19.86 | 26.69 | 84.04 |
| Self-critical sequence loss [47] | |||||
| ShowTell [56] | 32.38 | 97.88 | 18.42 | 25.68 | 78.79 |
| ShowAttTell [58] | 33.99 | 103.68 | 19.53 | 26.37 | 82.73 |
| UpDown [4] | 34.58 | 106.30 | 20.01 | 26.92 | 84.27 |
| Human [1] | 100.00 | ||||
5 Related Work
BISON is related to a variety of different tasks and experimental setups that involve matching visual and linguistic information, including referring expressions [28, 31, 60], visual story-telling [25], visual question answering [7, 38], visual question generation [16, 39, 42], and zero-shot learning [2, 48]. A comprehensive overview of all this prior work is outside the scope of this paper; we refer the reader to [19] for a survey. Most of the related tasks are more “AI-complete” than binary image selection in the sense that they simultaneously assess a range of system abilities that go beyond matching visual content and textual descriptions.
BISON is most closely related to text-based image retrieval, image captioning, and referring expression tasks. We give a brief overview of prior work on these tasks below.
Text-based image retrieval [9, 10, 20, 24, 45, 51] is a task in which the system is asked to retrieve relevant images given a text description. Retrieval performance is generally measured in terms of recall@ [24]. Similar to BISON, caption-based image retrieval evaluates how well a system can distinguish relevant images from irrelevant ones. As described above, the key difference between image retrieval and BISON is that retrieval evaluations rely on “implicit” negatives: retrieval datasets provide manually annotated positive image-description pairs, but they assume that every image-description pair that is not in the dataset is a negative example. In practice, this assumption is often violated: many such image-description pairs would actually be labeled positively by a human annotator [35]. In contrast to retrieval datasets, each example in our COCO-BISON dataset contains a positive and a genuinely negative image-description pair, which facilitates more reliable evaluation.
Image captioning [6, 13, 18, 24, 27, 33, 56, 58] is a task in which the system generates a textual description of an image. The task assesses a system’s ability to ingest visual information in an image and generate fluent natural language descriptions of that information [12]. As a result, captioning gauges not only visual understanding but also the generative linguistic prowess of systems. In contrast, binary image selection only measures the ability of a system to discriminate between images based on a text description.
A recent line of work [5, 36, 54] focuses on generating discriminative text descriptions for images. BISON is related to this work but it focuses solely on the discriminative aspect of the task by not considering language generation. This relates BISON to [52], which centers on predicting whether or not text correctly describes an image pair.
Referring expressions [15, 28, 31, 41, 60] is a task in which a system is asked to distinguish objects in a single image based on a text description. BISON can thus be viewed as a kind of holistic referring-expressions task that involves between-image rather than within-image comparisons. In contrast to referring expressions that focus on a single object and its attributes, text descriptions in BISON may focus on groups of objects and their attributes, relationships between these objects, and even entire scenes.
6 Using BISON to Analyze Systems
We performed experiments to study BISON evaluation and the differences between text-based image retrieval and image-captioning systems in more detail.
Does BISON accuracy predict captioning scores? We evaluated the UpDown captioning system [4] in terms of BISON accuracy and in terms of four captioning scores on the COCO-BISON dataset. Figure 8 shows the distribution of the captioning scores separately for BISON examples that were classified correctly and for examples that were incorrectly (by the same systems). Specifically, for each COCO-BISON example that the model classifies correctly (or incorrectly), we generated a caption for the positive image and measured the captioning score of the generated caption. If captioning scores measure the same characteristics as BISON, one would expect the distribution of captioning scores to center on higher values for correctly classified BISON examples than for incorrectly classified BISON examples. However, the figure shows that distribution of all the captioning scores is nearly identical for BISON examples that were correctly and incorrectly classified. This result suggests that BISON assesses different aspects of matching visual and linguistic content than image captioning does.
Do caption score differences provide signal for BISON? We try and classify BISON examples based on captioning scores for the positive and negative images in those examples. Specifically, we compute a captioning score (e.g., BLEU-4) between the BISON text query and the COCO reference captions corresponding to both the positive and negative BISON images. When computing the score for the positive image, we remove the text query from the set of reference captions; for the negative image, we randomly select four captions from the reference captions (without replacement). Next, we select the image with the highest captioning score as prediction for the BISON example.
The BISON accuracy of this approach is for BLEU-4, for CIDEr-D, for METEOR, and for SPICE. This result shows that predictions based on captioning scores select the incorrect BISON image at least of the time, despite relying on access to the ground-truth reference captions. This low accuracy suggests that BISON and captioning scores are very different measures for matching textual and visual content.
How do text-query alterations alter BISON predictions? We performed experiments where we altered the COCO-BISON text queries by doing the following automatic perturbations: (1) negating the query; replacing the words by (2) synonyms (3) hypernyms; (4) permuting the word order and (5) reversing the word order in the query (see details in the supplementary material). We measured the percentage of BISON predictions that were changed by these query perturbations for both the retrieval and captioning systems. These changes give more insights into the differences between retrieval and captioning systems. Figure 9 shows that the BISON predictions of retrieval and captioning systems do not change much under negation. Retrieval systems are also more robust to changes in the word order than captioning systems. This suggests that captioning systems are more sensitive to the fluency of a text query. We report this analysis for other systems in the supplementary material.
7 Discussion
This study has developed binary image selection (BISON) as an alternative task for evaluating the performance of systems that relate visual and linguistic content. Our study shows that BISON solves the issues of text-based image retrieval tasks that erroneously assume that all unlabeled images are negative examples for the text query, and that it assesses a different set of capabilities than image captioning tasks. Compared to text-based image retrieval, BISON has the advantage that the evaluation is more reliable, easily interpretable, and that it focuses more on “fine-grained” visual content. This focus on fine-grained visual information is also in contrast to image captioning tasks that encourage the generation of “generic” descriptions. In a sense, BISON can be viewed as a variant of referring-expressions tasks that considers images “holistically” rather than focusing on image parts. However, the BISON paradigm also has disadvantages compared to tasks such as image captioning: for instance, it does not assess the fluency of the linguistic content. Therefore, we view binary image selection as an evaluation task that ought to be used in conjunction with other evaluation tasks, such as the image retrieval, image captioning, and referring expression tasks (see Section 5 for an overview).
We observed that the relative ranking of modern systems in terms of retrieval or captioning scores is nearly identical to the ranking of those systems in terms of BISON. A potential explanation for this observation may be that some systems are unequivocally better than others: for instance, if system A has an image-recognition component that is substantially better than the image-recognition component of system B, it is quite likely that system A will outperform system B in a very wide range of tasks involving vision and language. We do emphasize, however, that it is well possible that the observed rank correlation between captioning and BISON scores may no longer hold when researchers start designing systems with the BISON evaluation in mind. Results comparing the performance of humans with that of our systems underline this point: existing captioning scores suggest that systems possess super-human capabilities, which contradicts human assessments of the quality of these systems. By contrast, the BISON scores of current systems appear to be better aligned with human assessments of the quality of these systems.
To conclude, we hope that the binary image selection task will foster research into models that go beyond coarse-level matching of visual and linguistic content by rewarding systems that can perform visual grounding at a detailed level. The interpretability of BISON makes it easier to debug and analyze this visual grounding. We hope that the public release of the COCO-BISON dataset will help the community assess whether we are making progress towards the goal of developing such systems.
Acknowledgements
We thank Devi Parikh, Marcus Rohrbach, Brian Knott, and anonymous reviewers for comments on early versions of this paper.
References
- [1] Microsoft COCO 1st Captioning Challenge (Large-scale Scene UNderstanding Workshop, CVPR 2015). http://lsun.cs.princeton.edu/slides/caption_open.pdf. Accessed: Nov 3, 2018.
- [2] Z. Akata, F. Perronnin, Z. Harchaoui, and C. Schmid. Label-embedding for attribute-based classification. In CVPR, 2013.
- [3] P. Anderson, B. Fernando, M. Johnson, and S. Gould. Spice: Semantic propositional image caption evaluation. In ECCV, 2016.
- [4] P. Anderson, X. He, C. Buehler, D. Teney, M. Johnson, S. Gould, and L. Zhang. Bottom-up and top-down attention for image captioning and visual question answering. 2018.
- [5] J. Andreas and D. Klein. Reasoning about pragmatics with neural listeners and speakers. arXiv preprint arXiv:1604.00562, 2016.
- [6] J. Aneja, A. Deshpande, and A. G. Schwing. Convolutional image captioning. In CVPR, 2018.
- [7] S. Antol, A. Agrawal, J. Lu, M. Mitchell, D. Batra, C. Lawrence Zitnick, and D. Parikh. Vqa: Visual question answering. In ICCV, 2015.
- [8] S. Banerjee and A. Lavie. Meteor: An automatic metric for mt evaluation with improved correlation with human judgments. In ACL workshop, 2005.
- [9] K. Barnard, P. Duygulu, D. Forsyth, N. d. Freitas, D. M. Blei, and M. I. Jordan. Matching words and pictures. JMLR, 2003.
- [10] K. Barnard and D. Forsyth. Learning the semantics of words and pictures. In ICCV, 2001.
- [11] A. C. Berg, T. L. Berg, H. Daume, J. Dodge, A. Goyal, X. Han, A. Mensch, M. Mitchell, A. Sood, K. Stratos, et al. Understanding and predicting importance in images. In CVPR, 2012.
- [12] X. Chen, H. Fang, T.-Y. Lin, R. Vedantam, S. Gupta, P. Dollár, and C. L. Zitnick. Microsoft coco captions: Data collection and evaluation server. arXiv preprint arXiv:1504.00325, 2015.
- [13] X. Chen and C. Lawrence Zitnick. Mind’s eye: A recurrent visual representation for image caption generation. In CVPR, 2015.
- [14] J. Chung, C. Gulcehre, K. Cho, and Y. Bengio. Empirical evaluation of gated recurrent neural networks on sequence modeling. arXiv preprint arXiv:1412.3555, 2014.
- [15] R. Dale and E. Reiter. Computational interpretations of the gricean maxims in the generation of referring expressions. Cognitive science, 1995.
- [16] X. Du, J. Shao, and C. Cardie. Learning to ask: Neural question generation for reading comprehension. arXiv preprint arXiv:1705.00106, 2017.
- [17] F. Faghri, D. J. Fleet, J. R. Kiros, and S. Fidler. Vse++: Improving visual-semantic embeddings with hard negatives. 2018.
- [18] H. Fang, S. Gupta, F. Iandola, R. K. Srivastava, L. Deng, P. Dollár, J. Gao, X. He, M. Mitchell, J. C. Platt, et al. From captions to visual concepts and back. In CVPR, 2015.
- [19] F. Ferraro, N. Mostafazadeh, L. Vanderwende, J. Devlin, M. Galley, M. Mitchell, et al. A survey of current datasets for vision and language research. arXiv preprint arXiv:1506.06833, 2015.
- [20] Y. Gong, Q. Ke, M. Isard, and S. Lazebnik. A multi-view embedding space for modeling internet images, tags, and their semantics. IJCV, 2014.
- [21] Y. Goyal, T. Khot, D. Summers-Stay, D. Batra, and D. Parikh. Making the v in vqa matter: Elevating the role of image understanding in visual question answering. In CVPR, 2017.
- [22] K. He, X. Zhang, S. Ren, and J. Sun. Deep residual learning for image recognition. In CVPR, 2016.
- [23] S. Hochreiter and J. Schmidhuber. Long short-term memory. Neural computation, 9(8):1735–1780, 1997.
- [24] M. Hodosh, P. Young, and J. Hockenmaier. Framing image description as a ranking task: Data, models and evaluation metrics. JAIR, 2013.
- [25] T.-H. K. Huang, F. Ferraro, N. Mostafazadeh, I. Misra, A. Agrawal, J. Devlin, R. Girshick, X. He, P. Kohli, D. Batra, et al. Visual storytelling. In NAACL-HLT, 2016.
- [26] A. Joulin, E. Grave, P. Bojanowski, M. Douze, H. Jégou, and T. Mikolov. Fasttext.zip: Compressing text classification models. arXiv preprint arXiv:1612.03651, 2016.
- [27] A. Karpathy and L. Fei-Fei. Deep visual-semantic alignments for generating image descriptions. In CVPR, 2015.
- [28] S. Kazemzadeh, V. Ordonez, M. Matten, and T. Berg. Referitgame: Referring to objects in photographs of natural scenes. In EMNLP, 2014.
- [29] D. P. Kingma and J. Ba. Adam: A method for stochastic optimization. ICLR, 2015.
- [30] R. Kiros, R. Salakhutdinov, and R. S. Zemel. Unifying visual-semantic embeddings with multimodal neural language models. NIPS Deep Learning Workshop, 2014.
- [31] C. Kong, D. Lin, M. Bansal, R. Urtasun, and S. Fidler. What are you talking about? text-to-image coreference. In CVPR, 2014.
- [32] R. Krishna, Y. Zhu, O. Groth, J. Johnson, K. Hata, J. Kravitz, S. Chen, Y. Kalantidis, L.-J. Li, D. A. Shamma, et al. Visual genome: Connecting language and vision using crowdsourced dense image annotations. IJCV, 2017.
- [33] G. Kulkarni, V. Premraj, V. Ordonez, S. Dhar, S. Li, Y. Choi, A. C. Berg, and T. L. Berg. Babytalk: Understanding and generating simple image descriptions. T-PAMI, 2013.
- [34] K.-H. Lee, X. Chen, G. Hua, H. Hu, and X. He. Stacked cross attention for image-text matching. ECCV, 2018.
- [35] A. Li, A. Jabri, A. Joulin, and L. van der Maaten. Learning visual n-grams from web data. ICCV, 2017.
- [36] R. Luo, B. Price, S. Cohen, and G. Shakhnarovich. Discriminability objective for training descriptive captions. In CVPR, 2018.
- [37] D. Mahajan, R. Girshick, V. Ramanathan, K. He, M. Paluri, Y. Li, A. Bharambe, and L. van der Maaten. Exploring the limits of weakly supervised pretraining. ECCV, 2018.
- [38] M. Malinowski, M. Rohrbach, and M. Fritz. Ask your neurons: A neural-based approach to answering questions about images. In ICCV, 2015.
- [39] I. Misra, R. Girshick, R. Fergus, M. Hebert, A. Gupta, and L. van der Maaten. Learning by asking questions. CVPR, 2018.
- [40] I. Misra, C. Lawrence Zitnick, M. Mitchell, and R. Girshick. Seeing through the human reporting bias: Visual classifiers from noisy human-centric labels. In CVPR, 2016.
- [41] M. Mitchell, X. Han, J. Dodge, A. Mensch, A. Goyal, A. Berg, K. Yamaguchi, T. Berg, K. Stratos, and H. Daumé III. Midge: Generating image descriptions from computer vision detections. In EACL, 2012.
- [42] N. Mostafazadeh, I. Misra, J. Devlin, M. Mitchell, X. He, and L. Vanderwende. Generating natural questions about an image. In ACL, 2016.
- [43] K. Papineni, S. Roukos, T. Ward, and W.-J. Zhu. Bleu: a method for automatic evaluation of machine translation. In ACL, 2002.
- [44] T. Pedersen, S. Patwardhan, and J. Michelizzi. Wordnet:: Similarity: measuring the relatedness of concepts. In Demonstration papers at HLT-NAACL 2004, pages 38–41. Association for Computational Linguistics, 2004.
- [45] B. A. Plummer, L. Wang, C. M. Cervantes, J. C. Caicedo, J. Hockenmaier, and S. Lazebnik. Flickr30k entities: Collecting region-to-phrase correspondences for richer image-to-sentence models. In ICCV, 2015.
- [46] S. Ren, K. He, R. Girshick, and J. Sun. Faster r-cnn: Towards real-time object detection with region proposal networks. In NIPS, 2015.
- [47] S. J. Rennie, E. Marcheret, Y. Mroueh, J. Ross, and V. Goel. Self-critical sequence training for image captioning. In CVPR, 2017.
- [48] B. Romera-Paredes and P. Torr. An embarrassingly simple approach to zero-shot learning. In ICML, 2015.
- [49] O. Russakovsky, J. Deng, H. Su, J. Krause, S. Satheesh, S. Ma, Z. Huang, A. Karpathy, A. Khosla, M. Bernstein, et al. Imagenet large scale visual recognition challenge. IJCV, 2015.
- [50] K. Shuster, S. Humeau, H. Hu, A. Bordes, and J. Weston. Engaging image captioning via personality. arXiv preprint arXiv:1810.10665, 2018.
- [51] R. Socher, A. Karpathy, Q. V. Le, C. D. Manning, and A. Y. Ng. Grounded compositional semantics for finding and describing images with sentences. T-ACL, 2014.
- [52] A. Suhr, S. Zhou, I. Zhang, H. Bai, and Y. Artzi. A corpus for reasoning about natural language grounded in photographs. 2018.
- [53] R. S. Sutton, D. A. McAllester, S. P. Singh, and Y. Mansour. Policy gradient methods for reinforcement learning with function approximation. In NIPS, 2000.
- [54] R. Vedantam, S. Bengio, K. Murphy, D. Parikh, and G. Chechik. Context-aware captions from context-agnostic supervision. In CVPR, volume 3, 2017.
- [55] R. Vedantam, C. Lawrence Zitnick, and D. Parikh. Cider: Consensus-based image description evaluation. In CVPR, 2015.
- [56] O. Vinyals, A. Toshev, S. Bengio, and D. Erhan. Show and tell: A neural image caption generator. In CVPR, 2015.
- [57] S. Xie, R. Girshick, P. Dollár, Z. Tu, and K. He. Aggregated residual transformations for deep neural networks. In Computer Vision and Pattern Recognition (CVPR), 2017 IEEE Conference on, pages 5987–5995. IEEE, 2017.
- [58] K. Xu, J. Ba, R. Kiros, K. Cho, A. C. Courville, R. Salakhutdinov, R. S. Zemel, and Y. Bengio. Show, attend and tell: Neural image caption generation with visual attention. In ICML, 2015.
- [59] P. Young, A. Lai, M. Hodosh, and J. Hockenmaier. From image descriptions to visual denotations: New similarity metrics for semantic inference over event descriptions. T-ACL, 2014.
- [60] L. Yu, P. Poirson, S. Yang, A. C. Berg, and T. L. Berg. Modeling context in referring expressions. In ECCV, 2016.
Supplementary Material
Appendix A Dataset Annotation
We present additional details on the annotation process we used for collecting COCO-BISON. We provided an overview of this process in Section 4.1 of the main paper.
A.1 Annotation Interfaces
In Stage 1 of the collection of COCO-BISON, we automatically identified pairs of semantically similar images in the COCO validation set (as described in the paper). In Stage 2 of the collection process, we asked human annotators to select a caption for each image pair that describes one image (the “positive” image) but not the other (the “negative” image). Figure 10 shows the annotation interface we used in Stage 2; the annotator used this interface to pick one of the five captions which distinguishes the positive image from the negative image. The five captions shown in the interface are the five captions associated with the positive image in the COCO Captions dataset [12]. The interface also provides a “none of the above” option that the annotator can select in case none of the five captions is discriminative. In Stage 3 of the dataset collection process, we performed verification of the annotations obtain in stage 2, by asking a new set of annotators to select the image that best matches the caption. The interface for the verification task is shown in Figure 11; it shows the positive and negative image (in random order) and the caption that the annotator in stage 2 selected for the positive image. The annotations collected in stage 3 are used to verify that the selected text query, indeed, distinguishes between the positive and the negative image.


A.2 Annotator Qualification Criteria
We use publicly available crowdsourcing platform to gather annotations for COCO-BISON. To ensure high quality annotations, we defined criteria the annotators must meet in order to contribute to collection of our dataset. Specifically, we require a annotator to have completed at least 500 tasks historically with an acceptance rate over , and is from a region that English is the native language. During the annotation process, we group the annotators into two separate groups that were responsible for the second and third stages of the dataset collection, respectively (as described in the paper); annotators could only provide annotations for one of the two stages. This strict separation between annotator groups prevents cases in which an annotator selects a caption in Stage 2 and then verifies their own annotation in Stage 3.
Stage 2 Instructions.
Annotators in stage 2 were presented with the following instructions:
Stage 3 Instructions.
Annotators in stage 3 were presented with the following instructions:
Statistics of Data Collection Process.
After stage 1 of the dataset collection, we obtained 67,564 pairs of a positive and a negative image. In stage 2, the annotators created 61,861 valid query-positive-negative triples, corresponding to a conversion rate of . For the remaining pairs of images, the annotators selected the “none of the above” option. In stage 3, we use two separate annotators to verify the query-positive-negative triple and obtained a total of query-positive-negative triples (conversion rate: ) that were confirmed to be correct by both the Stage 3 annotators. These triples form the COCO-BISON dataset. Table 5 summarizes key statistics about the annotators who performed the dataset collection.
| Stage 2 | Stage 3 | |
|---|---|---|
| Number of unique annotators | 173 | 254 |
| Average time per annotation (in sec.) | 25.9 | 12.7 |
Appendix B Details on Analyzing Systems and Measures
Annotation Interfaces for Human Evaluation of Generated Captions.
As discussed in the main paper (Section 3), we performed human evaluation on the captions generated by the UpDown [4] system on the COCO validation set. We followed the COCO guidelines for human evaluation [1] and measure “correctness” and “detailedness”. The corresponding annotation interface we used to gather correctness and detailedness annotations are shown in Figures 12 and 13, respectively. The instructions used in these interfaces were adopted literally from [1].


Details on Human Evaluation of Retrieval System.
Table 1 in the main paper showed the proportion of “mistakes” made by SCAN t2i [34] retrieval system that human annotator marked as correct. To the details of this study, we asked an expert annotator to example all the “R@5” mistakes SCAN t2i system has made (of which the rank of truth example is smaller than 10, to ease of performing annotation). The annotator is presented with all mistakes the system has made and asked to identify whether there exists a “mistakes” is correctly described by the text query.
Appendix C Comparing the COCO-BISON and
COCO Captions Datasets
Vocabulary Overlap with COCO Captions.
The captions in the COCO-BISON dataset contain a total of 10,800 unique words. By contrast, the COCO Captions validation set contains 18,545 distinct words. Note that, by construction, the vocabulary of COCO-BISON is a subset of the vocabulary of COCO Captions. Specifically, COCO-BISON contains of the COCO Captions vocabulary.
Discriminativeness of COCO-BISON Captions.
As described in the main paper, we performed experiments to quantitatively evaluate the “discriminativeness” of captions in COCO-BISON, compared to the original COCO Captions dataset. Specifically, given all (five) candidate COCO captions associated with an image, we evaluated the discriminativeness of (1) a Random Caption and (2) the Longest Caption among the five captions.
Concretely, we train the state-of-the-art caption based image retrieval system SCAN [34] and image captioning system UpDown [4] (details in Section D) on the standard COCO Captions training set and evaluate model’s BISON performance on COCO-BISON. The results are shown in Figure 14. The model’s matching performance on COCO-BISON is higher than that of Random Caption and Longest Caption. This result suggest that given the same model, the captions we collected in COCO-BISON are more discriminating between two semantically similar images. It is also worth noting that, by definition, the human performance on the BISON task is 100% due to the way the COCO-BISON dataset was collected.
Appendix D Implementation Details
We now describe the implementation details for the experiments in the main paper.
D.1 Image Features
As described in the paper, we follow [4] to obtain visual features using the object proposals from a Faster-RCNN [46] detection model. The ConvNet backbone is a ResNet-101 [22] pretrained on ImageNet. We train the detection model on the Visual Genome detection dataset (which contains annotations of different objects and attributes). This detection model is then used to obtain visual features for the input image. Specifically, we resize the short side of a image to pixels (keeping aspect ratio fixed) and get the object proposals for which the detector confidence is the highest. We then apply RoI pooling [46] to obtain the averaged -dimensional object features for each object proposal. This process results in a dimensional visual feature for each image.
D.2 Image Captioning Systems
ShowTell [56]:
We follow [56] and implement a LSTM [23]-based caption generator, using the following holistic visual feature. We extract am -dimensional image feature by averaging the object proposal features that are described above. A linear layer is applied to the resulting feature vector to obtain a -dimensional holistic image feature, which is then fed into the caption-decoding LSTM as its first input word embedding. The parameters in the word embeddings of the LSTM caption decoder are initialized by random sampling from a uniform distribution over the domain .
ShowAttTell [58, 47]:
We follow [58] and implement a LSTM-based caption generator using the object proposal features and attention mechanism. The overall architecture is similar to [58]; we adopt the modification suggested by [47] and input the attention-derived image features to the cell node of the LSTM. Concretely, during the decoding of each words, an attention vector is computed based on the hidden state of the caption-decoding LSTM. The attention weights are then used to compute a weighted combination of the object proposal features into a -dimensional feature vector. This averaged feature is then input into the memory cell of the LSTM, in conjunction with the previous word embeddings, to decode the caption [47].
UpDown [4]:
We implement the model proposed in [4] using two LSTMs: one for generating top-down attention that combines object proposal features, and one for generating the caption. Herein, the base image features used are the same -dimensional features as in the ShowAttTell model. During the caption decoding, the computed attentional features are concatenated with the word embedding of the previous word in the caption, and input to the LSTM used for caption decoding.
Training and Optimization.
For each of the above systems, we report two sets of results. The first set of results was obtained by minimizing a cross-entropy loss (XE) for 30 epochs. The second set results was obtained by finetuning the cross-entropy-trained models using self-critical sequence training (SCST) [47] for an additional 30 epochs with REINFORCE [53] over CIDEr [55] metrics. During the finetuning, we used Adam [29] optimizer with an initial learning rate of and a batch size of .
Using Captioning Systems for the BISON Task.
To use image-captioning algorithms to perform the BISON task, we compute the compatibility score of an image and caption by computing the log-likelihood of a caption given the associated image. A downside of this approach is that it tends to assign lower likelihood values to longer captions. To account for this, we normalize the compatibility score by dividing the log-likelihood by the caption length.
D.3 Image Retrieval Systems
We first describe the architecture of each of our image-retrieval systems, and then describe the process used to train these systems separately.
ConvNet+BoW.
We use two embedding networks to embed the image and text features into a joint embedding space. We use a one-hidden-layer multi-layer perceptron (MLP) to reduce the (-dimensional) averaged object proposal features (as described above) to dimensions. For the text features, we compute average word embeddings of the caption and apply another MLP to embed the text features into the same space. As before, the word embeddings are initialized randomly. For both the image and the text MLP, the dimensionality of the hidden layer is and a ReLU non-linearity is used. The system outputs the inner product between the image and caption features to measure the relevance of the image to the caption.
ConvNet+Bi-GRU [30, 17].
This baseline embeds image features using a MLP in the same fashion as ConvNet+BoW. Different from ConvNet+BoW, a recurrent model (namely, a one-layer bidirectional GRU [14] (Bi-GRU) in our case) is used to map the word features into the same embedding space. In this Bi-GRU, the embedding is formed by (1) the average of last time step’s output in the forward direction and (2) the first time step’s output in the backward direction. The hidden dimensionality of the Bi-GRU is because it is used to directly transform sequence of word embeddings to the joint embedding space.
OBJ+Bi-GRU.
Unlike ConvNet+Bi-GRU, which takes the averaged object proposal features, this baseline uses a recurrent model as an aggregation function. Concretely, it uses a Bi-GRU to aggregate the dimensional visual feature into a feature vector of dimensions. We input each object proposal feature into the Bi-GRU at each time step (36 steps in total; ordered by confidence of the object proposal) to obtain the dimensional embedding. Similarly, a text Bi-GRU is used to embed the sequential word feature into the same embedding space.
SCAN [34].
We followed [34] to build this state-of-the-art image-text matching system with object proposal features and stacked cross-attention. We implement two variants of the SCAN system, namely, a variant with image-to-text attention (i2t) and a variant with text-to-image attention (t2i). We refer the reader to [34] for complete details.
Training and Optimization.
We follow [17] to train the embedding networks for image and text, using a max-margin loss with hard negative mining. We use the Adam [29] optimizer for all methods. For ConvNet+BoW, ConvNet+Bi-GRU and OBJ+Bi-GRU, we use a learning rate of with a batch size of . Note that the max-margin objective we used is sensitive to the batch size. For SCAN, we followed the hyper-parameter setting provided by [34], with a learning rate of and temperatures of for t2i variant and for i2t variant. We chose the average function as the aggregation function for SCAN. Please refer to [34] for details.
Appendix E Effect of Visual Features
In this section, we provide additional results evaluating our image captioning and image retrieval systems using different sets of visual features.
Visual Features.
We study the effect of varying the visual features by using two different ConvNets – ResNet-IN [22] and ResNeXt-IG-3.5B [37]. ResNet-IN [22] corresponds to the feature activations of the penultimate layer of a 101-layer deep residual network that was pre-trained on the ImageNet. ResNeXt-IG-3.5B [37] corresponds to the feature activations of penultimate layer of a 101-layer ResNeXt model [57] that was pre-trained on a weakly-supervised dataset of 3.5 billion images and corresponding hashtags. Using both networks, we first compute the convolutional feature corresponding to a input image. This feature is then reshaped to dimensions to replace the object proposal features we mentioned before.
Results.
Table 6 and Table 7 report the BISON, image captioning, and image retrieval performances of systems using the aforementioned visual features. Comparing the results in these two tables with those in the main paper, we observe that using the ResNeXt-IG-3.5B feature [37] provides a boost in performance for all systems across all the evaluation measures.
| Dataset | COCO validation split | COCO-BISON | |||
|---|---|---|---|---|---|
| Measure | BLEU-4 | CIDEr | SPICE | METEOR | BISON |
| Cross-entropy loss | |||||
| with ResNet-IN Feature [22] | |||||
| ShowTell [56] | 29.07 | 88.80 | 16.89 | 23.87 | 74.04 |
| ShowAttTell [58] | 32.09 | 99.30 | 18.47 | 25.24 | 79.32 |
| UpDown [4] | 31.87 | 99.82 | 18.67 | 25.34 | 81.39 |
| with ResNeXt-IG-3.5B Feature [37] | |||||
| ShowTell [56] | 33.08 | 102.41 | 18.84 | 25.97 | 81.85 |
| ShowAttTell [58] | 34.00 | 106.28 | 19.81 | 26.50 | 82.95 |
| UpDown [4] | 34.74 | 108.54 | 20.41 | 26.91 | 84.64 |
| Self-critical sequence loss [47] | |||||
| with ResNet-IN Feature [22] | |||||
| ShowTell [56] | 29.65 | 91.63 | 17.27 | 24.35 | 74.76 |
| ShowAttTell [58] | 32.06 | 100.24 | 18.71 | 25.36 | 79.91 |
| UpDown [4] | 32.63 | 102.35 | 19.00 | 25.83 | 81.84 |
| with ResNeXt-IG-3.5B Feature [37] | |||||
| ShowTell [56] | 33.37 | 104.18 | 19.30 | 26.39 | 82.13 |
| ShowAttTell [58] | 34.19 | 107.22 | 19.99 | 26.64 | 83.39 |
| UpDown [4] | 34.75 | 109.51 | 20.49 | 27.15 | 84.87 |
| Human [1] | 100.00 | ||||
| Dataset | COCO-1K [27] | COCO-BISON | |||
|---|---|---|---|---|---|
| Task | Image retrieval | Caption retrieval | |||
| Measure | R@1 | R@5 | R@1 | R@5 | BISON |
| with ResNet-IN Feature [22] | |||||
| ConvNet+BoW | 40.12 | 74.79 | 51.36 | 81.36 | 77.96 |
| ConvNet+Bi-GRU [30] | 43.61 | 78.14 | 55.30 | 84.16 | 78.90 |
| Obj+Bi-GRU | 47.68 | 81.66 | 60.44 | 89.08 | 80.40 |
| SCAN i2t [34] | 36.89 | 72.76 | 59.08 | 86.82 | 78.45 |
| SCAN t2i [34] | 47.06 | 80.18 | 62.12 | 89.28 | 82.25 |
| with ResNeXt-IG-3.5B Feature [37] | |||||
| ConvNet+BoW | 51.86 | 82.07 | 64.06 | 89.24 | 83.47 |
| ConvNet+Bi-GRU [30] | 53.85 | 84.75 | 65.38 | 90.18 | 84.23 |
| Obj+Bi-GRU | 51.90 | 83.98 | 63.78 | 89.18 | 82.24 |
| SCAN i2t [34] | 57.41 | 86.86 | 68.62 | 92.72 | 86.66 |
| SCAN t2i [34] | 57.13 | 85.95 | 69.28 | 92.38 | 86.14 |
Appendix F Details on Analyzing Systems with BISON
In this section, we provide the complete details to the analysis we performed to evaluate systems with BISON (cf. Section 6 in the main paper)
F.1 Details of Alteration on Text-query.
We describe the details about the alteration we performed to the query text of a BISON triplet, which is unique to BISON evaluation.
Negation.
To a negate query text, we first perform a Part-of-Speech (POS) tagging to identify the word type of each word in the sentence with NLTK toolkit. Then we perform one step negation by adding not to the first verb word detected in the sentence. Heuristic regular expressions are applied to make sure that the resulting query text is a coherent English sentence. Next, this altered query text is used to evaluate a system on the original BISON pair of images. We show the proportion of changes in the systems’ decisions and show them in Figure 9 in the main text. We observe that only a relatively small proportion of the system’s decisions are changed, though the logical meaning of query is negated in most cases. A potential interpretation is that both caption systems and retrieval systems are not sensitive to the logical operation of negation.
Synonym & Hypernym.
For the alteration of synonym and hypernym substitution, we first perform the Part-of-Speech (POS) tagging with NLTK toolkit. Then we ground all the nouns and verbs to the WordNet [44] synsets of the same word type and find the corresponding synonyms or hypernyms (we use the first lemma of the found synonyms/hypernyms). Next, during the alteration, we randomly sample one noun or verb and substitute it with one of its synonyms or hypernyms.
Permutation.
For the permutation alteration, we randomly permutate all the words within a sentence of the query text (Note that we exclude special word tokens such as “<bos>” or “<eos>”). We found that captioning systems are much more sensitive to the word order whereas retrieval systems are less affected by this word permutation.
Reverse.
In addition to the random permutation, we further study the scenario in which the word order is exactly reversed (special word tokens are not affected). We observe that this causes more changes to the decisions of captioning systems.
F.2 Analysis of Query Alteration on More Systems.
We provide the same analysis to more captioning and retrieval systems and show the results as Figure 15.
 |
 |
 |


