Sensitivity to sterile neutrino mixing using reactor antineutrinosJournal: Eur. Phys. J. C
Abstract
The reactor antineutrinos are used for the precise measurement of oscillation parameters in the 3-neutrino model, and also used to investigate active-sterile neutrino mixing sensitivity in the 31 neutrino framework. In the present work, we study the feasibility of sterile neutrino search with the Indian Scintillator Matrix for Reactor Anti-Neutrino (ISMRAN) experimental set-up using electron antineutrinos() produced from reactor as a source. The so-called 31 scenario is considered for active-sterile neutrino mixing, which leads to projected exclusion curves in the sterile neutrino mass and mixing angle plane. The analysis is performed considering both the reactor and detector related parameters. It is found that, the ISMRAN set-up can observe the active-sterile neutrino mixing sensitivity for 0.064 and = 1.0 eV2 at 90 confidence level for an exposure of 1 ton-year by using neutrinos produced from the DHRUVA reactor with thermal power of 100 MWth. It is also observed that, there is a significant improvement of the active-sterile neutrino mixing parameter to 0.03 at the same by putting the ISMRAN detector set-up at a distance of 20 m from the compact proto-type fast breeder reactor (PFBR) facility with thermal power of 1250 MWth.
1 INTRODUCTION
The phenomena of neutrino oscillation have been established by several experiments using neutrinos from both natural (atmospheric and solar) and man-made (reactor and accelerator) sources. It shows the mixing between flavor and mass eigenstates, hence established that neutrinos have non-zero masses. Presently, the study of neutrino physics is in the precision era. However, experimental observations from various short baseline (SBL) experiments cannot be explained by 3-neutrino mixing paradigm which requires new additional neutrino called as ‘sterile neutrino’. So the concept of this sterile neutrino could explain the results from GALLEX GALLEX and SAGE SAGE Gallium experiments, find a deficit in neutrino flux while calibrating the detectors with radioactive sources. They have reported that the ratio of numbers of observed to predicted events is 0.880.05 Abdurashitov:2005tb and it is known as “Gallium anomaly”. The accelerator based SBL experiments such as Liquid Scintillator Neutrino Detector (LSND) Aguilar:2001ty at a baseline of 30 m observed an unexplained excess of electron anti-neutrinos () in a muon anti-neutrino beam. The MiniBooNE experiment also observed similar excess in mode Aguilar-Arevalo:2013pmq. The recent MiniBooNE data are consistent with the excess of events reported by the LSND. The significance of the combined analysis of both the experiments is an excess of 6.0 Aguilar-Arevalo:2018gpe. There is an anomalous behavior has also been observed in the measurement of the reactor flux and spectrum. The precise energy spectrum of antineutrino flux produced by the reactors are recalculated by Mueller Mueller:2011nm which shows a significantly about 6 higher than experimental measurements at small distance. This discrepancy between the predicted and observed reactor antineutrino flux is known as the “reactor antineutrino anomaly” (RAA) Mention:2011rk. There are basically two possible explanations for this discrepancy. One is the incomplete reactor models or nuclear data due to underestimated systematics of the measurements of beta spectra emitted after fission Feilitzsch1982; Schreckenbach1985; Hahn1989 or of the conversion method Mueller:2011nm; Huber:2011wv; Hayes2016; Huber2016. The other explanation is an oscillation of into a fourth light sterile neutrino. Moreover, measurements of the reactor spectra show a discrepancy compared to predictions, particularly at energies of 5 MeV. The discrepancy in spectra is confirmed by RENO RENO:2015ksa, Daya BayAn:2015nua, Double Chooz Abe:2015rcp, and NEOS Ko:2016owz collaborations by measuring the reactor energy spectrum. The distortion in energy spectra has been correlated to the reactor power An:2015nua, which may be due to the 235U fuel An:2017osx. In order to verify the existence of active to sterile neutrino oscillation hypothesis as the possible origin of the RAA and, also to clarify the origin of the bump at 5 MeV in the spectra, there are several experiments underway and some will take data soon.
To address the RAA, the SBL experiments are aiming to measure the reactor spectrum at two or more different distances and trying to reconstruct the survival probability both as a function of energy and source to detector distance, . independent of any reactor model prediction. The dependence is what gives the cleanest signal in the case of the sterile neutrino, and studying the ratio of the spectra measured at two different distances allows to avoid the problem of the theoretical spectrum. The DANSS group has performed the experiment at 3 distances from reactor core varied from 10.7 m to 12 m to find out the active-sterile neutrino mixing by measuring the positron energy spectra. They have observed that the excluded area in the plane covers a wide range of the sterile neutrino parameters up to 0.01 Alekseev:2018efk. Similarly, the STEREO Almazan:2018wln group has measured the antineutrino energy spectrum in six different detector cells covering baselines between 9 and 11 meters from the compact core of the ILL research reactor. Their results are compatible with the null oscillation hypothesis and the best fit of the reactor antineutrino anomaly is excluded at 97.5 confidence level. Recently, PROSPECT group has measured the reactor spectra using a movable segmented detector array and their observation disfavors the RAA best fit point at 2.2 C.L. and constrains significant portions of the previously allowed parameter space at 95 confidence level Ashenfelter:2018iov.
This paper presents the results of an investigation on finding a possible mixing of a single sterile neutrino with the 3 known active neutrinos, the (3 1) model. It is the only allowed active-sterile neutrino mixing scheme Gariazzo:2017fdh under the assumption of 4 neutrino model. At SBL, the presence of sterile neutrinos with squared mass difference 1 eV2 leads to fast oscillations resulting the reduction of reactor flux, otherwise absent in the standard 3-neutrino paradigm. This study quantifies the sensitivity of Indian Scintillator Matrix for Reactor Anti-Neutrino (ISMRAN) experimental set-up in constraining the active-sterile neutrino mixing parameters. In this work, we have considered various reactor ( thermal power, core size, duty cycle, burn up) as well as detector response related parameters ( energy resolution and detection efficiency) and also at several reactor core to detector distance while constraining active-sterile neutrino mixing at an exposure of 1 ton-year.
The outline of the paper is as follows. A detailed description of the ISMRAN detector set-up and the neutrino detection principle is discussed in Sec. 2 and in Sec. 3, respectively. The sterile neutrino oscillation formalism is introduced in Sec. 4. The incorporation of detector resolutions on neutrino induced true events is discussed in Sec. 5. The statistical analysis using both oscillated and without oscillated events based on estimation is given in Sec. 6. The sensitivity to sterile neutrino mixing at an exposure of 1 ton-yr is discussed in Sec. 7. Finally, in Sec. 8, we summarize our findings and discuss the implication of this work.
2 ISMRAN DETECTOR
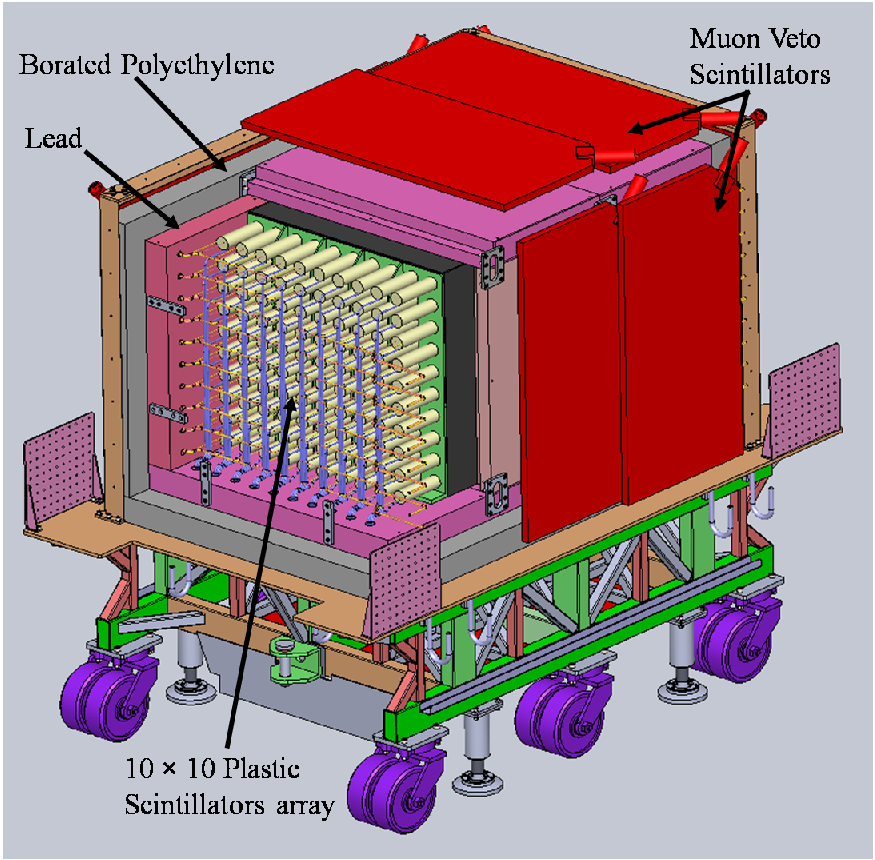
The ISMRAN experimental set-up is being developed for detecting reactor , searching for possible existence of sterile neutrino and monitoring of reactor power at the DHRUVA reactor facility in Bhabha Atomic Research Centre (BARC), India. The ISMRAN detector set-up will consist of an array of 100 plastic scintillator (PS) bars with weight of about 1 ton Mulmule:2018efw. The dimension of each PS bar is 100 cm10 cm10 cm wrapped with Gadolinium coated aluminized mylar foils. Each PS bar is coupled with two 3” Photo-multiplier tubes at both ends. The schematic of the detector set-up is shown in Fig. 1. The advantage of the ISMRAN set-up is that, it is compact in size and maneuvered from one place to another easily. Also the segmented detector array can provide the additional position information while reconstructing the neutrino induced events and can improve the active sterile neutrino mixing sensitivity of the ISMRAN detector. To suppress both the natural and reactor related background, detectors are covered by a passive shielding material Lead (for gamma rays) of 10 cm thick and then followed by 10 cm thick of borated polyethylene (for neutrons). The detector is positioned at a distance of 13 m from the center of a cylindrical reactor core and can be moved closer to the core upto 7 m. The reactor has radius 1.5 m and height 3.03 m (defined as an extended source) Agarwal:dhruva. The reactor can operate at a maximum thermal power of 100 MWth consuming natural uranium as fuel and producing about 1019 /s. In future, it is planned to put the detector set-up at proto-type fast breeder reactor (PFBR) facility, IGCAR, Kalpakkam, India Chetal:pfbr. The PFBR has dimension of about 1 m both in radius and height (defined as a compact source), and can operate at a maximum thermal power of 1250 MWth. As the reactor is compact and produces higher thermal power, it is an ideal case to utilize the detector set-up for investigating the active-sterile neutrino mixing. With this experimental set-up, it can be possible to confirm or reject the existence of a light sterile neutrino by measuring the flux and energy spectra. At present a proto-type ISMRAN set-up of 1/5-th of the final detector volume which is under operation at DHRUVA reactor facility Mulmule:2018efw.
3 DETECTION PRINCIPLE
The electron-antineutrinos produce from the reactor interact with protons in the PS bars, via the Inverse Beta Decay (IBD) process,
| (1) |
The Q-value of the above reaction is about 1.80 MeV and hence it limits the detection of antineutrinos. The positron which carries almost all of the available energy, loses it by ionization process in the detector and gets annihilated producing two gammas. The energy loss of the positron constitutes the ‘prompt’ signal along with the Compton scattered annihilated gammas given by
| (2) |
where E is the energy of electron-antineutrino. So from Eq. 2, it is observed that there is a one-to-one correspondence between the positron energy and . The neutron produced in Eq. 1 carries a few keV’s of energy and gets thermalized in collisions with protons in the PS bar. The neutron takes about 180 in order to gets captured by proton in the PS bar produces gamma ray which is considered as a delayed signal. To further decrease the neutron captured time and improve the detector efficiency, PS bars are wrapped with Gadolinium coated aluminized mylar foil which has very high neutron captured cross-section. Further, the neutron captured time reduces to about 30–40 and a cascade of gamma rays produce with total energy 8 MeV due to Gadolinium. The coincidence of a prompt positron signal and a delayed signal from neutron captured by Gadolinium (Gd) uniquely identifies the IBD event.
4 NEUTRINO OSCILLATION PROBABILITY WITH 3 1 MODEL
The sterile neutrino oscillation probabilities are based on expansion of the 3 generation Pontecorvo-Maki-Nakagawa-Sakata (PMNS) Maki:1962mu matrix to 31 generation, where “3” stands for three active neutrinos (, , ) and “1” for a sterile neutrino (). The neutrino flavors and mass eigenstates are related through
| (3) |
where is a unitary mixing matrix. In this analysis the following parametrization for has been considered
| (4) |
where are the (complex) rotation matrices, are the mixing angles with = 1, 2, 3, 4; and the order of rotation angles are considered as given in Ref. Palazzo:2013bsa. Using the above definition, the flavor change can be described as a function of the mixing matrix elements and masses in terms of the neutrino oscillation probability
| (5) |
where , correspond to , , , s; = with , is the source to detector distance in ‘meter’ and is the energy of neutrinos in ‘MeV’. The oscillation probabilities for antineutrinos can be obtained by replacing mixing matrix elements s with its complex conjugate (s). Since Eq. 4 is independent of the CP-violating phases as they are not observable at SBL reactor setups, the third term in Eq. 5 will be zero Palazzo:2013bsa. For a small value of mixing angle and source to detector distance of few meters ( 100 m), the oscillation from 33 mixing parameters can be neglected. Hence, the electron antineutrino survival probability in Eq. 5 is approximated to
| (6) |
The analysis of 31 generation is reduced to that of two flavor framework with the oscillation parameters and are given by
| (7) |
where = .
5 SIMULATION PROCEDURE
| Element | |||||||
|---|---|---|---|---|---|---|---|
| 235U | 0.58 | 4.367 | -4.577 | 2.1 | -0.5294 | 0.06186 | -0.002777 |
| 239Pu | 0.30 | 4.757 | -5.392 | 2.63 | -0.6596 | 0.0782 | -0.003536 |
| 241Pu | 0.05 | 2.99 | -2.882 | 1.278 | -0.3343 | 0.03905 | -0.001754 |
| 238U | 0.07 | 4.833 | 1.927 | -1.283 | -6.762 | 2.233 | -1.536 |
The active-sterile neutrino mixing sensitivity of ISMRAN set-up will be explored at DHRUVA as well as PFBR reactor facilities. The number of neutrinos produced from the reactor depends on the thermal power. It is essential to know the fuel compositions contributing to the thermal power of the reactor. In order to estimate the number of induced events produced in the detector, assumed parametrization for antineutrino flux considered in the analysis is as follows
| (8) |
where ‘’ is the fractional contribution from th isotope to the reactor thermal power,‘’s are the constant term used to fit the neutrino spectrum and is neutrino energy in MeV. For DHRUVA reactor, we have assumed that the fractional contribution for each isotope to the reactor thermal power as given in Ref.Zhan:2008id and the list of parameters used to fit the spectrum due to 235U, 239Pu and 241Pu are considered from Ref. Huber:2011wv and for 238U is taken from Ref. Mueller:2011nm. The list of parameters used in this analysis are listed in Table 1. Similarly, for PFBR we have considered the fractional contributions due to 235U and 239Pu are 70% and 30%, respectively Schneider. We have also considered the neutrino flux variation due to a finite size cylindrical reactor which depends on its radius and height as follows neu_flux,
| (9) |
where is flux at the center of the reactor core, and are the physical radius and height of the cylinder, respectively, is the zeroth order Bessel function of first kind with () and z () are the vertex position of the produced neutrinos in the reactor. The leading order interaction cross-section Vogel:1999zy of for the IBD process is given by
| (10) |
where = is the positron energy with neglecting recoil neutron energy and is the positron momentum. It can be mentioned here that the neutrino is a neutral particle and can not be detected directly. In the detector we measure the neutrino induced charged particle, for the present case it is . The detector resolution on true positron energy (kinetic) spectrum is incorporated assuming a standard Gaussian form of the energy resolution:
| (11) |
Here and are true and the measured positron energy, respectively. The detector resolution considered in this study is in the form of 20/. In the analysis, the neutrino induced events are distributed in terms of positron energy spectrum. We have considered total 80 bins in the energy range of 0–8 MeV. The number of events in -th energy bin after incorporating the detector resolution is given as
| (12) |
The index corresponds to the measured energy bin and corresponds to the number of reconstructed events, is summed over the true energy of positron and is the number of events in -th true energy bin. Further, being the integral of the detector resolution function over the bins and is given by
| (13) |
The integrations are performed between the lower and upper boundaries of the measured energy ( and ) bins. After incorporating detector energy resolution on neutrino induced events, both unoscillated and oscillated event distributions as a function of energy are shown in Fig. 2 assuming 25 of the detection efficiency, 80 fiducial volume of the detector, 70 reactor duty cycle and, for an exposure of 1 ton-year while placing ISMRAN set-up at a distance of 13 m from the reactor core. The neutrino oscillation probability from one flavor to another not only depends on precise measurement of the source to detector distance but also on energy of neutrinos. The uncertainty in distance traveled by neutrino should be less than the oscillation wavelength in order to avoid a washout of the oscillation signal. Figure 3 shows the comparison of oscillated to unoscillated event ratios with and without incorporating the detector resolution as well as varying the source to detector distance as a function of . Oscillated events are estimated by considering best fit values of active-sterile neutrino mixing parameter at = 0.062 and = 1.7 eV2 Gariazzo:2017fdh. In Fig. 3, the black dotted line shows the event ratios in an ideal case without incorporating the detector response and at a fixed source to detector distance. The red solid line shows the event ratios by considering a cylindrical reactor core where the position of the reactor core is generated using a Monte-Carlo method and point detector. It is observed that with the variation of source to detector distance, the neutrino oscillation probability washed out as compared to fixed path length. Also by varying the path length due to random vertices of reactor core and incorporating the detector resolution on neutrino energy spectrum, the oscillation probability has further washed out as shown by blue dashed line. It is to be mentioned here that rest of the studies are performed using the randomized vertex in the reactor core and 80% fiducial volume of the detector.


6 SENSITIVITY ESTIMATION OF SIMULATED DATA
In order to quantify the sensitivity of ISMRAN experimental set-up to the active-sterile neutrino mixing parameters and , we perform the statistical analysis of event distribution for an exposure of 1 ton-year. After incorporating the detector response on the number of events estimated by considering with and without active-sterile neutrino oscillation, the sensitivity to the sterile neutrino mixing parameters has been obtained by calculating the . To determine the exclusion limit for a given confidence interval at each value of we have scanned over the values of to simulate active-sterile neutrino oscillated event spectrum, and determine the boundary of the corresponding (e.g. = 4.61 for 90% confidence limit(C.L.)). The can be defined as follows pu
| (14) |
where is the number of energy bins, , are with oscillated and without oscillated (or theoretically predicted) events, respectively. The carries the information about systematic uncertainties given by
| (15) |
with being the strength of the coupling between the pull variable and . Equation (14) is minimized with respect to pull variables. Four systematic uncertainties such as 3 normalization uncertainty (including reactor total neutrino flux, number of target protons, and detector efficiency), nonlinear energy response of the detector by 1, uncertainty in energy calibration by 0.5. We have also considered the possibility of an uncorrelated experimental bin-to-bin systematic error of 2 which could result from insufficient knowledge of some source of background Huber:2003pm.


7 RESULTS AND DISCUSSIONS
The active-sterile neutrino mixing sensitivity depends on various reactor and detector parameters. As mentioned earlier the reactor related parameters are such as the thermal power, its fuel components, duty cycle and the core size. Apart from the reactor parameters, active-sterile neutrino mixing sensitivity also depends on detector mass, its fiducial volume, energy resolution, and detection efficiency. The simulation has been carried out by varying above mentioned parameters while finding the active-sterile neutrino mixing sensitivity as discussed below.

7.1 DETECTOR RESPONSE
The oscillation probabilities of depend on the active-sterile neutrino mixing parameters such as angle and squared mass difference. The sensitivity of both these parameters depends on detector response such as resolution and efficiency. The upper limit for the active-sterile neutrino mixing angle for an exposure of 1 ton-yr is shown in Fig. 4 at 90 C.L. in the - plane considering different detector resolutions, = 5%–25/. The analysis is carried out considering reactor thermal power of 100 MWth produced from the extended reactor core and at 70 of its duty cycle. The detector is placed at a distance of about 13 m from the center of the reactor core. The detector has better active-sterile neutrino mixing sensitivity for resolution of = 5%. It is observed that at eV2, active-sterile neutrino mixing sensitivity is independent of detector resolution whereas for higher eV2, the active-sterile neutrino mixing sensitivity improves by 23% for the detector resolution of 5% from 25% at = 1.0 eV2. Here it is to be mentioned that the precision on the is controlled by the precise measurement of energy (and also ) for individual events which depends on the resolution of the detector. Further studies are carried out considering the detector resolution of = 20 (which is the energy resolution of the PS obtained from the measurements) Mulmule:2018efw. We have also studied the active-sterile neutrino mixing angle, sensitivity by varying the detector efficiencies from 20 to 50 as shown in Fig 5. It is observed that the sensitivity on improves with increase of detector efficiency for eV2 and has less impact beyond this value. For higher values of the oscillation probability washed out. From this study, it is concluded that with better detector response, we will have better sensitivity in both the active-sterile neutrino mixing parameters sin and . In the subsequent analyses, we have used energy resolution as = 20%/ and efficiency of 25% unless otherwise stated.
7.2 REACTOR CORE TO DETECTOR DISTANCE
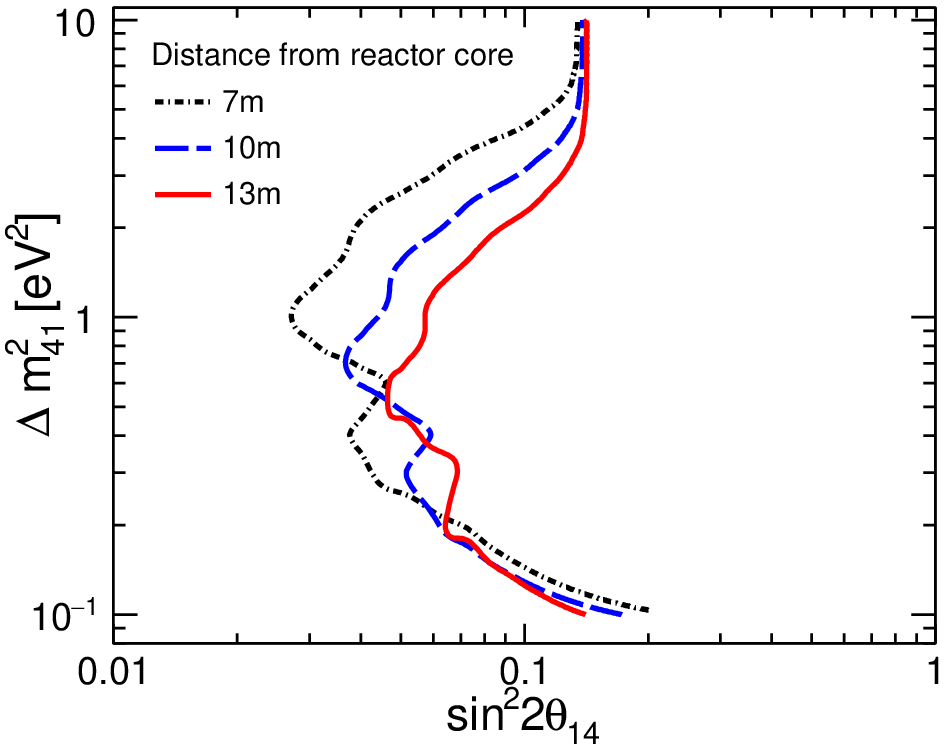
The distance between the reactor and the detector is not uniquely defined because of the extended reactor core such as DHRUVA reactor. Figure 6 shows the active-sterile neutrino mixing sensitivity at source to detector distances of 7 m, 10 m, and 13 m. These distances correspond the center to center distance between the reactor core and center of the detector. In our calculation neutrino vertices are generated randomly in the reactor core using MC method and assumed a point detector, for a given energy resolution, thermal power (100 MWth) and, duty cycle of 70%. The lower limit on source to detector distance (7 m) is based on the closest accessible baseline available to place the detector. It can be observed that at = 1.0 eV2, the active-sterile neutrino mixing sensitivity improves by 53 for the path length of 7 m from 13 m. In addition, one can maximize the event statistics and experimental sensitivity by placing the detector close to the reactor, however there is a trade-off between distance, other shielding material structures surrounding the reactor core and associated reactor background. The green dashed-dot line shows the sensitivity on mixing parameters by considering extended source as well as detector with centre to centre distance between reactor core and detector is 13 m. Both neutrinos production and their interaction point in the detector are generated on MC basis. Hence the the closest neutrinos can have a path of less than 11 m and the farthest ones oscillate for more than 15 m for given both the detector and reactor geometries. It is found that with extended detector, the sensitivity of the ISMRAN further reduces in the range of 0.3 eV2 4.0 eV2 as compared to case with extended source and point detector placed at distance of 13 m.
7.3 REACTOR POWER AND DUTY CYCLE
The antineutrino flux emitted from the reactor is proportional to its operating thermal power. The DHRUVA research reactor Agarwal:dhruva can operate at a maximum thermal power of 100 MWth, where as PFBR power reactor Chetal:pfbr can operate at a maximum thermal power of 1250 MWth which is an order of magnitude higher than research reactor. Figure 7 shows the comparison of exclusion limits on - plane at various reactor thermal power of 60 MWth, 100 MWth, and 1250 MWth for 1 ton-yr of detector exposure time at a distance of 13 m. With the increase in thermal power, there is an increase in event statistics hence increase in sensitivity of the experiment at all .


Due to the operation of the nuclear reactors below than its maximum thermal output and reactor-off period, the total event statistics gets affected. Hence, sensitivity of the sterile neutrino oscillation decreases with lower duty cycle. Figure 8 shows the active-sterile neutrino mixing sensitivity of the detector at reactor duty-cycles of 50%, 70% and 90% for source to detector distance of 13 m and, 100 MWth reactor (extended source) thermal power. It is observed that the active sterile neutrino mixing sensitivity improves with the duty cycle for 2.0 and beyond this there is no effect. This is due to the averaging out of oscillation probabilities at higher .
7.4 REACTOR FUEL
Above studies are carried out assuming time averaged constant fission fraction contributions of various fuel elements as mentioned in Table 1 to the thermal power. However, the study has also been carried out considering the time evolution of the fissile fraction contribution to the reactor thermal power. The time evolution of nuclear reactor depends on its fuel cycles which can go from about a month to one or two years. In each of the new cycle, a partial or complete fuel is replaced with fresh fuel, which is typically composed by enriched 235U. At the beginning of each reactor cycle, the flux comes mainly from the fission of 235U, with a small contribution of 238U isotope. The neutron flux produced from the fission helps to produce 239Pu and a small quantity of 241Pu. Hence, as 235U is consumed with time, then its contribution to the flux decreases, whereas the contributions from 239Pu and 241Pu increase. However, the dominant contribution comes from the 239Pu, which is comparable with the 235U towards the end of each cycle Giunti:2017yid. Since our reactor is of CANDU type, we have used the burn-up as given in Ref. Francis. Figure 9 shows the comparison of active-sterile neutrino mixing exclusion limits between fixed fission fraction Zhan:2008id and with the fission fraction variation due to burn up of the fissile element Francis at reactor thermal power 100 MWth for source to detector path lengths of 7 m and 13 m. It has been observed that the burn up variation of reactor fuel has marginal effect on the active-sterile neutrino mixing sensitivity for all considered values of for this assumed fuel cycle. However, burn-up effect may be observed for longer duration of fuel cycle. Also we have shown the effect of fuel cycle which is assumed to be 100 days in our case, on the active-sterile neutrino mixing and it shows a similar sensitivity with respect to time variation reactor burn up.


7.5 BACKGROUNDS
The active-sterile neutrino mixing sensitivity has been obtained with inclusion of backgrounds with an assumption of signal to background ratio is 1. In the analysis, three different cases of background has been considered such as the default 1/ shape represents the spectral shape provided by accidental backgrounds due to contribution from intrinsic detector radioactivity, a flat distribution in antineutrino energy due to fast neutron backgrounds Heeger:2012tc and the combination of both these backgrounds shown in Fig. 10(a). In this study, an associated 10 systematic uncertainty is considered due to these backgrounds. Figure 10(b) shows the comparison of ISMRAN detector sensitivity with and without inclusion of different backgrounds. It is observed that with the contribution of both backgrounds, the active-sterile neutrino mixing angle sensitivity is further reduced by 20 at = 1.0 eV2 for the case of detector placed at 13 m from the 100 MWth DHRUVA reactor core.
7.6 COMPARISON TO THE OTHER MEASUREMENTS
The exclusion limits at 90% C.L. on the value for each obtained from the ISMRAN set-up at two different reactors are shown in Fig. 11. It can be noted here that the analysis has been carried out by smearing both the extended source and detector volumes. Neutrinos production in the reactor core and their interaction in the detector are generated on MC basis. The upper panel shows the results obtained assuming the detector set-up placed at distance of 7 m and 13 m from the core of DHRUVA reactor and the lower panel shows sensitivity of the detector by placing at different distances in the PFBR facility. Measurements from other experiments such as, the NEOS Ko:2016owz, the Daya Bay Adamson:2016jku, Bugey-3 Declais:1994su, STEREO Almazan:2018wln and the symbol ‘’ is the present best fit value from the global analysis Gariazzo:2017fdh are also shown for comparison at 90 C.L. The results from ISMRAN at a distance of 13 m from DHRUVA reactor core is comparable to the NEOS results at lower 2 eV2, at higher our results are comparable with the Bugey results and outperform the Daya Bay results for 2 eV2. At a distance of 7 m from the reactor core and 1 eV2, the results from ISMRAN are comparable with NEOS and Bugey. The ISMRAN has better sensitivity on the active-sterile neutrino mixing with respect to STEREO Almazan:2018wln. The exclusion plot from the Daya Bay Adamson:2016jku experiment at lower values of = 0.1 eV2 has better sensitivity compared to ISMRAN and also other measurements. However, it is found that the active-sterile neutrino sensitivity of ISMRAN improves substantially if the measurement will be carried out at PFBR facility as shown in Fig. 11(b). The ISMRAN results at a distance of 20 m from the reactor core are comparable to NEOS and Bugey at all values of and exclusion limits are better for 2 eV2. It is to be noted that NEOS measurements are performed at a distance of 24 m from the reactor core with thermal power of about 3 GWth. Although the reactor power of PFBR is lower compared to reactor used for NEOS measurements, the results from ISMRAN at PFBR can give a better sensitivity as compared to other measurements. This is due to the compact core size of the PFBR facility.
8 SUMMARY
In the near future, results form various SBL experiments using reactor neutrino as
a source may resolve the uncertainty for the existence of light sterile neutrino
hypothesis as the possible origin of the RAA and in addition it may clarify the
origin of the 5 MeV distortion in the energy spectra. The
feasibility study on active-sterile neutrino mixing sensitivity is performed
with the upcoming ISMRAN experimental set-up for an exposure of 1 ton-year employing
produced from the extended core of DHRUVA and compact core of PFBR
reactor facility, India. The study is carried out considering both reactor as well as
detector related parameters. With varying the source to detector distance of 7m from
13m at = 1.0 eV2, the sensitivity on
improves by twice. It has been observed that, the burn-up variation of the
reactor fuel elements has very less impact on active-sterile neutrino mixing
sensitivity. At reactor power of 100 MWth produced from DHRUVA reactor, the
experimental set up may see the active-sterile neutrino mixing sensitivity if
0.064 at = 1.0 eV2.
On the otherhand, there is an improvement on the active-sterile
neutrino mixing parameter to 0.03 for the same
by putting the ISMRAN detector set-up at PFBR facility.
We have found the limit on active-sterile neutrino mixing parameters is of the same
order as that of Bugey. However, in the range of 0.2 eV 3.0
eV2, the present analysis for DHRUVA reactor predicts the same sensitivity limits
as that of the results from NEOS. Further, the sensitivity at lower values of 0.2 eV2, we may have better sensitivity compared to NEOS. With
the ISMRAN set-up, it can be possible to verify the existence of active to sterile
neutrino oscillation hypothesis as the possible origin of the RAA and, also
to clarify the origin of the bump at 5 MeV in the spectra.
ACKNOWLEDGMENTS
We thank A. K. Mohanty, V. M. Datar and Anushree Ghosh for their helpful suggestions and useful discussions. We also thank ISMRAN group members for useful discussion.
References
- (1) P. Anselmann et al. [GALLEX Collaboration], Phys. Lett. B 342, 440 (1995), Phys. Lett. B 420, 114 (1998).
- (2) D. N. Abdurashitov et al., Phys. Rev. Lett. 77, 4708 (1996); J. N. Abdurashitov et al. [SAGE Collaboration], Phys. Rev. C 59, 2246 (1999).
- (3) J. N. Abdurashitov et al., Phys. Rev. C 73, 045805 (2006).
- (4) A. Aguilar-Arevalo et al. [LSND Collaboration], Phys. Rev. D 64, 112007 (2001).
- (5) A. A. Aguilar-Arevalo et al. [MiniBooNE Collaboration], Phys. Rev. Lett. 110, 161801 (2013).
- (6) A. A. Aguilar-Arevalo et al. [MiniBooNE Collaboration], Phys. Rev. Lett. 121, no. 22, 221801 (2018).
- (7) T. A. Mueller et al., Phys. Rev. C 83, 054615 (2011).
- (8) G. Mention, M. Fechner, T. Lasserre, T. A. Mueller, D. Lhuillier, M. Cribier and A. Letourneau, Phys. Rev. D 83, 073006 (2011).
- (9) F. von Feilitzsch, A. A. Hahn, K. Schreckenbach, Phys. Lett. B 118, 162 (1982).
- (10) K. Schreckenbach, G. Colvin, W. Gelltely, F. von Feilitzsch, Phys. Lett. B 160, 325 (1985).
- (11) A. A. Hahn, K. Schreckenbach, W. Gelletly, F. von Feilitzsch, G. Colvin, B. Krusche, Phys. Lett. B 218, 365 (1989).
- (12) P. Huber, Phys. Rev. C 84, 024617 (2011).
- (13) A. C. Hayes, P. Vogel, Ann. Rev. Nucl. Part. Scien. 66, 219 (2016).
- (14) P. Huber, Nucl. Phys. B 908, 268 (2016).
- (15) J. H. Choi et al. [RENO Collaboration], Phys. Rev. Lett. 116, 211801 (2016).
- (16) F. P. An et al. [Daya Bay Collaboration], Phys. Rev. Lett. 116, 061801 (2016).
- (17) Y. Abe et al. [Double Chooz Collaboration], JHEP 1601, 163 (2016).
- (18) Y. J. Ko et al., Phys. Rev. Lett. 118, 121802 (2017).
- (19) F. P. An et al. [Daya Bay Collaboration], Phys. Rev. Lett. 118, 251801 (2017).
- (20) I. Alekseev et al. [DANSS Collaboration], arXiv:1804.04046 [hep-ex].
- (21) H. Almazán et al. [STEREO Collaboration], Phys. Rev. Lett. 121, 161801 (2018).
- (22) J. Ashenfelter et al. [PROSPECT Collaboration], arXiv:1806.02784 [hep-ex].
- (23) S. Gariazzo, C. Giunti, M. Laveder and Y. F. Li, JHEP 1706, 135 (2017).
- (24) D. Mulmule et al., Nucl. Instrum. Meth. A 911, 104 (2018).
- (25) S. K. Agarwal, C. G. Karhadkar, A. K. Zope and Kanchhi Singh, Nuclear Engineering and Design 236, 747 (2006).
- (26) S. C. Chetal et al. , Nuclear Engineering and Design 236, 852 (2006).
- (27) Z. Maki, M. Nakagawa and S. Sakata, Prog. Theor. Phys. 28, 870 (1962).
- (28) A. Palazzo, JHEP 1310, 172 (2013).
- (29) L. Zhan, Y. Wang, J. Cao and L. Wen, Phys. Rev. D 78, 111103 (2008).
- (30) M. Schneider, Science & Global Security, 17, 36 (2009).
- (31) S. Glasstone and A. Sesonske, “Nuclear Reactor Engineering”, Springer US, (1994). DOI: 10.1007/978-1-4615-2083-2, ISBN: 9781461520832
- (32) P. Vogel and J. F. Beacom, Phys. Rev. D 60, 053003 (1999).
- (33) M. C. Gonzalez-Garcia and M. Maltoni, Phys. Rev. D 70, 033010 (2004).
- (34) P. Huber, M. Lindner, T. Schwetz and W. Winter, Nucl. Phys. B 665, 487 (2003).
- (35) C. Giunti, X. P. Ji, M. Laveder, Y. F. Li and B. R. Littlejohn, JHEP 1710, 143 (2017).
- (36) M.W. Francis, C.F. Weber, M.T. Pigni, and I.C. Gauld, Reactor Fuel Isotopics for Nuclear Applications, ORNL/TM-2014/464, Oak Ridge National Laboratory, Oak Ridge, TN, September 2014. hyper link: https://info.ornl.gov/sites/publications/Files/Pub52057.pdf
- (37) K. M. Heeger, B. R. Littlejohn, H. P. Mumm and M. N. Tobin, Phys. Rev. D 87, 073008 (2013).
- (38) P. Adamson et al. [Daya Bay and MINOS Collaborations], Phys. Rev. Lett. 117, 151801 (2016).
- (39) Y. Declais et al., Nucl. Phys. B 434, 503 (1995).