On the episodic excursions of massive protostars in the Hertzsprung-Russell diagram
Abstract
Massive protostars grow and evolve under the effect of rapid accretion of circumstellar gas and dust, falling at high rates (-). This mass infall has been shown, both numerically and observationally, to be episodically interspersed by accretion of dense gaseous clumps migrating through the circumstellar disc to the protostellar surface, causing sudden accretion and luminous bursts. Using numerical gravito-radiation-hydrodynamics and stellar evolution calculations, we demonstrate that, in addition to the known bloating of massive protostars, variable episodic accretion further influences their evolutionary tracks of massive young stellar objects (MYSOs). For each accretion-driven flare, they experience rapid excursions toward more luminous, but colder regions of the Hertzsprung-Russell diagram. During these excursions, which can occur up to the end of the pre-main-sequence evolution, the photosphere of massive protostars can episodically release much less energetic photons and MYSOs surreptitiously adopt the same spectral type as evolved massive (supergiants) stars. Each of these evolutionary loop brings the young high-mass stars close to the forbidden Hayashi region and might make their surrounding H ii regions occasionally fainter, before they recover their quiescent, pre-burst surface properties. We interpret such cold, intermittent pre-main-sequence stellar evolutionary excursions and the dipping variability of HII regions as the signature of the presence of a fragmenting circumstellar accretion disc surrounding the MYSOs. We conjecture that this mechanism might equivalently affect young stars in the intermediate-mass regime.
Keywords:
methods: numerical – stars: evolution – stars: circumstellar matter – stars: flares.1 Introduction
| () | () | () | |||
|---|---|---|---|---|---|
| Run-100-hydro | Episodic | Full hydrodynamical simulation with variable rate | |||
| Run-100-constant | Constant | Hydrodynamical simulation (collapse) + constant analytic rate (disc) | |||
| Run-100-smoothed | Smoothed | Hydrodynamical simulation (collapse) + smoothed burst-free rate (disc) | |||
| Run-100-compact | Episodic | As Run-100-hydro, with more compact initial conditions | |||
| Run-60-hydro | Episodic | Full hydrodynamical simulation with variable rate |
Gravitationally-collapsing pre-stellar cores give birth to new young stars, which grow by mass accretion of surrounding molecular material. The rates at which protostars gain mass have been shown to exhibit such a diversity that the initial picture of isotropic collapse (Larson 1969; Shu 1977) fails to explain the observed spread in accretion rates (Vorobyov 2009). Meanwhile, variations of the protostellar accretion rate can induce enormous changes in protostellar luminosity, the most extreme manifestations of which are the so-called FO-Orionis and the very low luminosity objects (Vorobyov et al. 2017). Numerical simulations have demonstrated that this is possible thanks to the presence of a self-gravitating circumstellar accretion disc prone to gravitational fragmentation (Vorobyov & Basu 2005; Vorobyov & Basu 2010; Vorobyov & Basu 2015; Machida & Matsumoto 2011; Zhao et al. 2018; Nayakshin & Lodato 2012; Vorobyov & Elbakyan 2018).
The disc fragmentation scenario equivalently applies to star formation in the high-mass regime. Numerical simulations predicted the formation of accretion discs around massive young stellar objects (Bonnell et al. 1998; Yorke & Sonnhalter 2002; Peters et al. 2010; Seifried et al. 2011), together with additional structures such as bipolar cavities filled with ionizing radiation generated by the UV feedback of the protostars (Harries 2015; Klassen et al. 2016; Harries et al. 2017). Accretion variability is a direct consequence of asymmetries in the accretion flow (Seifried et al. 2011) and of the coupling between the prostellar radiation feedback and its surrounding disc (Peters et al. 2010). Such variability is a generic feature of massive star formation in the sense that it is neither stopped by the radiation pressure in the bipolar H ii regions (Peters et al. 2010) nor by disc fragmentation (Meyer et al. 2018). Other studies on massive star formation also reported time-variabilities of the disc-to-star mass transfer rate (Krumholz et al. 2009; Rosen et al. 2016). In addition, self-gravitating discs around high-mass stars are subject to efficient gravitational instabilities, generating heavy spiral arms in which dense gaseous clumps form, eventually leading to the formation of multiple hierarchical systems (Krumholz et al. 2007; Peters et al. 2010). These circumstellar clumps can either rapidly migrate onto the stellar surface, trigger increases of the protostellar accretion rate which aggravate the variability (Meyer et al. 2018) and produce luminous bursts (Meyer et al. 2017) or evolve to secondary low-mass stars which finally end up as low-mass spectroscopic companions to the MYSOs (Meyer et al. 2018). Accretion bursts are a feature of the formation of young massive stellar objects which seems common to most massive protostars as it does not depend on the initial properties of their parent pre-stellar core (Meyer et al. 2018). Moreover, although these eruptive phases represent a small fraction () of their early formation time, MYSOs can acquire a substential fraction of their zero-age-main-sequence (ZAMS) mass via these flaring episods (Meyer et al. 2018).
From the point of view of observations, (variable) accretion flows (Keto & Wood 2006; Stecklum et al. 2017) and ionized, pulsed, collimated structures (Cunningham et al. 2009; Cesaroni et al. 2010; Caratti o Garatti et al. 2015; Purser et al. 2016; Reiter et al. 2017a; Burns et al. 2017; Burns 2018; Purser et al. 2018; Samal et al. 2018) underlined the scaled-up character of massive star formation with respect to low-mass stars (Fuente et al. 2001; Testi 2003; Cesaroni et al. 2006; Stecklum et al. 2017, see also). A growing number of observations of (Keplerian) discs around MYSOs have been reported (Johnston et al. 2015; Ilee et al. 2016; Forgan et al. 2016; Ginsburg et al. 2018), together with evidences of a spiral filament feeding the candidate disc MM1-Main (Maud et al. 2017) and an infalling gaseous clump in the double-cored system G350.69-0.49 (Chen et al. 2017). Interestingly, a recent ALMA view of the massive young object G023.01-00.41 exhibited a clear disc-jet association (Sanna et al. 2018). In addition, some objects revealed the presence of high-mass proto-binary systems within a circumbinary disc (Kraus et al. 2017). Finally, several MYSOs experienced multi-wavelengths flares (Moscadelli et al. 2017; Cesaroni et al. 2018) in a fashion of the predictions of Meyer et al. 2017, among which are the accretion-bursts of S255IR NIRS 3 (Fujisawa et al. 2015; Stecklum et al. 2016; Caratti o Garatti et al. 2016) and from NGC6334I-MM1 (Hunter et al. 2017) experienced accretion-driven outbursts.
Early stellar evolution calculations demonstrated the dominant influence of accretion on the internal stellar structure prior to the ZAMS phase (Palla & Stahler 1991). The formation of a radiative barrier that turns the fully convective stellar embryo into a stable radiative core and an outer convective shell that causes the star to swell has been shown in the context of young intermediate-mass stars for a wide range of different constant accretion rates (Palla & Stahler 1992; Palla & Stahler 1993; Beech & Mitalas 1994; Bernasconi & Maeder 1996; Bernasconi 1996). A monotonically increasing accretion rate yields similar results (Behrend & Maeder 2001). Calculations with high-rate mass accretion exceeding equivalently showed that disc-accreting young massive stellar objects have their pre-main-sequence evolution governed by the accretion of circumstellar material, see Bernasconi & Maeder 1996; Norberg & Maeder 2000; Behrend & Maeder 2001; Hosokawa & Omukai 2009; Hosokawa et al. 2010. These models reported a rapid swelling of the protostars up to radii produced by the so-called luminosity wave (Larson 1972), an internal redistribution of entropy following the abrupt decrease of the opacity in the protostellar interior. Interestingly, for the constant accretion rates , the protostars evolve to the red part of the Hertzsprung-Russell diagram (Hosokawa et al. 2010; Haemmerlé et al. 2016). The authors postulate therein that the H ii region generated by those stars can then disappear as their protostellar radius bloats, ultimately leading to lower-luminosity young massive stellar objects. Simultaneous hydrodynamical and stellar evolution calculations revealed that variable-accreting MYSOs can experience a unique loop to the red before recovering their bluer characteristics and reach the ZAMS (Kuiper & Yorke 2013). However, those 2.5-dimensional axisymmetric simulations do not account for disc fragmentation physics and its influence on the protostellar variability (Meyer et al. 2017) and the corresponding rates were burstsless. More complex theoretical studies tackled the problem of the impact of various feedback mechanisms of MYSOs onto star formation efficiency, however, without considering their accretion variability (Tanaka et al. 2018).
Motivated by the above arguments, we aim at investigating the effects of the repetitive accretion events responsible for luminous bursts on the evolution of pre-main-sequence young massive stellar objects. With the help of three-dimensional gravito-radiation-hydrodynamics models of collapsing rotating massive pre-stellar cores, we first simulate the formation and evolution of fragmenting circumstellar accretion discs from which protostars gain mass (Meyer et al. 2018). From the disc models, we extract variable accretion rate histories, interspersed by episodic accretion bursts caused by dense gaseous clumps that form in spiral arms and rapidly migrate onto the protostars (Meyer et al. 2017). Finally, we calculate stellar evolution models with the Geneva stellar evolutionary code (Eggenberger et al. 2008; Haemmerlé 2014) fed by our accretion rate histories. Using the method developed in the context of constant-accreting MYSOs (Haemmerlé et al. 2016; Haemmerlé et al. 2017) and accretion flows onto large-scale H ii regions (Haemmerlé & Peters 2016), we calculate the changes in the internal structure and the surface properties of MYSOs experiencing bursts.
In this paper, we investigate the effects of variable accretion on the evolution of MYSOs. We perform numerical gravito-radiation-hydrodynamics simulations and stellar evolution calculations of pre-main-sequence accreting massive stellar objects to explore the effects of strong accretion bursts onto their internal as well as their surface properties and evolutionary path in the Hertzsprung-Russell diagram. This study is organized as follows. In Section 2, we review the methods utilised to perform (i) gravito-radiation-hydrodynamical simulations of the monolithic collapse of present-day rotating pre-stellar cores, from which we extract accretion rate histories, and (ii) stellar evolutionary calculations of MYSOs which accrete from their circumstellar discs at pre-calculated time-variable rates. Our results are presented in Section 3, the effects of the initial conditions on the stellar excursions are investigated in Section 4, and our findings further discussed in Section 5. Particularly, we highlight that strong outbursts provoke rapid excursions towards colder regions of the Herztsprung-Russel diagram, which typically are not associated with such hot and young stellar objects. Finally, we discuss our results and conclude in Section 6.
2 Modelling
In the following paragraphs, we introduce the reader to the method employed to carry out our gravito-radiation-hydrodynamical simulations of high-mass star formation, from which we extract time-dependent protostellar accretion rate histories. Furthermore, we detail how the outputs of the hydrodynamical models are subsequently used as boundary conditions for stellar evolution calculations.
2.1 Hydrodynamical simulations
Our three-dimensional midplane-symmetric hydrodynamical simulations are initialized with a rigidly-rotating spherically symmetric, pre-stellar core of density distribution , with (Butler & Tan 2012; Butler et al. 2014) and is the radial coordinate. The inner edge of the core is made of a semi-permeable sink cell centered onto the origin of the computational domain and the outer edge of the core, at , is assigned to the outflow boundary conditions. We map the domain with a mesh of grid zones, logarithmically expanding along the -direction, as a cosine in the polar -direction, and uniformly spaced along the azimuthal -direction. As in Meyer et al. 2018, we use a size of the sink cell of , which is larger than that of the first paper of this series (Meyer et al. 2017) in order to reach longer integration times , while avoiding very restrictive Courant-Friedrich-Levy conditions on the time-step within the direct protostellar surroundings. We simulate the gravitational collapse of several pre-stellar cores with different initial masses Mc. Each core forms a central protostar and a massive circumstellar disc. The accretion rate from the disc onto the protostar is computed as the rate of mass transport through the sink cell. The pre-stellar core temperature is uniformly set to and its rotational-by-gravitational energy ratio is set to a typical value of (Meyer et al. 2017). The models are run until the mass of the central star becomes equal to one third that of the initial mass core . The characteristics of our models are summarised in Tab. 1.
To solve the evolution of the above described physical system, we numerically integrate the equations of gravito-radiation-hydrodynamics with the pluto code11 1 http://plutocode.ph.unito.it/ (Mignone et al. 2007; Mignone et al. 2012). Our method takes into account the direct irradiation of the protostar and radiation transport in the accretion disc within the gray approximation using the scheme of Kolb et al. 201322 2 http://www.tat.physik.uni-tuebingen.de/ pluto/pluto_radiation/ adapted following the prescriptions of Meyer et al. 2018, see also equivalent radiation-hydrodynamics methods implementations in e.g. Commerçon et al. 2011, Flock et al. 2013 and Bitsch et al. 2014. The photospheric photons are first ray-traced from the stellar atmosphere and propagate by flux-limited diffusion into the circumstellar disc. Such method permits to treat the disc thermodynamics accurately, with its central heating together with the outer cooling of the discs, as predicted by Vaidya et al. 2011. Opacities and calculation of the dust properties are as in Meyer et al. 2018, i.e. estimated by assuming that disc silicate grains are in equilibrium with the total radiation field. The gravitational force includes the gravity of the growing young massive star and the self-gravity of the gas, the latter computed using the prescriptions of Black & Bodenheimer 1975 and the implementation method inspired by Hirano et al. 201733 3 https://shirano.as.utexas.edu/SV.html by time-dependently solving the Poisson equation with the help of the PETSC library44 4 https://www.mcs.anl.gov/petsc/. We assume that the angular momentum transport in the disc is essentially produced by the spiral arms in the discs and we therefore do not include additional turbulent -viscosity (Meyer et al. 2018).
2.2 Stellar evolution calculations
We used our accretion rate histories to compute the evolutionary tracks of our MYSOs in the Hertzsprung-Russel diagram. The one-dimensional stellar evolution calculations were performed with the hydrostatic Geneva code, the original version of which (Eggenberger et al. 2008) has recently been updated for disc accretion physics in the context of pre-main-sequence massive protostars (Haemmerlé 2014). The code was tested in the context of constant-accreting MYSOs (Haemmerlé et al. 2016, see details relative to the numerical scheme and the implementation method in) and showed full consistency with the original results on high-constant-rate accreting MYSOs of Hosokawa et al. 2010. Accretion is treated within the so-called cold disc accretion scenario (Palla & Stahler 1992), which assumes that the inner disc region is geometrically thin when the accreted material reached the stellar surface. Hence, we follow the mass growth of the hydrostatic core (i.e., the protostar), without considering a spherical envelope during the accretion phase (Palla & Stahler 1992). Subsequent theoretical and numerical works demonstrated that such assumption is fully reasonable (Vaidya et al. 2011; Meyer et al. 2018). Any entropy excess is radiated away in direction perpendicular to the disc and it is channeled into the radiatively-driven outflow associated to young massive stars (Harries et al. 2017). The circumstellar material is advected inside the protostar assuming that its thermal properties are similar to those of the suface layer of the MYSOs.
Since we assume that most of the energy produced by the accretion shock (not modelled in the calculations) is radiated away before it reaches the protostellar surface, no additional entropy from the liberation of gravitational energy is added to the surface of the star. Such an assumption is the lower limit on the entropy attained by the star during the accretion process, while the upper limit is the so-called spherical (or hot) accretion scenario, scenario, in which a fraction of accretion entropy is added to the star, see the sketch in fig. 1 of Hosokawa et al. 2010. We choose the cold scenario as it has recently been used in the context of accreting H ii regions (Haemmerlé & Peters 2016). Calculations of the stellar structure are performed with the Henyey method within the Lagrangian formulation (Haemmerlé 2014) at solar metallicity (Z=0.014) using the abundances of Asplund et al. 2005 and Cunha et al. 2006 and the deuterium mass fractions of Norberg & Maeder 2000 and Behrend & Maeder 2001. The simulations make use of the Schwarzschild criterion for convection, overshooting is considered and they are initialised with fully convective stellar embryo because they are the most difficult models to bloat (Haemmerlé et al. 2016; Haemmerlé & Peters 2016). Hence, our method threats the stellar swelling most conservatively, avoiding any artificial effects that can lead to excessive swelling. To facilitate the stellar evolution calculations, we average the accretion rate histories over a time period of . This excludes the smallest variabilities. However, one can justify such an assumption as we know that high accretion rates () responsible for protostellar bloating are exclusively reached during the strongest and longest accretion bursts (Meyer et al. 2017; Meyer et al. 2018).
3 Results
This section presents the accretion rate histories of our MYSOs and investigates the effects of the accretion of dense gaseous clumps on the structure and evolutionary path of high-mass protostars in the Hertzsprung-Russell diagram.
3.1 Accretion rate histories
Fig. 1 shows the accretion rate histories onto the MYSOs forming during the gravitational collapse of (a) and (b) pre-stellar cores, respectively. The accretion rates (in ) are plotted as a function of time (in ), from the beginning of the collapse to the end of the simulation when . The thin black vertical line marks the onset of disc formation when the free-collapsing material of the envelope begins to land on a centrifugally balanced circumstellar disc instead of keeping on directly falling onto the protostellar surface. From this time instance on, the protostar starts gaining mass via accretion from the disc. The thick, solid lines represent the accretion rate onto the young high-mass stars while the dashed lines are the corresponding protostellar masses (in ). Furthermore, we indicate by the orange circles the time instance when the MYSOs enter the high-mass regime (). We run two distinct hydrodynamical simulation with (model Run-100-hydro) and with (model Run-60-hydro), and in order to particularly investigate the effects of the accretion spikes on the protostellar evolution, we construct additional accretion rate histories by modifying the accretion rate of our model Run-100-hydro (our Table 1), by keeping constant the final mass of and either (i) imposing a constant rate once the disc has formed (model Run-100-constant, see black lines of Fig. 1a) or (ii) filtering out the accretion spikes (model Run-100-smoothed, see red lines of Fig. 1a) with a method similar to that described in Vorobyov & Basu 2015.
The free-fall collapse of the molecular pre-stellar core produces an initial infall of material through the sink cell increasing the accretion rate during the first -, up to reaching the canonical value of at which MYSOs are predicted to accrete (Hosokawa & Omukai 2009). Once the disc has formed (see vertical thin line of Fig. 1), variability immediately develop in the accretion flow as a direct consequence of important anisotropies in the protostellar surroundings (Meyer et al. 2018). The variations amplitude in the accretion rate continues increasing up to being interspersed by violent accretion spikes becoming more numerous and more intense as a function of time. They are regularly generated by the rapid migration of massive disc fragments forming in its outer region by gravitational fragmentation and falling onto the protostellar surface, provoking sudden increases of the accretion rate. Those dense gaseous clumps detached from spiral arms developing in the self-gravitational discs are responsible for violent accretion-driven luminosity bursts (Meyer et al. 2017). Such mechanism is connected to the formation of spectroscopic binary companions to the protostars, as long as the clumps sufficiently contract in the core and heat up beyond the dissociation temperature of molecular hydrogen (Meyer et al. 2018). The protostellar mass evolution reflects the accretion history from the disc in the sense that to each strong accretion events () corresponds a step-like increase of the stellar mass (Meyer et al. 2017). The integration time of model Run-60-hydro is longer () than that of Run-100-hydro () because we perform the simulations up to the time instance when . This is longer in the case of the lower mass pre-stellar core () since the mass infall onto the disc is intrinsically smaller.
3.2 Stellar structure evolution
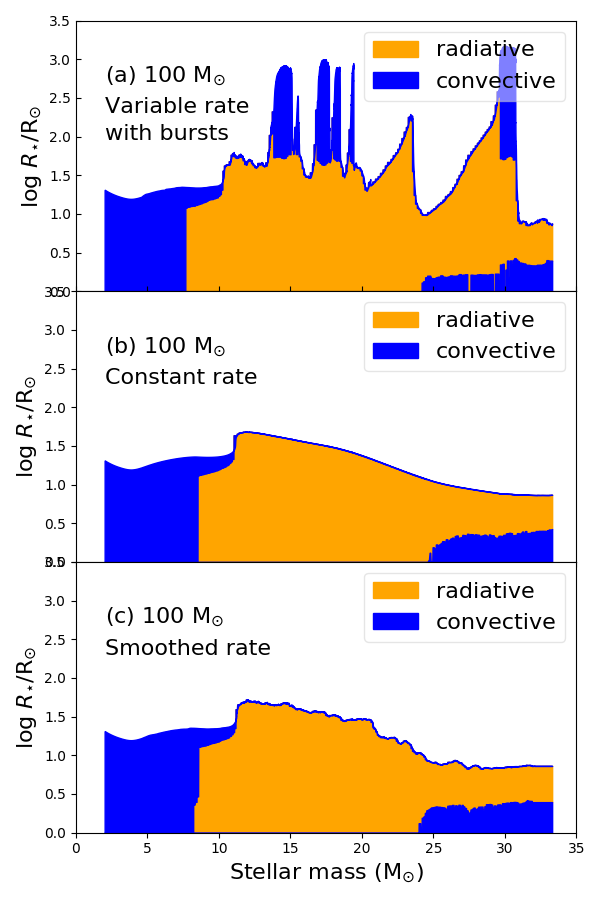
Fig. 2 plots the evolution of the stellar structure of our protostars as a function of the stellar age for our models with , distinguishing from different accretion histories. The figure indicates, in addition to the temporal variations in photospheric radius, the convective (blue) and radiative (orange) regions of the protostar, respectively. The protostars are initially fully convective (blue regions) with an internal temperature profile too cold to ignite Deuterium burning. As its center heats up by gravitational contraction, a radiative core forms and grows in mass while rapidly expanding towards the stellar surface once the Deuterium fuel is out. The accreting stars further evolve once energetic photons are released out of the radiative core and propagate upwards to be absorbed by the still cold and convective enveloppe. During the gradual diminishing of the convective envelope thickness (when the protostars of our Run-100-hydro is , see Fig. 2a) concludes the phase transition from radiative to convective stellar interior. As the protostellar mass increases, the the so-called luminosity wave mechanism takes place (Larson 1972). We illustrate in Fig. 3 the development of the luminosity wave of the growing protostar in our model Run-100-hydro. A maximum in the luminosity profile forms (Fig. 3a) and moves outwards until it reaches the stellar surface and adopts a strictly monotonically increasing shape, i.e. the luminosity gradient is positive everywhere (Fig. 3c). The energy equation of the stellar structure reads as,
| (1) |
where , , and are the internal luminosity, mass, temperature and specific entropy radial profiles. It implies that interior to the luminosity peak (at ) the entropy of the star decreases with time, i.e.,
| (2) |
while exterior to the luminosity peak (at ) the entropy of the star increases with time, i.e.,
| (3) |
Therefore, the entropy of the surface layers () increase as they absorb energy triggering the stellar bloating, whereas when the peak reaches the stellar surface at all the layers lose entropy and the protostar contracts. Each time a violent accretion event with an accretion peak of deposits mass to the star, an other luminosity maximum sets in the interior (Fig. 3b) and the luminosity wave forms again in the upper layers of the protostar (Fig. 3d), provoking a new swelling episod. Our model with gives similar results.
Fig. 4 presents two characteristic timescales, which are usually used to describe the evolution of accreting protostars, and reports their time evolution next to the accretion rate history and the protostellar mass evolution. More specifically, the figure plots the so-called accretion timescale,
| (4) |
representing the characteristic timescale of mass growth of the accreting star (thin dashed red lines), and the Kelvin-Helmholtz timescale,
| (5) |
related to the entropy loss through radiation (thick solid blue lines). The protostar begins accreting at a variable rate once the disc forms (thick red lines), with at times when their evolution is only governed by disc accretion instead of mass infall from the pre-stellar core. During the gravitational collapse and the early disc evolution, the protostars evolve by gaining entropy by advection, with negligible radiative loss (, see Fig. 4b,d). Note that our model Run-100-hydro is already a MYSOs when the first burst happens, whereas our model Run-60-hydro experiences its first swelling as an intermediate-mass star (thin solid line of Figs. 4a,c). Once the photospheric luminosity has grown enough, the energy loss governs the protostellar evolution ( because throughout the bursts) and , which means that can be neglected (see Section 3.4). Interestingly, the protostars experience episods with at the same time instance of the swelling. The MYSOs intermittently see their evolution ruled by mass accretion (the bloating) before recovering a more classical evolution governed by energy losses (the unswelling). This repeats each time an accretion burst happens. Therefore, each accretion-driven burst corresponds to a swelling episod of the MYSOs followed by a redistribution of the internal entropy restoring the internal thermal equilibrium.
3.3 Evolution of the surface properties of the MYSOs
In Fig. 5, we show the evolution of the protostellar iternal photospheric luminosity (a), radius (b), and effective temperature (c) as a function of the stellar age of our MYSOs. The Figure distinguishes between the variable-accreting models with a pre-stellar core (thin solid blue lines) and with a pre-stellar core (thick dashed red line), respectively. We assume that the MYSOs are black-bodies, therefore, the photospheric luminosity is estimated as,
| (6) |
where is the Stefan-Boltzman constant. The stellar surface properties does not evolve much during the free-fall gravitational collapse onto the MYSOs and the early phase of the disc formation, at times . Only a moderate and monotonical increase of the stellar radius and corresponding photospheric luminosity occurs, as the deuterieum burning maintains the central temperature nearly constant (Fig. 5a). When the variations of the accretion rate substantially increase in response to the growing strength of gravitational instability and fragmentation in the circumstellar disc, the protostar grows faster, and, after the first luminosity wave, its surface becomes radiative so that any episodic deposit of mass on it generates an augmentation of the effective temperature and the surface luminosity. With one important exception, the time evolution of stellar surface properties is similar to what was found in the context of calculations carried out with a constant accretion rate – the photospheric luminosity (Fig. 5a) and effective temperature (Fig. 5c) generally increase, while the stellar radius decreases (Fig. 5b) for as long as the star remains in the quiescent accretion phase. However, this monotonic behaviour is interspersed with brief excursion events associated with violent accretion bursts, during which the MYSOs adopt opposite photospheric properties by becoming bigger and cooler. Such a behaviour of and is a direct consequence of the changes in the internal structure of the MYSOs, which is sensitive to the accretion rate. In the next section, we demonstrate how the variable accretion rate with episodic bursts can affect the evolutionary path of MYSOs in the Hertzsprung-Russell diagram.
3.4 Pre-main-sequence excursions in the Hertzsprung-Russell diagram
Fig. 6 shows the evolutionary tracks of our MYSOs in the Hertzsprung-Russell diagram. More specifically, the evolution of the central star in the model with a pre-stellar core was calculated using a variable (thin blue line), constant (thick dashed red line) and smoothed (thick black line) accretion rates and are plotted in panel (a) together with the zero-age-main-sequence (ZAMS) track of Ekström et al. 2012. The tracks of the central stars in the models with different pre-stellar core masses of and are shown in panel (b). In this case, only the variable accretion rate was considered. Grey solid lines are isoradii. From the definition of and (Hosokawa & Omukai 2009; Hosokawa et al. 2010) it can be shown that,
| (7) |
with the accretion luminosity , where is the gravitational constant. The initial stages of the stellar evolution calculations are similar as we assume identical accretion rates during the free-fall collapse. Differences occur at the onset of the disc formation. In Fig. 6a, we directly see that the final stellar mass at the end of the main accretion phase is not the key quantity that governs the evolutionary tracks of high-mass protostars in the Hertzsprung-Russell diagram. Despite all models are calculated up to reaching a similar stellar mass of , their track are qualitatively different. Furthermore, the track of the Run-100-smoothed model with a smoothed accretion rate (but retaining small-amplitude variations) is globally similar to the track of the Run-100-constant model, which assumes a constant accretion rate. The small-amplitude variations in the accretion rate only induce tiny deviations from the constant accretion track. The model with accretion spikes strongly deviates from the constant accretion track. Strong accretion bursts generate short but important changes in the pre-main-sequence evolutionary track of the MYSOs in the form of evolutionary loops to the red part of the Hertzsprung-Russell diagram. These excursions repeat themselves as more and more accretion spikes occur. We find similar behaviour for our model with a pre-stellar core mass of (Fig. 6b).
4 Effect of the initial conditions on the stellar evolutionary tracks of MYSOs
This section explores the effects of different initial conditions of the protostellar seed in the evolution calculations on stellar structures, the various protostellar properties and on the pre-ZAMS evolutionnary track of the MYSOs in the Hertzsprung-Russell diagram.
| () | () | () | ||
|---|---|---|---|---|
| Run-100-hydro | Convective embryo with large initial radius mimicing spherical, then disc accretion⋆ | |||
| Run-100-compact | Radiative embryo with small initial radius mimicing continuous disc accretion⋆ |
() See Section 2.3 of Haemmerlé
& Peters 2016
4.1 Stellar structures
The seed core taken as a stellar embryo to initialise the stellar evolution calculations is a parameter which both depends on the properties of the pre-stellar core (Vaytet & Haugbølle 2017; Bhandare et al. 2018) and influences the stellar evolution calculations (Haemmerlé & Peters 2016). In order to investigate the effects of the bursts on the evolutionary tracks as a function of the initial seeds, we carry out a comparison study between two cases using our accretion rate derived from the hydrodynamical simulation with a initial pre-stellar core with variable accretion rates (Run-100-hydro and Run-100-compact), see our Table 2. The model Run-100-hydro is initialised with a convective core of of radius , temperature and luminosity , while the model Run-100-compact is started as a fully radiative star of with radius , temperature and luminosity , respectively. They principally differ by the internal entropy profiles, i.e. the initial convective model Run-100-hydro exhibits a flat entropy profile towards the protostellar surface, whereas the initial radiative model Run-100-compact has a positive entropy gradient. Therefore, Run-100-hydro is adiabatically convective and is larger than Run-100-compact by about an order of magnitude. Details about these protostellar seeds are given in Haemmerlé & Peters 2016. Particularly, the authors stressed therein that the convective and radiative protostellar embryos have properties similar to models of built by hot and cold accretion, respectively, while the geometry of the accretion is cold for both cases throughout the stellar evolution calculations. Our comparison models therefore investigate the effects of the early accretion geometry on the evolution of the MYSOs.
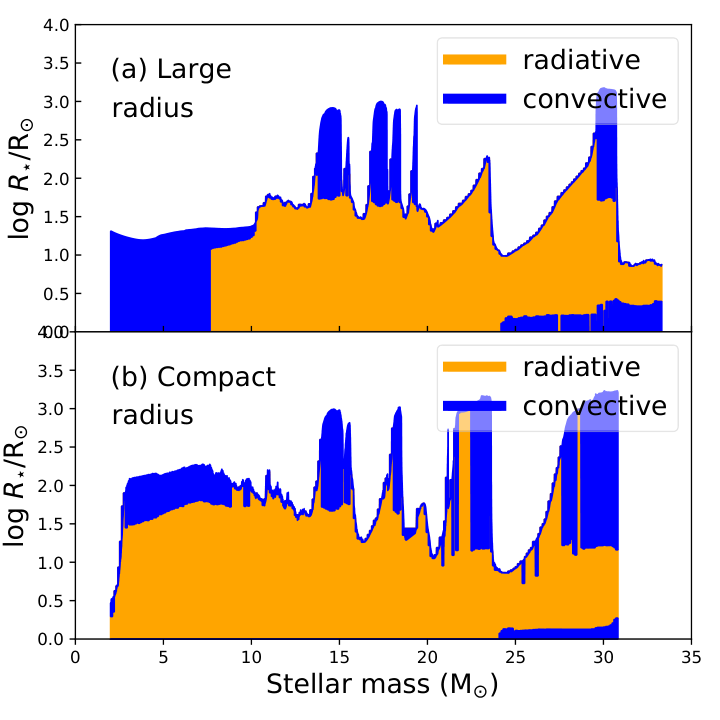
Fig. 7 reports the Kippenhahn diagram two MYSOs calculated with the same episodic accretion rate history but different initial conditions (Tab. 2). Despite of differences in the evolution of the outer radius of the protostar, notable swelling episods of the MYSO appear at the time instances corresponding to the accretion bursts. Although differences are visible, especially (i) during the clustered bursts at in the model Run-100-hydro (a) which results in a single inflation of in Run-100-compact (b), and (ii) in the burst at that is more pronounced in the initially convective case (b), the major outbursts nevertheless generate similar effects regardless of the initial conditions of the calculations. Once the protostar reaches , both simulated MYSOs are structured with a convective layer that inflates under the effects of the entropy deposition by accretion of gaseous circumstellar clumps and a radiative interior which progressively develops a convective core once the protostar is heavy and hot enough for H-burning at . The development of a luminosity wave in the outer layer of the MYSO each time a burst happens is similar as above pictured in the context of an initially radiative protostellar embryo (Fig. 3). Note that the radiative model is numerically more difficult to calculate and it has been simulated over a slightly smaller time interval. Both initial conditions produce similar effects on the evolution of the radius of MYSOs as a response of the accretion of circumstellar gaseous clumps.
4.2 Surface properties and excursions in the Hertzsprung-Russel diagram
Fig. 8 plots the evolution of the stellar surface luminosity (panel a, in ), the stellar radius (panel b, in ) and (the effective temperature (panel c, in ) as a function of time (in ) of our collapsing pre-stellar cores that are considered with large, convective (thin solid blue line) and compact, radiative (thick dotted red line) initial conditions, respectively. The only difference in the calculations is the past evolution of the stellar embryo of which is mimiced by the initial conditions of the models (Tab. 2). Accretion onto the radiative embryo produces an immediate swelling () as a response of the deposition of entropy by cold accretion (Fig. 8b), which also dimishes the surface temperature (Fig. 8c) and increases the surface luminosity (Fig. 8a). These differences between the surface properties of the MYSOs persist up to , when the series of accretion-driven outbursts begins. As illustrated in Fig. 7, the effets of the accretion spikes onto the protostellar properties are qualitatively similar: the most important luminosity rises and falls coincide with each other as a function of time and their respective offsets are due to slightly shifted values of and . Note that the initial compact model has a more pronounced swelling during the series of moderate bursts at (Fig. 8b). Once the strong accretion events onto the MYSO have started, the initial convective model has baseline values of and more compact and hotter than that of the initial radiative calculation (see thick red dotted lines of Fig. 8a-c).
Fig. 9 shows the evolutionary tracks in the Hertzsprung-Russell diagram of the models Run-100-hydro (thin solid blue line) and Run-100-compact (thick dotted red line), respectively. The grey dotted solid lines are isoradii and the thick black dashed line is the zero-age-main-sequence (ZAMS) track of Ekström et al. 2012. It underlines the initial differences between the two models, especially the rapid swelling of the compact model by orders of magnitude accompanied by a decrease of its temperature and an increase of its luminosity, respectively. It also further illustrates that the early bursts are more pronounced in the compact case than it the convective case. The protostellar radius of the initially radiative Run-100-compact (thick dotted red line) is larger than that of the initially convective model Run-100-hydro in the quiescent phases (Fig. 8b), therefore, its evolutionary track is closer to the isoradius. This difference diminishes as a function of time and the two tracks overlap each other in the quiescent phase after the third excursion which almost reach the isoradius occurs. Finally, let notice that in both cases, the tracks cross the isoradius throughout the strongest swelling episods and reach the Hayashi limit. In the initial convective case, when the peak of the excursions happens, the track of the MYSO slightly follows vertically the Hayashi track before it recovers the values of and corresponding to the quiescent accretion phase. Although the properties of the first Larson core depend on the intrinsic pre-stellar core characteristics (Vaytet & Haugbølle 2017; Bhandare et al. 2018), our suite of comparison simulations shows that the mechanism triggering the excursions of MYSOs in the Hertzsprung-Russell diagram is independent of their initial conditions. This shows that, under our assumptions, the accretion geometry induces little qualitative differences on the evolution of the surface properties of episodically-accreting MYSOs.
5 Discussion
In this section, we present the limitation of our method, compare our outcomes to those of other studies assuming burst-free disc accretion histories and extrapolate the findings of our study to the formation of intermediate-mass stars, and we discuss the observable implications of our results. Finally, we review alternative explanations for FU-Orionis-like bursts from young stars.
5.1 Model caveats
The limitations of our method are two-fold. First, the numerical hydrodynamics simulations of disc formation are subject to caveats which merit future improvements, whereas the stellar calculations are also subject to assumptions potentially calling follow-up betterments. In addition to the well-known limitation of disc fragmentation simulations given by the logarithmically-expanding radial grid (Meyer et al. 2018), the sink cell radius, which strongly influences the time-step of the simulations, is kept to a value making the simulations affordable from the point of view of their numerical cost. Decreasing the inner hole would allow us to better follow the migration of the gaseous clumps responsible for the accretion-driven bursts, and therefore make our accretion histories more accurate. However, the value used in this paper is kept to a decent value () that is still smaller than that of other studies on disc fragmentation, see e.g. the supermassive protostellar models of Hosokawa et al. 2016a.
For the sake of completeness, future improvements should equivalently include the initial non-sphericity and differential rotation of the parent pre-stellar cores (Banerjee et al. 2006, see, e.g.) and take into account stellar motion in response to the gravitational force of the disc, as massive disc substructures can shift notably the center of mass of the system from coordinate center where the protostar resides (Regály & Vorobyov 2017). Nevertheless, despite of the fact that the effects of the stellar inertia on the behaviour of accretion discs has been anaytically shown to play a role on the developement of asymetries in their structures (Adams et al. 1989), recent numerical simulations demonstrated that wobbling neither prevents disc fragmentation nor reduces the bursts intensities in the early formation phase of young high-mass stars (Meyer et al. 2018). A set of comparison simulations with and without wobbliofofng is shown in the Fig. 7 of their Section 4 and its illustrates that high-magnitudes accretion-driven outbursts develop similarly within the same timescale after the onset of the disc formation which followed the free-fall gravitational collapse. Only the time instance and perhaps the long-term occurence of the excursions of MYSOs in the Hertzsprung-Russell diagram would change if a moving sink-cell is used in the hydrodynamical simulations. Our assumptions related to the hydrodynamical simulations are discussed in great detail in Meyer et al. 2017.
The manner our stellar evolution calculations treat the accretion of circumstellar material can also be improved. Although the so-called cold accretion scenario is a well-established method to include the accretion of disc material onto the stellar surface (see Hosokawa & Omukai 2009, and references therein), it is the lower limit in terms of for the accretion of entropy (Hosokawa et al. 2010). Despite of the fact that high-resolution observations recently demonstrated the disc-plus-jet structure surrounding MYSOs, the exact topology of the accretion flow within a few tens of stellar radii from the protostellar surface is unknown and may differ from accretion in the midplane, for example via the formation of accretion columns (Romanova et al. 2012). The deviations of the accretion geometry from the cold accretion scenario can be explored within the so-called hot accretion scenario or by hybridising the cold and hot accretion scenarios (Vorobyov et al. 2017). Haemmerlé & Peters 2016 showed how the stellar bloating can significantly change as a function of the early accretion geometry, regardless of the accretion rate. However, this concerned smaller accretion rates than ours and our calculations are performed with the initial convective model (”CV”) of Haemmerlé & Peters 2016, with a larger initial radius than that of the radiative models (”RD”) for spherical accretion, for which the bloating of the radius is less pronounced.
Our study make use of the methods developed in Haemmerlé et al. 2016 and Haemmerlé & Peters 2016. These works showed that (i) when a massive protostar accretes at very high constant rates (), its corresponding evolutionary track derives towards the red part of the Hertzsprung-Russell diagram (Haemmerlé et al. 2016), and (ii) that variabilities in the accretion rate onto H ii regions around massive protostar taken from large-scale hydrodycamical simulations (Peters et al. 2010, see) produce luminosity changes reflecting that of the fluctuating accretion rates (Haemmerlé & Peters 2016). Since we focus on the accretion in the vicinity of massive protostars, the accretion rates histories measured from small-scale hydrodynamical simulations (Meyer et al. 2017; Meyer et al. 2018) are more realistic and we investigate how massive protostellar structures reacts under the effect of such accretion variability. We show that, high episodic accretion rates (-) produce repetitive excursions in the Hertzsprung-Russell diagram. It was not the case in Hosokawa & Omukai 2009 and Hosokawa et al. 2010 because their accretion rates were constant and weaker than that ours (up to ). Indeed, the entropy accreted is higher than for cold accretion, hence, the radius will be larger according to the homology relations, as confirmed for constant rates in Hosokawa & Omukai 2009; Hosokawa et al. 2010, and, since the tracks already reached the Hayashi limit, substential differences in the maximal values of the prostellar radius should not be expected.
One can nevertheless wonder whether the mean protostellar radius of the MYOS may be affected by hybrid/hot accretion geometries, by making the protostars slightly colder during the phases of quiescent accretion and consequently diminishing the amplitudes of the excursions, as shown in the context of low-mass star formation (Hosokawa et al. 2011). However, the incidence of massive magnetic OB stars is small (Fossati et al. 2015; Fossati et al. 2016) and pre-main-sequence massive stars do have strong surface radiation field because of their high effective temperatures (Hosokawa & Omukai 2009; Hosokawa et al. 2010). Therefore, quiescent accretion processes in most MYSOs should happen via boundary layer mechanisms at the equatorial plane, as investigated by radiation-hydrodynamics simulations (Kee et al. 2018). The assumption of cold accretion is therefore appropriate for this first study on the effects of strong, episodic accretion variability on the stellar evolutionnary tracks of pre-ZAMS massive protostars.
5.2 Comparison with other works assuming constant disc accretion rates
Our work extends previous studies on the modifications brought by disc mass accretion onto the evolutionary path of young massive stars in the Hertzsprung-Russell diagram. We perform the most spatially-resolved numerical simulations of the inner accretion disc around MYSOs that have revealed self-consistent fragmentation of the irradiated circumstellar disc into spiral arms interspersed with dense gaseous clumps, which migration onto the protostar induces strong variability and bursts in the accretion rate histories. These variabilities account for the specifics of the inner disc physics that was informations that were not passed to the protostars in previous works on the evolution of massive protostars. Indeed, constant accretion rate is considered in early studies (Palla & Stahler 1992; Palla & Stahler 1993; Beech & Mitalas 1994; Bernasconi & Maeder 1996; Bernasconi 1996) and in more recent works (Hosokawa & Omukai 2009; Hosokawa et al. 2010; Hosokawa et al. 2016a). The latter found that rapid strong accretion produces a strong swelling of the protostars, which bloat so that their radii reach . This bloating results in inducing a reduction of the effective temperature so that the H ii region and reestablishes only when the star contracts again and comes back to the bluer part of the Hertzsprung-Russell diagram Haemmerlé & Peters 2016. Variabilities produced by the initial gravitational collapse of the host pre-stellar core in which the star grows and by the effect of outflows launched perpendicularly to the disc have been explored with stellar calculations based on the 2.5D axisymmetric gravito-radiation-hydrodynamics models, leading to a single excursion to the redder region of the Hertzsprung-Russell diagram (Kuiper & Yorke 2013).
Our study investigates the effects of strong accretion-driven bursts predicted to happen in the context of massive protostars (Meyer et al. 2017). We show that the swelling of the MYSOs, occasionally going to the cold part of the Hertzsprung-Russell diagram (Kuiper & Yorke 2013), can be generalised in a wider context, as a successive series of evolutionary loops to the red region of the Hertzsprung-Russell diagram, before the protostars converge to the ZAMS. Fig. 10 compares our models with the tracks of Haemmerlé et al. 2016 by plotting our evolutionary tracks with a color coding informing on the stellar mass (in ). In general, our MYSOs follow the track of a massive prototar accreting at a constant rate of Haemmerlé et al. 2016, but, in addition, our tracks exhibit excursions to the red part of the Hertzsprung-Russell diagram caused by repetitive accretion bursts that modify their surface properties. Our tracks are therefore consistent in terms of final mass and location on the ZAMS (Ekström et al. 2012), modulo the excursions which deviate from the constant-accretion solutions. Particularly, we recover the non-monotoneous evolution of the radius and effective temperature of two-dimensional present-day models of disc-accreting MYSOs noted by Kuiper & Yorke 2013, but reveal their episodic nature together with the intermittency of their ionized flux, as it is known to exist in the context of primordial supermassive protostars gaining mass from a fragmented disc (Hosokawa et al. 2016a).
5.3 Observational implications
Fig. 11 compares the excursions of our protostars in the Hertzsprung-Russell diagram with observational data of various high-mass stars. The figure clearly illustrates that the properties of young massive stars during the bursts may be similar to those of evolved, supergiant massive stars with high-luminosity, large radii and cold effective temperature. One can note that the model with (dashed black line) has surface characteristics at the peak of the burst that are similar to the characteristics of a red supergiant (Levesque et al. 2005). On the other hand, the n model has surface characteristics similar to Be stars (Arcos et al. 2018) when converging to the ZAMS in the post burst phase. At the same time, the model with a more massive pre-stellar core () crosses the luminous blue variables (LBV) region (Groh et al. 2013) attains the characteristics a yellow supergiant (YSG) star at the peak of the burst (de Jager 1998). To avoid confusion with evolved massive stars, one should use unique spectral signature of young massive protostars, such as infrared excess and line emission typically associated to accretion discs.
Most important observational implication of our results is the intermittent character of the H ii regions associated to massive protostars accreting from a fragmented circumstellar disc. We estimate its impact on the ionization feedback with the stellar properties obtained from our stellar evolution calculations by computing the number of UV-ionizing photons per unit time as the integral of the blackbody spectrum above the ionizing energy threshold (Haemmerlé & Peters 2016), i.e.
| (8) |
with,
| (9) |
where , , and are the Planck constant, photon frequency, speed of light and Boltzman constant, respectively. We report its evolution during the pre-main-sequence phase for our protostellar models in Fig. 12. The number of photons gradually increases up to the time instance of the disc formation at - (Fig. 12a) after the beginning of the gravitational collapse. The accretion variability breaks the strict monotonic time-evolution of at (Run-100-hydro with variable accretion, thick blue line of Fig. 12a) and at the time of each burst (equivalently each spectroscopic excursions), sharply decreases by up to orders of magnitude, inducing dippering in the variability of the H ii regions of MYSOs. Such a phenomenon is only a consequence of the bursts, as our models with constant and smoothed accretion histories do not exhibit sharp decreases in (thin solid black and thick dotted lines of Fig. 12a). A similar behaviour is found for our model Run-60-hydro (12b). The H ii regions become fainter, which makes them much more difficult to detect on timescales corresponding to those of the bursts. Fig. 13 further highlights the correlation between evolution of the protostellar radius and number of ionizing photons released by the protostellar surface as a function of the growing mass of the MYSOs. The time interval corresponding to the bloating phases is of the order of the collisional recombinaison timescale in the plasma () derived for the intermittent H ii regions around supermassive stars in Hosokawa et al. 2016a.
5.4 Implication for intermediate-mass star formation
Both theoretical and observational works have recently highlighted a possible similarity between the star forming processes in different mass regimes. First evidence came form the direct observation of H ii regions piercing opaque pre-stellar clouds in high-mass star forming regions (Fuente et al. 2001; Testi 2003; Cesaroni et al. 2010). Then, the observation of accretion flow (Keto & Wood 2006) and Keplerian disc structure surrounding protostars of various mass (Johnston et al. 2015; Ilee et al. 2016; Forgan et al. 2016; Ginsburg et al. 2018) strengthened that picture. The numerical proof of disc fragmentation around MYSOs and triggering of FU-Orionis-like events supported the scaled-up character of high-mass star formation with respect to that of low-mass and primordial stars (Vorobyov & Basu 2015; Hosokawa et al. 2016a; Meyer et al. 2017). Moreover, the intermittent character of H ii regions from young primordial stars has been demonstrated with the help of gravito-radiation-hydrodynamics models of the same kind as ours Hosokawa et al. 2016b. By coupling the outcomes of the hydrodynamical results to stellar evolution calculations, they derive the intermittent properties of the UV feedback that is channelled through the radiation-driven cavity perpendicular to the accretion disc of young supermassive stars.
Our results extends such phenomenon to young massive stars, and we speculate that similar mechanisms may be at work in the intermediate-mass systems as they equivalently generate ionizing photons (Haemmerlé & Peters 2016) and form accretion disks and jets (Kessel et al. 1998; Fuente et al. 2001; Torrelles et al. 2014; Reiter et al. 2017b). Young intermediate-mass stars indeed have all necessary prerequisites, i.e. circumstellar disc and H ii regions (Lumsden et al. 2012; Fontani et al. 2012; Menu et al. 2015; Zakhozhay et al. 2018), to experience disc fragmentation and accretion variability. They may episodically produce FU-Orionis-type bursts which will subsequently make the UV feedback that fills their radiation-driven bubbles intermittent. Such a prediction is supported by various observational results, including amongst others the variability of the eruptive intermediate-mass stellar object IRAS 18507+0121 (Nikoghosyan et al. 2017) and the ionised outflow of the intermediate-mass stellar object IRAS 05373+2349 VLA 2 (Brown et al. 2016). Additionally, we interpret the spectroscopic excursions of massive protostars in the Hertzsprung-Russell diagram triggered by FU-Orionis bursts as a direct consequence of the inward migration of a gaseous clump in their fragmented accretion discs onto the stellar surface, and, consequently, consider the intermittency of their H ii regions as a possible signature of disc gravitational fragmentation.
5.5 Alternative explanations for bursting young stellar objects
ALMA views of bursting objects such as protostars with EXor revealed that their accretion discs seem not to be Toomre-instable, which suggests that outbursts should be trigered by mechanisms different than gravitational instabilities followed by inward migration of clumps in the disc (Cieza et al. 2018). Although the massive accretion discs of MYSOs implies that the fragmentation scenario is likely to happen (Kratter & Matzner 2006; Kratter & Lodato 2016), various other mechanisms have indeed been proposed to explain luminosity rises from young low-mass stellar objects, particularly in the low-mass regime of star formation. The work of Cieza et al. 2018 lists the principal alternatives for the generation of bursts without the classical picture of migrating disc gaseous clumps, i.e. (i) coupling between magneto-rotational and gravitational instabilities, (ii) thermal-viscous instability, (iii) instabilities induced by planets or companions and (iv) the infall clumpiness mechanism.
Although these mechanisms are very different, they all consist in providing a manner to suddenly/episodically increase the accretion rate onto young stars. First, a cyclic magnetohydrodynamical instability in the inner of protoplanetary discs is proposed in Armitage et al. 2001. It is further demonstrated in Zhu et al. 2009 that the magneto-rotational instability or the gravitational instability alone can not be responsible for the radial mass transport over the overall disc and produce high fluctuations of the accretion rate on young protostars that is required for FUor bursts. However, these two instabilities can couple together in the innermost au of the disc and induce accretion variabilities compatible with the observed infrared spectra of FU-Orionis objects (Zhu et al. 2009). Secondly, a thermal ionisation instability at the inner region of accretion discs around low-mass protostars has been proposed to explain episodic increases of the disc-star mass transferts associated to luminous flashes from ionized gas. This model has successfully been compared to the major observational characteristcs of FU-Orionis objects (Clarke et al. 1990; Bell & Lin 1994; Bell et al. 1995). Additionally, the thermal viscous ionisation instability scenario has been extended to a wider mechanism, which assumes that it naturally develops away from the disc edge by the presence of an embedded planet (Lodato & Clarke 2004). Similarly, instable mass transferts in a binary system modelled with Lagrangian methods gave accretion rate and luminosity rises consistent with that of FU-Orionis protostars (Bonnell & Bastien 1992). Last, the infall clumpiness scenario consists in assuming than the dense material which falls onto the young stars is directly formed by gas from converging, clumpy filamentary flows in the collapsing turbulent molecular clouds in which stellar clusters form (Padoan et al. 2014). Such gravito-turbulent, large-scale models do not resolve small-scale structures as accretion discs and spot the forming stars with sink particles (Federrath et al. 2010), however, it gives results consistent with the disc fragmentation scenario (Vorobyov & Basu 2005; Vorobyov & Basu 2015).
These alterlative mechanisms can all explain the production of flares from young stellar objects, with or without the presence of an accretion disc around them, and they potentially can be applied to the high-mass regime of star formation. The strong ionization feedback of MYSOs (Vaidya et al. 2011), the efficient gravitational instability in their surrounding discs (Meyer et al. 2018) and the possible therein magneto-rotational instability (Kratter et al. 2008) make the model of Armitage et al. 2001 and Zhu et al. 2009 applicable in the context of massive protostars. The thermal viscous ionisation instability scenario is conceivable in objects such as the high-mass proto-binary IRAS17216-3801 (Kraus et al. 2017) and the infall clumpiness scenario applicable to regions such as the massive collapsing and high-mass star-forming filament IRDC 18223 (Beuther et al. 2015).
6 Conclusion
Our study explores for the first time the effects of a strongly variable protostellar accretion rate history, including including strong accretion-driven luminosity bursts (Meyer et al. 2017), on the internal structure and evolutionary path of pre-main-sequence, massive young stellar objects (MYSOs). We model growing massive protostars by performing three-dimensional gravito-radiation-hydrodynamics simulations of the formation and evolution of their circumstellar discs, unstable to gravitational instability, from which the protostars gain mass (Meyer et al. 2018). Direct stellar irradiation feedback and appropriate disc thermodynamics are taken account, in addition to a sub-au spatial resolution of the inner region of the self-gravitating circumstellar discs. Gaseous clumps produced in the fragmented discs episodically migrate towards the protostar and produce brief, but violent increases of the accretion rate onto the MYSOs, subsequently responsible for luminous outbursts via the mechanism described in Meyer et al. 2017. We post-process our accretion rate histories by using them as inputs when feeding a stellar evolutionary code including the physics of pre-main-sequence disc accretion at high rates () within the so-called cold accretion formalism (Hosokawa & Omukai 2009; Hosokawa et al. 2010; Haemmerlé et al. 2016; Haemmerlé et al. 2017). The internal and surface stellar properties are self-consistently calculated, together with the evolutionary track of the protostars in the Hertzsprung-Russell. Our models differ by the initial mass of the collapsing pre-stellar cores, taken to be and , respectively.
The protostars are initially fully convective and highly opaque, but soon develop a radiative core. At the outer boundary of the radiative core the internal luminosity peaks and moves outwards to the surface as a luminosity wave following the decrease of the internal opacity (Larson 1972). At the moment of the strong increase of the accretion rate (), the MYSOs bloat as a consequence of the redistribution of entropy, thus reestablishing the internal thermal equilibrium. The photospheric luminosity first sharply augments as a response of the increase of the accretion rate, before gradually decreasing up to recovering its quiescent, pre-burst value. In addition to the swelling of the stellar radius that accompanies the burst, the effective temperature decreases during the bursts. This found decrease in the effective temperature is in stark contrast to what was found for low-mass stars (Vorobyov et al. 2017). In the latter case, the effective temperature increases and the protostars migrate to the left portion of the Hertzsprung-Russell diagram. Our models recover the principal feature of the protostars accreting at rates extensively studied in Hosokawa et al. 2010 and Haemmerlé et al. 2016, i.e. their evolutionary track reach the forbidden Hayashi region. The decrease of the accretion rate which follows each accretion spike brings back the evolutionary track of our massive protostars to the standard ZAMS (Ekström et al. 2012), as previously calculated in the models of Kuiper & Yorke 2013. Importantly, this phenomenon is qualitatively independent of the choice of the initial stellar radius considered in the stellar evolution calculations. Our simulations with accretion histories derived from three-dimensional simulations show that this mechanism is repetitive. Consequently, while gradually gaining mass, the protostellar radius episodically swells and the MYSOs experience multiple pre-main-sequence spectroscopic excursions towards the colder regions of the Hertzsprung-Russell diagram. Each additional evolutionary loop to the red corresponds to an ongoing accretion burst inducing intermittent changes in the surface entropy of the protostar.
Our work demonstrates that the successive excursions of massive protostars in the Herztsprung-Russel are only possible during strong accretion bursts, and that mild disc-induced variability is insufficient to trigger them. Accretion bursts make MYSOs appear colder and much fainter than during their quiescent accretion phase, eventually crossing the luminous-blue-variable and yellow supergiant sectors of the Hertzsprung-Russell diagram to reach the red supergiants region, particularly if the initial the pre-stellar core mass is sufficiently large (). To each high-magnitude accretion bursts (Meyer et al. 2018) corresponds an excursion assuming that none of them produce a close/spectroscopic binary companion to the massive protostar (Chini et al. 2012; Mahy et al. 2013). The changes in the stellar structure cause a decrease the effective temperature while increasing the stellar radius, which greatly affects number of ionizing UV photons released by the MYSOs and induces intermittencies in their surrounding H ii region, as was previously noticed in the context of primordial stars (Hosokawa et al. 2016b). The present study highlights the scaled-up character of star-forming processes, as models for the evolution of brown dwarfs and low-mass stars also revealed excursions in the Herztsprung-Rusell as a response to strong variable disc accretion (Baraffe et al. 2009; Baraffe et al. 2017; Vorobyov et al. 2017). Finally, we conjecture that such mechanism should equivalently affect star formation in the intermediate-mass regime and constitute a typical feature of hot, UV-feedback producing young stars.
Acknowledgements
The authors thank the anonymous referee for useful advices and suggestions which greatly improved the manuscript. D. M.-A. Meyer thanks N. Castro-Ramirez for kindly sharing his knowledge on observational data and B. Stecklum for insightful remarks. This work was sponsored by the Swiss National Science Foundation (project number 200020-172505). E. I. Vorobyov acknowledges acknowledges support form the Russian Ministry of Education and Science grant 3.5602.2017.
References
- Adams et al. (1989) Adams F. C., Ruden S. P., Shu F. H., 1989, ApJ, 347, 959
- Arcos et al. (2018) Arcos C., Kanaan S., Chávez J., Vanzi L., Araya I., Curé M., 2018, MNRAS, 474, 5287
- Armitage et al. (2001) Armitage P. J., Livio M., Pringle J. E., 2001, MNRAS, 324, 705
- Asplund et al. (2005) Asplund M., Grevesse N., Sauval A. J., 2005, in Barnes III T. G., Bash F. N., eds, Cosmic Abundances as Records of Stellar Evolution and Nucleosynthesis Vol. 336 of Astronomical Society of the Pacific Conference Series, The Solar Chemical Composition. p. 25
- Banerjee et al. (2006) Banerjee R., Pudritz R. E., Anderson D. W., 2006, MNRAS, 373, 1091
- Baraffe et al. (2009) Baraffe I., Chabrier G., Gallardo J., 2009, ApJ, 702, L27
- Baraffe et al. (2017) Baraffe I., Elbakyan V. G., Vorobyov E. I., Chabrier G., 2017, A&A, 597, A19
- Beech & Mitalas (1994) Beech M., Mitalas R., 1994, ApJS, 95, 517
- Behrend & Maeder (2001) Behrend R., Maeder A., 2001, A&A, 373, 190
- Bell & Lin (1994) Bell K. R., Lin D. N. C., 1994, ApJ, 427, 987
- Bell et al. (1995) Bell K. R., Lin D. N. C., Hartmann L. W., Kenyon S. J., 1995, ApJ, 444, 376
- Bernasconi (1996) Bernasconi P. A., 1996, A&AS, 120, 57
- Bernasconi & Maeder (1996) Bernasconi P. A., Maeder A., 1996, A&A, 307, 829
- Beuther et al. (2015) Beuther H., Ragan S. E., Johnston K., Henning T., Hacar A., Kainulainen J. T., 2015, A&A, 584, A67
- Bhandare et al. (2018) Bhandare A., Kuiper R., Henning T., Fendt C., Marleau G.-D., Kölligan A., 2018, A&A, 618, A95
- Bitsch et al. (2014) Bitsch B., Morbidelli A., Lega E., Crida A., 2014, A&A, 564, A135
- Black & Bodenheimer (1975) Black D. C., Bodenheimer P., 1975, ApJ, 199, 619
- Bonnell & Bastien (1992) Bonnell I., Bastien P., 1992, ApJ, 401, L31
- Bonnell et al. (1998) Bonnell I. A., Bate M. R., Zinnecker H., 1998, MNRAS, 298, 93
- Brown et al. (2016) Brown G. M., Johnston K. G., Hoare M. G., Lumsden S. L., 2016, MNRAS, 463, 2839
- Burns (2018) Burns R. A., 2018, ArXiv e-prints
- Burns et al. (2017) Burns R. A., Handa T., Imai H., Nagayama T., Omodaka T., Hirota T., Motogi K., van Langevelde H. J., Baan W. A., 2017, MNRAS, 467, 2367
- Butler & Tan (2012) Butler M. J., Tan J. C., 2012, ApJ, 754, 5
- Butler et al. (2014) Butler M. J., Tan J. C., Kainulainen J., 2014, ApJ, 782, L30
- Caratti o Garatti et al. (2016) Caratti o Garatti A., Stecklum B., Garcia Lopez R., Eisloffel J., Ray T. P., Sanna A., Cesaroni R., Walmsley C. M., Oudmaijer R. D., de Wit W. J., Moscadelli L., Greiner J., Krabbe A., Fischer C., Klein R., Ibanez J. M., 2016, Nature, pp 1745–2481
- Caratti o Garatti et al. (2015) Caratti o Garatti A., Stecklum B., Linz H., Garcia Lopez R., Sanna A., 2015, A&A, 573, A82
- Cesaroni et al. (2006) Cesaroni R., Galli D., Lodato G., Walmsley M., Zhang Q., 2006, Nature, 444, 703
- Cesaroni et al. (2010) Cesaroni R., Hofner P., Araya E., Kurtz S., 2010, A&A, 509, A50
- Cesaroni et al. (2018) Cesaroni R., Moscadelli L., Neri R., Sanna A., Garatti A. C. o., Eisloeffel J., Stecklum B., Ray T., Walmsley C. M., 2018, ArXiv e-prints
- Chen et al. (2017) Chen X., Ren Z., Zhang Q., Shen Z., Qiu K., 2017, ApJ, 835, 227
- Chini et al. (2012) Chini R., Hoffmeister V. H., Nasseri A., Stahl O., Zinnecker H., 2012, MNRAS, 424, 1925
- Cieza et al. (2018) Cieza L. A., Ruíz-Rodríguez D., Perez S., Casassus S., Williams J. P., Zurlo A., Principe D. A., Hales A., Prieto J. L., Tobin J. J., Zhu Z., Marino S., 2018, MNRAS, 474, 4347
- Clarke et al. (1990) Clarke C. J., Lin D. N. C., Pringle J. E., 1990, MNRAS, 242, 439
- Commerçon et al. (2011) Commerçon B., Teyssier R., Audit E., Hennebelle P., Chabrier G., 2011, A&A, 529, A35
- Cunha et al. (2006) Cunha K., Hubeny I., Lanz T., 2006, ApJ, 647, L143
- Cunningham et al. (2009) Cunningham N. J., Moeckel N., Bally J., 2009, ApJ, 692, 943
- de Jager (1998) de Jager C., 1998, A&A Rev., 8, 145
- Eggenberger et al. (2008) Eggenberger P., Meynet G., Maeder A., Hirschi R., Charbonnel C., Talon S., Ekström S., 2008, Ap&SS, 316, 43
- Ekström et al. (2012) Ekström S., Georgy C., Eggenberger P., Meynet G., Mowlavi N., Wyttenbach A., Granada A., Decressin T., Hirschi R., Frischknecht U., Charbonnel C., Maeder A., 2012, A&A, 537, A146
- Federrath et al. (2010) Federrath C., Banerjee R., Clark P. C., Klessen R. S., 2010, ApJ, 713, 269
- Flock et al. (2013) Flock M., Fromang S., González M., Commerçon B., 2013, A&A, 560, A43
- Fontani et al. (2012) Fontani F., Palau A., Busquet G., Isella A., Estalella R., Sanchez-Monge Á., Caselli P., Zhang Q., 2012, MNRAS, 423, 1691
- Forgan et al. (2016) Forgan D. H., Ilee J. D., Cyganowski C. J., Brogan C. L., Hunter T. R., 2016, MNRAS, 463, 957
- Fossati et al. (2015) Fossati L., Castro N., Schöller M., Hubrig S., Langer N., Morel T., Briquet M., Herrero A., Przybilla N., Sana H., Schneider F. R. N., de Koter A., BOB Collaboration 2015, A&A, 582, A45
- Fossati et al. (2016) Fossati L., Schneider F. R. N., Castro N., Langer N., Simón-Díaz S., Müller A., de Koter A., Morel T., Petit V., Sana H., Wade G. A., 2016, A&A, 592, A84
- Fuente et al. (2001) Fuente A., Neri R., Martín-Pintado J., Bachiller R., Rodríguez-Franco A., Palla F., 2001, A&A, 366, 873
- Fujisawa et al. (2015) Fujisawa K., Yonekura Y., Sugiyama K., Horiuchi H., Hayashi T., Hachisuka K., Matsumoto N., Niinuma K., 2015, The Astronomer’s Telegram, 8286
- Ginsburg et al. (2018) Ginsburg A., Bally J., Goddi C., Plambeck R., Wright M., 2018, ArXiv e-prints
- Groh et al. (2013) Groh J. H., Meynet G., Georgy C., Ekström S., 2013, A&A, 558, A131
- Haemmerlé (2014) Haemmerlé L., 2014, PhD thesis, University of Geneva
- Haemmerlé et al. (2016) Haemmerlé L., Eggenberger P., Meynet G., Maeder A., Charbonnel C., 2016, A&A, 585, A65
- Haemmerlé et al. (2017) Haemmerlé L., Eggenberger P., Meynet G., Maeder A., Charbonnel C., Klessen R. S., 2017, A&A, 602, A17
- Haemmerlé & Peters (2016) Haemmerlé L., Peters T., 2016, MNRAS, 458, 3299
- Harries (2015) Harries T. J., 2015, MNRAS, 448, 3156
- Harries et al. (2017) Harries T. J., Douglas T. A., Ali A., 2017, MNRAS, 471, 4111
- Hirano et al. (2017) Hirano S., Hosokawa T., Yoshida N., Kuiper R., 2017, Science, 357, 1375
- Hosokawa et al. (2016a) Hosokawa T., Hirano S., Kuiper R., Yorke H. W., Omukai K., Yoshida N., 2016a, ApJ, 824, 119
- Hosokawa et al. (2016b) Hosokawa T., Hirano S., Kuiper R., Yorke H. W., Omukai K., Yoshida N., 2016b, ApJ, 824, 119
- Hosokawa et al. (2011) Hosokawa T., Offner S. S. R., Krumholz M. R., 2011, ApJ, 738, 140
- Hosokawa & Omukai (2009) Hosokawa T., Omukai K., 2009, ApJ, 691, 823
- Hosokawa et al. (2010) Hosokawa T., Yorke H. W., Omukai K., 2010, ApJ, 721, 478
- Hunter et al. (2017) Hunter T. R., Brogan C. L., MacLeod G., Cyganowski C. J., Chandler C. J., Chibueze J. O., Friesen R., Indebetouw R., Thesner C., Young K. H., 2017, ApJ, 837, L29
- Ilee et al. (2016) Ilee J. D., Cyganowski C. J., Nazari P., Hunter T. R., Brogan C. L., Forgan D. H., Zhang Q., 2016, MNRAS, 462, 4386
- Johnston et al. (2015) Johnston K. G., Robitaille T. P., Beuther H., Linz H., Boley P., Kuiper R., Keto E., Hoare M. G., van Boekel R., 2015, ApJ, 813, L19
- Kee et al. (2018) Kee N. D., Owocki S., Kuiper R., 2018, MNRAS, 479, 4633
- Kessel et al. (1998) Kessel O., Yorke H. W., Richling S., 1998, A&A, 337, 832
- Keto & Wood (2006) Keto E., Wood K., 2006, ApJ, 637, 850
- Klassen et al. (2016) Klassen M., Pudritz R. E., Kuiper R., Peters T., Banerjee R., 2016, ApJ, 823, 28
- Kolb et al. (2013) Kolb S. M., Stute M., Kley W., Mignone A., 2013, A&A, 559, A80
- Kratter & Lodato (2016) Kratter K., Lodato G., 2016, ARA&A, 54, 271
- Kratter & Matzner (2006) Kratter K. M., Matzner C. D., 2006, MNRAS, 373, 1563
- Kratter et al. (2008) Kratter K. M., Matzner C. D., Krumholz M. R., 2008, ApJ, 681, 375
- Kraus et al. (2017) Kraus S., Kluska J., Kreplin A., Bate M., Harries T. J., Hofmann K.-H., Hone E., Monnier J. D., Weigelt G., Anugu A., de Wit W. J., Wittkowski M., 2017, ApJ, 835, L5
- Krumholz et al. (2007) Krumholz M. R., Klein R. I., McKee C. F., 2007, ApJ, 656, 959
- Krumholz et al. (2009) Krumholz M. R., Klein R. I., McKee C. F., Offner S. S. R., Cunningham A. J., 2009, Science, 323, 754
- Kuiper & Yorke (2013) Kuiper R., Yorke H. W., 2013, ApJ, 772, 61
- Larson (1969) Larson R. B., 1969, MNRAS, 145, 271
- Larson (1972) Larson R. B., 1972, MNRAS, 157, 121
- Levesque et al. (2005) Levesque E. M., Massey P., Olsen K. A. G., Plez B., Josselin E., Maeder A., Meynet G., 2005, ApJ, 628, 973
- Lodato & Clarke (2004) Lodato G., Clarke C. J., 2004, MNRAS, 353, 841
- Lumsden et al. (2012) Lumsden S. L., Wheelwright H. E., Hoare M. G., Oudmaijer R. D., Drew J. E., 2012, MNRAS, 424, 1088
- Machida & Matsumoto (2011) Machida M. N., Matsumoto T., 2011, MNRAS, 413, 2767
- Mahy et al. (2013) Mahy L., Rauw G., De Becker M., Eenens P., Flores C. A., 2013, A&A, 550, A27
- Maud et al. (2017) Maud L. T., Hoare M. G., Galván-Madrid R., Zhang Q., de Wit W. J., Keto E., Johnston K. G., Pineda J. E., 2017, MNRAS, 467, L120
- Menu et al. (2015) Menu J., van Boekel R., Henning T., Leinert C., Waelkens C., Waters L. B. F. M., 2015, A&A, 581, A107
- Meyer et al. (2018) Meyer D. M.-A., Kuiper R., Kley W., Johnston K. G., Vorobyov E., 2018, MNRAS, 473, 3615
- Meyer et al. (2017) Meyer D. M.-A., Vorobyov E. I., Kuiper R., Kley W., 2017, MNRAS, 464, L90
- Meyer et al. (2018) Meyer D. M.-A., Vorobyov E. I., Elbakyan V. G., Stecklum B., Eislöffel J., Sobolev A. M., 2018, ArXiv e-prints 1811.00574
- Mignone et al. (2007) Mignone A., Bodo G., Massaglia S., Matsakos T., Tesileanu O., Zanni C., Ferrari A., 2007, ApJS, 170, 228
- Mignone et al. (2012) Mignone A., Zanni C., Tzeferacos P., van Straalen B., Colella P., Bodo G., 2012, ApJS, 198, 7
- Moscadelli et al. (2017) Moscadelli L., Sanna A., Goddi C., Walmsley M. C., Cesaroni R., Caratti o Garatti A., Stecklum B., Menten K. M., Kraus A., 2017, A&A, 600, L8
- Nayakshin & Lodato (2012) Nayakshin S., Lodato G., 2012, MNRAS, 426, 70
- Nikoghosyan et al. (2017) Nikoghosyan E. H., Azatyan N. M., Khachatryan K. G., 2017, A&A, 603, A26
- Norberg & Maeder (2000) Norberg P., Maeder A., 2000, A&A, 359, 1025
- Padoan et al. (2014) Padoan P., Haugbølle T., Nordlund Å., 2014, ApJ, 797, 32
- Palla & Stahler (1991) Palla F., Stahler S. W., 1991, ApJ, 375, 288
- Palla & Stahler (1992) Palla F., Stahler S. W., 1992, ApJ, 392, 667
- Palla & Stahler (1993) Palla F., Stahler S. W., 1993, ApJ, 418, 414
- Peters et al. (2010) Peters T., Banerjee R., Klessen R. S., Mac Low M.-M., Galván-Madrid R., Keto E. R., 2010, ApJ, 711, 1017
- Peters et al. (2010) Peters T., Klessen R. S., Mac Low M.-M., Banerjee R., 2010, ApJ, 725, 134
- Purser et al. (2018) Purser S. J. D., Lumsden S. L., Hoare M. G., Cunningham N., 2018, MNRAS, 475, 2
- Purser et al. (2016) Purser S. J. D., Lumsden S. L., Hoare M. G., Urquhart J. S., Cunningham N., Purcell C. R., Brooks K. J., Garay G., Gúzman A. E., Voronkov M. A., 2016, MNRAS, 460, 1039
- Regály & Vorobyov (2017) Regály Z., Vorobyov E., 2017, A&A, 601, A24
- Reiter et al. (2017a) Reiter M., Kiminki M. M., Smith N., Bally J., 2017a, MNRAS, 470, 4671
- Reiter et al. (2017b) Reiter M., Kiminki M. M., Smith N., Bally J., 2017b, ArXiv e-prints
- Romanova et al. (2012) Romanova M. M., Ustyugova G. V., Koldoba A. V., Lovelace R. V. E., 2012, MNRAS, 421, 63
- Rosen et al. (2016) Rosen A. L., Krumholz M. R., McKee C. F., Klein R. I., 2016, MNRAS, 463, 2553
- Samal et al. (2018) Samal M. R., Chen W.-P., Takami M., Jose J., Froebrich D., 2018, ArXiv e-prints
- Sanna et al. (2018) Sanna A., Koelligan A., Moscadelli L., Kuiper R., Cesaroni R., Pillai T., Menten K. M., Zhang Q., Garatti A. C. o., Goddi C., Leurini S., Carrasco-Gonzalez C., 2018, ArXiv e-prints
- Seifried et al. (2011) Seifried D., Banerjee R., Klessen R. S., Duffin D., Pudritz R. E., 2011, MNRAS, 417, 1054
- Shu (1977) Shu F. H., 1977, ApJ, 214, 488
- Stecklum et al. (2016) Stecklum B., Caratti o Garatti A., Cardenas M. C., Greiner J., Kruehler T., Klose S., Eisloeffel J., 2016, The Astronomer’s Telegram, 8732
- Stecklum et al. (2017) Stecklum B., Garatti A. C. o., Hodapp K., Linz H., Moscadelli L., Sanna A., 2017, ArXiv e-prints
- Stecklum et al. (2017) Stecklum B., Heese S., Wolf S., Garatti A. C. o., Ibanez J. M., Linz H., 2017, ArXiv e-prints
- Tanaka et al. (2018) Tanaka K. E. I., Tan J. C., Zhang Y., Hosokawa T., 2018, ArXiv e-prints
- Testi (2003) Testi L., 2003, in De Buizer J. M., van der Bliek N. S., eds, Galactic Star Formation Across the Stellar Mass Spectrum Vol. 287 of Astronomical Society of the Pacific Conference Series, Intermediate Mass Stars (Invited Review). pp 163–173
- Torrelles et al. (2014) Torrelles J. M., Curiel S., Estalella R., Anglada G., Gómez J. F., Cantó J., Patel N. A., Trinidad M. A., Girart J. M., Carrasco-González C., Rodríguez L. F., 2014, MNRAS, 442, 148
- Vaidya et al. (2011) Vaidya B., Fendt C., Beuther H., Porth O., 2011, ApJ, 742, 56
- Vaytet & Haugbølle (2017) Vaytet N., Haugbølle T., 2017, A&A, 598, A116
- Vorobyov (2009) Vorobyov E. I., 2009, ApJ, 704, 715
- Vorobyov & Basu (2005) Vorobyov E. I., Basu S., 2005, ApJ, 633, L137
- Vorobyov & Basu (2010) Vorobyov E. I., Basu S., 2010, ApJ, 719, 1896
- Vorobyov & Basu (2015) Vorobyov E. I., Basu S., 2015, ApJ, 805, 115
- Vorobyov & Elbakyan (2018) Vorobyov E. I., Elbakyan V., 2018, ArXiv e-prints
- Vorobyov et al. (2017) Vorobyov E. I., Elbakyan V., Dunham M. M., Guedel M., 2017, A&A, 600, A36
- Vorobyov et al. (2017) Vorobyov E. I., Elbakyan V., Hosokawa T., Sakurai Y., Guedel M., Yorke H., 2017, A&A, 605, A77
- Yorke & Sonnhalter (2002) Yorke H. W., Sonnhalter C., 2002, ApJ, 569, 846
- Zakhozhay et al. (2018) Zakhozhay O. V., Miroshnichenko A. S., Kuratov K. S., Zakhozhay V. A., Khokhlov S. A., Zharikov S. V., Manset N., 2018, MNRAS, 477, 977
- Zhao et al. (2018) Zhao B., Caselli P., Li Z.-Y., Krasnopolsky R., 2018, MNRAS, 473, 4868
- Zhu et al. (2009) Zhu Z., Hartmann L., Gammie C., 2009, ApJ, 694, 1045
- Zhu et al. (2009) Zhu Z., Hartmann L., Gammie C., McKinney J. C., 2009, ApJ, 701, 620