The true nature of Swift J0746.3-1608: a possible Intermediate Polar showing accretion state changes2018The true nature of Swift J0746.3-1608: a possible Intermediate Polar showing accretion state changes–References
Abstract
Optical and X-ray observations suggested that the 9.38 h binary, SWIFT J0746.3-1608 could be a Cataclysmic Variable of the magnetic or nova-like type, or a low mass X-ray binary. Its optical, UV, and X-ray light curves are strongly variable over years. We report on a recent XMM-Newton observation (28 April 2018), when the source had recovered from a deep low state that likely begun mid-late 2011. We detect for the first time a signal at about 38 min that we interpret as the rotation of the accreting white dwarf primary. Its amplitude decreases with increasing energy, indicating localised photoelectric absorption from cold material. The X-ray spectrum shows optically thin thermal emission with excess at the iron complex, absorbed by a dense medium partially covering the X-ray source. Based on these features, we propose that SWIFT J0746.3-1608 is a magnetic CV of the Intermediate Polar (IP) type. The long-term light curves at different wavelengths show high and low states, a rare phenomenon in the IP subclass and observed so far in only three other systems. The long orbital period, the peculiar long term variability, and its proposed magnetic nature, makes SWIFT J0746.3-1608 an interesting evolutionary test case.
Keywords:
Novae, cataclysmic variables - white dwarfs - X-rays: individual: Swift J0746.3-1608 (aka 1RXS J074616.8-161127)1 Introduction
Intermediate Polars (IPs) are a subclass of Magnetic Cataclysmic Variables (MCVs), compact binaries where a magnetic (B G) white dwarf (WD) primary accretes matter from a Roche lobe overflowing main sequence or sub-giant secondary (Ferrario et al. 2015; Mukai 2017). Accretion onto the WD can occur through a disc or directly from a stream, depending on the magnetic field intensity and degree of asynchronism. IPs are usually desynchronized systems for which . Furthermore, a hybrid accretion in the form of disc overflow (Hellier 1995; Norton et al. 1997), is also possible, and frequently observed (Bernardini et al. 2012; Bernardini et al. 2017, see e.g.). In these accretion models, matter close to the WD surface is channeled along the magnetic field lines, and reaching supersonic velocities is forming a post-shock region (PSR) above the surface. The PSR is hot ( keV) and in IPs the flow cools and slows down mainly via bremsstrahlung radiation (hard X-ray) (Aizu 1973; Wu et al. 1994; Cropper et al. 1999). This X-ray emission is then pulsed at the spin period of the WD (disc-accretion), at the beat (disc-less) or at both periods in the case of disc overflow (Hellier 1995). The vast majority of IPs are persistent systems, but a small subgroup including FO Aqr, AO Psc, and V1223 Sgr, showed low accretion states (Garnavich & Szkody 1988; Kennedy et al. 2017; Littlefield et al. 2018). Such fading is believed to be due to a temporarily reduction of the mass transfer rate from the donor star (Livio & Pringle 1994).
SWIFT J0746.3-1608 (hereafter J0746) is one of the still unclassified sources in the high-energy catalogs (Oh et al. 2018; Bird et al. 2016). Optical follow-ups classified J0746 to be either a MCV or a nova-like system with a long, 9.38 h, orbital period. In X-ray, the "Neil Geherls" Swift satellite (hereafter Swift) observed the source to be highly variable (Thorstensen & Halpern 2013; Parisi et al. 2014). When first observed by XMM-Newton in 2016, it was at its lowest recorded flux level preventing a classification. Its X-ray spectral characteristics suggested either a MCV or a LMXB (Bernardini et al. 2017). An X-ray monitoring with Swift allowed us to detect a flux increase starting from November 2017, indicating the source had recovered from its lowest state and was rising towards the higher state. We here report on detailed timing and spectral analysis of a second XMM-Newton observation performed on 28 April 2018, when the source was a factor of about 20 brighter than in 2016. We complement the study with optical/UV and X-ray long-term light curves from the Swift UVOT and XRT instruments. These show that J0746 is a peculiar CV, likely a MCV of the IP type, which shows rapid and particularly intense accretion states changes.
2 Observation and data reduction
J0746 was observed on 28 April 2018 at 15:44:21 UTC by XMM-Newton (obsid 0830190701) with the European Photo Imaging Cameras (Strüder et al. 2001; Turner et al. 2001; den Herder et al. 2001, EPIC: PN, MOS1 and MOS2) complemented with simultaneous optical monitor (Mason et al. 2001, OM,) photometry in the U-band. The PN camera operated in timing mode, while the two MOS cameras in small window mode (thin filter always applied). The PN exposure was shorter than those with the MOS cameras (20 vs 22 ks). Data were reduced and inspected for all instruments, but due to the source nature (e.g. slow rotator), we only report on the MOS Cameras. Data were processed using the Science Analysis Software (SAS) version 16.1.0 and the latest calibration files available in 2018 May. Source photon event lists and spectra were extracted from a circular region of radius 40 arcsec. The background was extracted from a region free from sources contamination in the same CCD where the source lies. High particle background epochs were removed for the spectral analysis while, for the timing analysis, the entire dataset was used. RGS spectra from the standard SAS pipeline were used. The OM operated in fast window mode using the U-band (2600–4300 Å) filter (21.4 ks exposure). Light curves were extracted using the standard pipeline and corrected to the Solar System barycenter using the barycen task.
The task epiclccorr was used to generate background-subtracted light curves in the 0.3–2, 2–3, 3–5, 5–12, and the whole 0.3–12 keV band. Spectra were rebinned using specgroup imposing a minimum of 30 counts in each bin and a maximum oversampling of the energy resolution by a factor of three. Spectra were also extracted at the minimum and maximum of the spin cycle. MOSs spectra were fitted simultaneously by using Xspec version 12.9.1p package (Arnaud 1996). XRT (0.3–10 keV) and UVOT (U and UW1 band) Swift light curve and spectra were also extracted. For the XRT data we used the products generator available at Leicester Swift Science Centre (Evans et al. 2009), for the UVOT data we followed standard procedures (http://www.swift.ac.uk/analysis/uvot/).
3 Data analysis and results
3.1 Timing analysis
We first inspected the long-term optical, UV, and X-ray light curves recorded by Swift (Figure 1) binned with one point per obsid (typically there are a few snapshots about 500–1000 s long in each obsid). J0746 is highly variable both on short (less than a day) and long timescales (more than a day). Low and high flux states are clearly present, where we arbitrarily define and . The 0.3–10 keV flux was derived using the automatic pipeline by extracting one spectrum per obsid. Strong conclusions about state transitions (and duration) can not be made due to the sparse coverage. However, transitions seem to be rapid. On August 29, 2009 the flux decreased within less than a day from high ( ) to low ( ) state (first two points on the left of Figure 1). The opposite, fast, transition (low to high) was recorded in June 2011. J0746 was then found in the low state both in 2013 and 2015, and when observed by XMM-Newton in April 2016, where it was at its lowest recorded level ( ). The Swift monitoring that started in November 2017 showed the source rising towards higher levels which was confirmed in additional pointings in April-early May 2018. The second XMM-Newton observation took place in between the last two Swift observations, confirming the recovery to a high state. Flaring-like behaviour with amplitude was recorded during the high state, where the 0.3–10 keV flux can vary from to , for example (Thorstensen & Halpern 2013, see also Figure 7 in). The UV and optical light curves are broadly correlated to the X-ray light curve, with the UVW1-band ( Å) flux that was more than two magnitudes dimmer in 2013 with respect to 2011 (16.6 vs 14 mag). The XMM-Newton pointings showed the source at B mag in 2016 and at U mag in April 2018. Although observed in different energy bands the OM data confirms the source brightening in 2018.
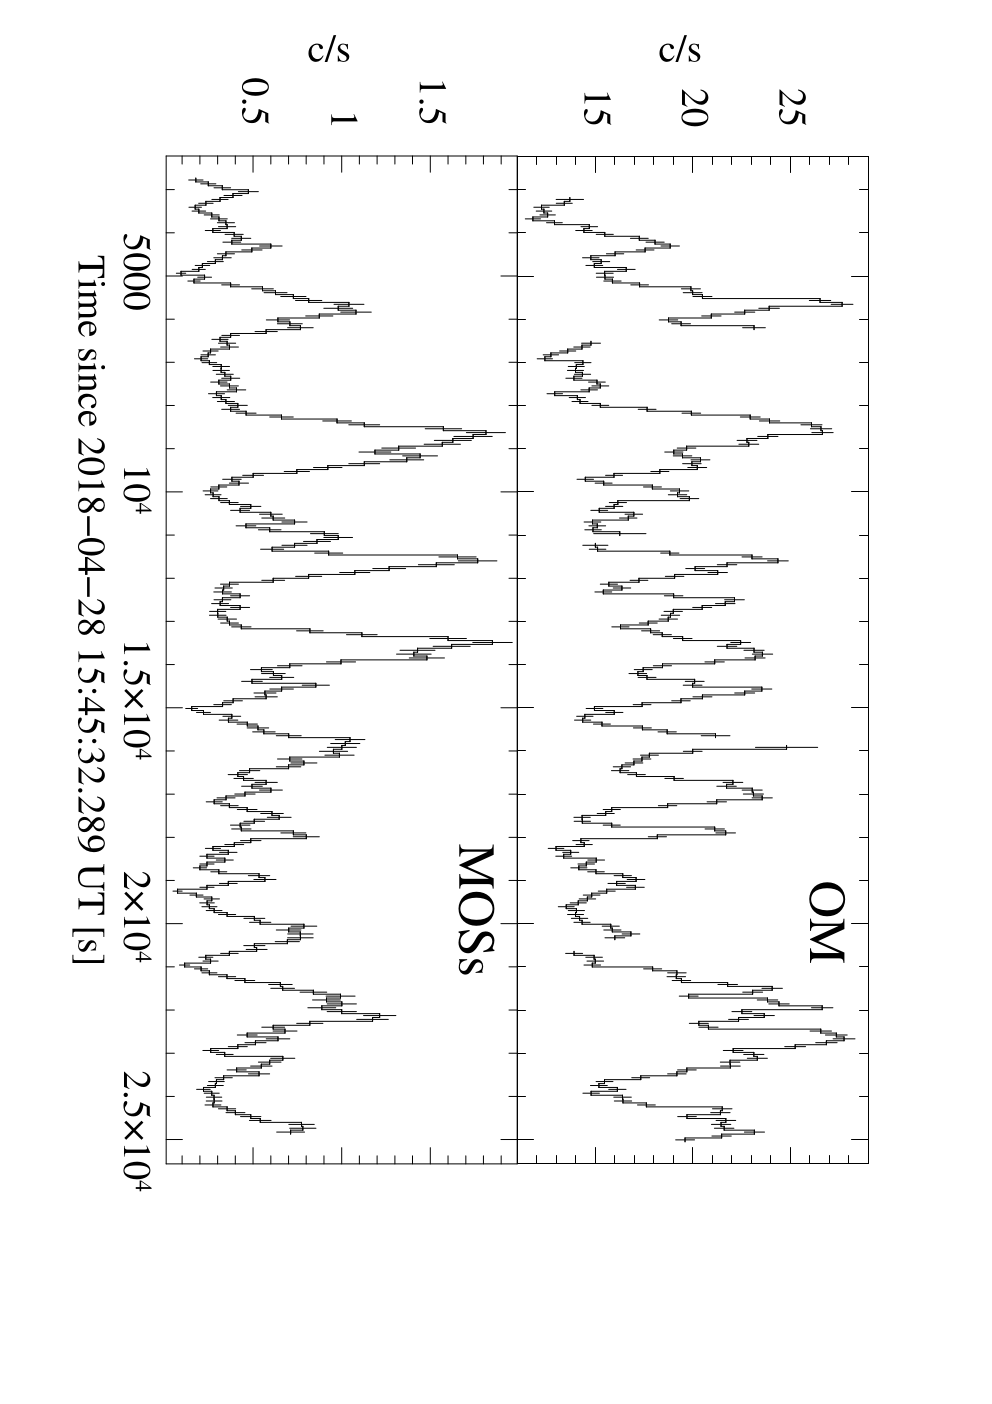
Both the EPIC MOSs event data and background subtracted light curves were summed together to study the time variability. The 0.3–12 keV and U-band light curves (Figure 2) are both strongly variable, with multiple peaks repeating on short timescale, where the 0.3–12 keV flux averagely changes by a factor of about 10 (2 in the U-band). Assuming a constant spectral shape (Sect. 3.2 and Table 1) the flux changes from a minimum of (0.1 c/s) to a maximum of (2 c/s). These strong changes are similar to those observed by XRT during the high state in August 2009. This indicates that J0746 is a strongly variable source at all energies, even during the high states.
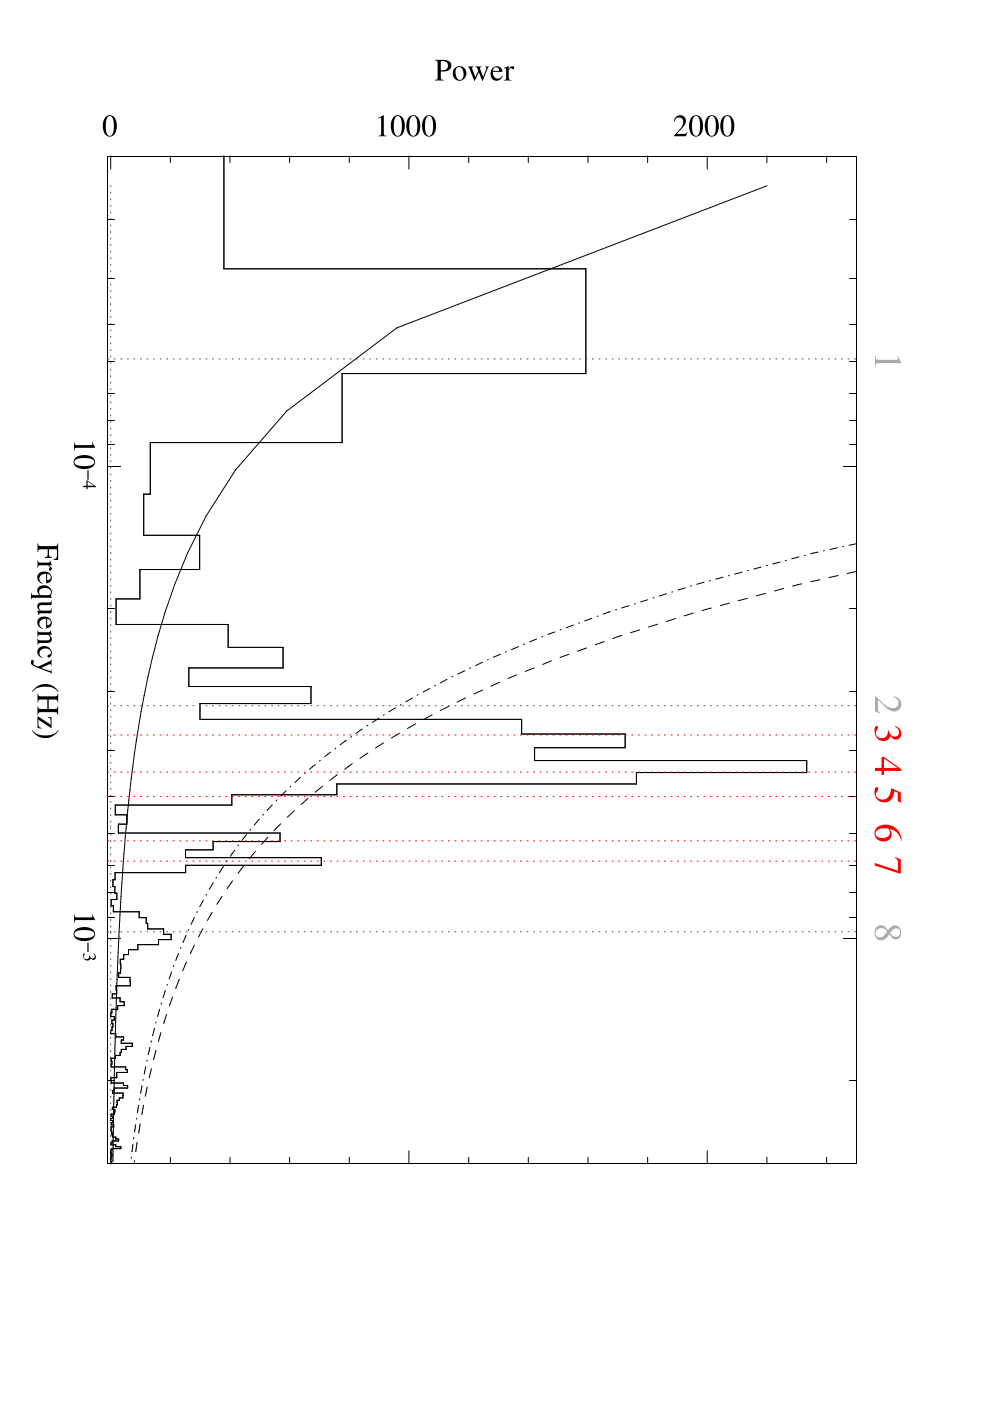
While no clear sign of a long-term periodic variation linked to the orbital period (9.38 h) is present, the strong variability over thousands of seconds hints at periodic signals. The power spectra were then computed in different energy ranges at the temporal resolution of the MOS cameras (0.3 s). They all show a structured peak in the range 0.35–0.5 mHz and a few weaker ones at both higher and lower frequencies. The lowest-frequency peak (P1, see Figure 3), although compatible with half of the 9.38 h orbital period, is as discussed below, not statistically significant and likely due to red-noise. The first harmonic of the orbital frequency (2) was found to dominate the B-band light curve during the low state in 2016, but not in the X-rays (Bernardini et al. 2017). The broadness of the main peak hints at the presence of multiple contributions of close periodicities. Therefore, we attempted to determine them using two different methods, concentrating on the softest 0.3–2 keV band. Firstly, we used the ftools task efsearch11 1 https://heasarc.gsfc.nasa.gov/ftools/. A Gaussian fit gives peak centroids at: P, P, P, P, P, and P s 22 2 With this method, P5 can not be separated from P4.. All uncertainty are hereafter reported at the confidence level. We also fitted the 0.3–2 keV light curve binned at 10 s resolution using the Period04 package (Lenz & Breger 2005) that allows to perform multi-sinusoidal fits by using the relevant frequencies identified by detrending the light curve iteratively. A fit with eight frequencies gave a reasonable reproduction of the light curve, although not satisfactory (, dof=2080). The uncertainties in the parameters were evaluated using Markov chain Monte Carlo (MCMC) simulations within Period04 package, performing 500 iterations. While P1 and P6 result unconstrained, we found: P s, P, P, P, P, and P. The latter values are consistent within uncertainties with those measured with efsearch. The significance of the peaks in the power spectrum, which is affected by red noise, was also evaluated. We followed Vaughan 2005 assuming a power-law for the underlying spectrum (P). The log-log periodiogram with bias removed was then fitted with a linear function with slope (, dof=367). We then evaluated the 95 and 99 per cent global confidence levels using 369 independent frequencies. Only the two broad peaks around 0.4 and 0.7 mHz (encompassing P3 to P7) are detected above the 99 per cent level (Figure 3).
The pulsed fraction (PF) 33 3 , where and are the maximum and minimum fluxes of the sinusoid at the fundamental frequency, respectively. was also computed as a function of the energy interval. We found that all signals have a constant PF with the exception of P4, where it significantly decreases with increasing energy (PF, PF, PF, and PF per cent; Figure 4). A typical characteristics of MCVs, and of IPs in particular, is the presence of a energy dependent spin periodicity, ascribed to photoelectric absorption from cold material within the magnetically confined accretion flow (Rosen et al. 1988). Assuming P4 as the spin () of the accreting WD, combining it with the orbital period from Thorstensen & Halpern 2013, we find for the significant periodicities that 1/P, 1/P, 1/P and 1/P, while no interpretation is found for P6. To our knowledge, P7 is not known to be strong in any other IPs. The spin is the highest signal in the 0.3–2 keV band and emerges from the broad peak in the region that would encompass , , and (Figure 3). We emphasize that a longer exposure would have improved the resolution allowing to separate from its closer sidebands. In conclusion, we propose that P s (about 38 min) is the spin period of the WD. We note that during the low state an indication of an X-ray periodicity at 2700 s was found, whose origin was unclear at that time (Bernardini et al. 2017), but we find it now consistent with .
In the U-band power spectrum, the strongest signal is P s, and P and P s are also present, while there is no power at P4 ().
To inspect spectral variation as a function of the spin period, the hardness ratio (defined as the count rate ratio in each phase bins between two selected energy ranges) were computed. The comparison between 0.3–2 and 3–5 keV clearly shows that the spin modulation is harder at minimum (HR) while it is softer (HR) at maximum.


3.2 Spectral analysis
J0746 spectrum is thermal and optically thin, with an excess at the iron complex (6.4–7.0 keV), as is typically observed in MCVs. These sources are characterized by multi-temperature spectra absorbed by dense cold material localized within the binary system, likely in the accretion column above the shock (Done et al. 1995; Ezuka & Ishida 1999; Bernardini et al. 2013; Mukai et al. 2015; Bernardini et al. 2017; Bernardini et al. 2018, see e.g.). The 0.3–10 keV spectrum was then fitted with a model made of an optically thin plasma component (mekal or cemekl in Xspec), where metal abundances (AZ) with respect to Solar, set to that of the ISM from Wilms et al. 2000, are left free to vary, plus a narrow Gaussian line fixed at 6.4 keV to account for the fluorescent Fe Kα line, all absorbed by a total (phabs) and a partial (pcfabs) covering columns. The use of pcfabs is justified by the fact that the PF decreases as the energy increases. We did not fit simultaneously the BAT spectrum accumulated over many years since it would require a cross normalization component of about 3. This implies that J0746 has been on average brighter than during the 2018 XMM-Newton pointing.
Both the multi-temperature plasma (cemekl) and the single temperature plasma (mekal) models provide an acceptable fit to the data (, 192 d.o.f., 193 d.o.f., respectively; Table 1 and Figure 6). The total absorber is two order of magnitude lower than that of the ISM in the source’s direction (Kalberla et al. 2005), suggesting a nearby source. The partial covering absorber has a column density cm-2 and a covering fraction cvf per cent. A soft blackbody component (kT eV), frequently found in the spectrum of MCVs, is not statistically required. The maximum plasma temperature of cemekl is kT keV, higher but consistent within with that measured with mekal. We stress that the former should be considered as a more reliable lower limit to the shock temperature 44 4 The cemekl maximum temperature slightly increases to keV when including the BAT spectrum and allowing for the large cross normalization.. We also derive a lower limit to the WD mass by using a more physical model developed by Suleimanov et al. 2005, which takes into account temperature, density, and gravity gradients within the PSR. We included in the fit the BAT spectrum as the model relies on the high energies to derive the mass. The eight-channel spectrum from the first 70 months of BAT monitoring (Baumgartner et al. 2013) available at the NASA GSFC site was used. The spectral analysis was restricted to 80 keV. A cross normalization constant and a broad Gaussian were added to account for flux variability and the iron line complex, respectively. The fit gives M (, 195 d.o.f.).
The RGS data show the presence of OVII line centered at keV, whereas the best-fit cemekl model hardly predicts any flux from this line (Figure 5). The equivalent width is 24 (8–40) eV, where the error is for 90% confidence level, fully accounting for the uncertainties in both the Gaussian and cemekl components. Similar excess of OVII line has been seen in several other IPs (de Martino et al. 2005, e.g. HT Cam,). The centroid energy could suggest a combination of resonant and intercombination components, while the forbidden component appears very weak. The detection OVII line clearly indicates that the post-shock region is multi-temperature, supporting our preference for the cemekl model.

To investigate the role of spectral parameters in generating the X-ray spin modulation, a (spin-)phase resolved spectroscopic analysis was performed. Spectra extracted at spin minimum () and maximum () were fitted separately using both models in Table 1. N, AZ, were fixed at their average spectrum values. All other parameters were left free to vary. For both models we found that the spin modulation is due to an increase of the covering fraction at spin minimum (from to per cent) and of the normalization at spin maximum (by per cent). As a last step, we compared the average high state spectral results with that from the low state (Figure 6, right panel). We used the data presented in Bernardini et al. 2017 and re-fitted them with both mekal and cemekl, fixing N and AZ to the average, high state, best fit values. We did not include the pcfabs and Gaussian components in the latter fit, because neither is statistically required. During the low state the source is softer, with kT keV, or kT keV (F ).

 |
| mod. | N | N | cvf | kT | n | AZ | EW | F0.3-10 | FX,bol | /dof |
| cm-2 | cm-2 | % | keV | keV | erg/cm2/s | erg/cm2/s | ||||
| cemeka | 0.0130.005 | 8.212 | 453 | b | 23 | 0.780.17 | 0.110.02 | 8.70.2 | 1.05/192 | |
| mek | 0.0150.005 | 9.31.2 | 463 | 6.20.3 | 0.670.14 | 0.110.01 | 8.70.1 | 1.06/193 |
a Multi-temperature power-law index .
b Maximum temperature.
4 Discussion and conclusions
The April 2018 XMM-Newton observation has shown that J0746 had recovered from its low state since mid-late 2011. Its orbital period is firmly established to be 9.38 h from optical spectroscopy (Thorstensen & Halpern 2013). We found an extremely variable X-ray source and identified a prominent periodicity at s, which we interpret as the spin period of the accreting WD. Due to the short X-ray coverage, we are unable to separate this periodicity from the beat, , and , the sidebands most commonly found in IPs power spectra. If it is the spin period of a magnetic WD, then J0746 is an IP with a spin to orbital period ratio P, fully consistent with the observed ratios in the majority of IPs (Norton et al. 2004; Norton et al. 2008; Bernardini et al. 2017). It shows a strongly variable X-ray light curve. The spin modulation is the strongest signal in the soft X-rays, as typically found in IPs due to the effects of photoelectric absorption in the magnetically confined accretion curtain. We also identified close-by sidebands, likely due to , , and , with possibly others combining together. Although not statistically significant at low frequencies, the signal at appears to affect the power spectrum also at higher frequencies. It was found to also dominate the optical light curve during the low state (Bernardini et al. 2017). The X-ray power spectra of IPs are often complex, with multiple sidebands between the spin and orbital frequency and combination of harmonics (Norton & Watson 1989). Theoretical power spectra reproducing the multiplicity of spin, sidebands, and harmonics (Norton et al. 1996) as those observed in J0746 would require a complex geometry, likely involving non-symmetric opposite poles unequally contributing. This makes SWIFT J0746.3-1608 power spectrum particularly interesting for future works to solve the accretion geometry in a likely more complex magnetic field configuration.
We derived the distance of J0746 from the ESA GAIA DR2 data release (Gaia Collaboration et al. 2016; Gaia Collaboration et al. 2018). J0746 has a well constrained trigonometric parallax mas which, using space density prior based on the Galactic tridimentional model as seen by Gaia (Bailer-Jones et al. 2018, see details in), translates into a distance pc. Using and the low and high state bolometric fluxes (FX,bol), assuming , and using M, we obtain the following mass accretion rates: and , a change of factor . Therefore, J0746 is a rare X-ray selected MCV showing extreme high and low X-ray states. In that respect, J0746 is reminiscent of the IP FO Aqr (Littlefield et al. 2016; Kennedy et al. 2017), where . In addition, Šimon 2015 reports on the optical and Swift/BAT low states of another IP, V1223 Sgr, and a optical low state of AO Psc is also known (Garnavich & Szkody 1988) although, in this case, we do not know if it was accompanied by an X-ray low state. Finally, the peculiar, long orbital period CV, Swift J1907.3-2050=V1082 Sgr, also exhibits high and low states in the optical and flaring behavior in its X-ray light curve (Thorstensen et al. 2010; Bernardini et al. 2013). If the IP classification is correct, it makes J0746 only the second IP, after FO Aqr, to have been observed in X-rays in high and low states. This kind of state transitions in CVs are thought to be due to changes in the mass transfer rate from the donor star. These are possibly due to surface magnetic spots that concentrates in front of the inner Lagrangian point (L1) partially filling it, so temporarily reducing the mass transfer (Livio & Pringle 1994). The presence of star spots has been inferred for the first time in the donor of the IP AE Aqr (Hill et al. 2016), although it has never been observed to undergo state changes. Star spots have been claimed to be responsible for the low states of Polars and of the state changes in FO Aqr (Kennedy et al. 2017). We note that, interestingly, star spots at L1 should produce random (e.g. not periodic) state transitions (Hessman et al. 2000), as we indeed observed in J0746. We suggest that in the low accretion state the disc is depleted and the accretion occurs mainly by a stream. Moreover, a negligible absorption is expected in the X-rays due to the reduced mass accretion rate onto the WD. Indeed during the low state, the source is faint, showing no sign of intrinsic absorption, and only the sideband () is detected at X-ray wavelengths, while there is no power at the spin, indicating that accretion directly impacts the WD without an intervening disc. At optical wavelengths, is detected, suggesting a strong contribution of ellipsoidal modulation of the donor and consequently a faint disc. During the high state instead, likely the disc is well developed, accretion proceeds from the disc along the field lines over the polar regions, and the local absorption is much higher (N cm-2). The presence of several sidebands of the spin and orbital periods would also suggest a contribution of disc-overflow (Hellier 1995). Our results on the very recent recovery to the high accretion state in J0746 and its possible IP classification show that the occurrence of high and low states, although rare in this class of MCVs, is a phenomenon common to all types of CVs. Particularly interesting is J0746 long orbital period. The three confirmed IPs observed so far to display high/low states have all shorter orbital periods, with AO Psc and V1223 Sgr in the 3–4 hr range of VY Scl stars, and FO Aqr at 4.85 h (while the peculiar CV V1082 Sgr has 20.8 h). V1223 Sgr has shown extended ( yr) low states and the other two systems have undergone short epochs of low accretion rates, with FO Aqr slowly recovered from a low state in 2016 in about a hundred of days (Garnavich & Szkody 1988; Littlefield et al. 2016). In May 2018, FO Aqr showed its third low state in 2 years, despite it was always found at a constant luminosity level before 2016 for about 100 years (Littlefield et al. 2018). J0746 is at 9.38 h and shows the fastest state transitions (less than a day). This makes this source (and long period systems in general) particularly interesting since their donors should be nuclear evolved (Goliasch & Nelson 2015) and thus could be test cases to understand angular momentum loss governing their evolution towards short orbital periods (Spruit & Ritter 1983; Andronov et al. 2003). State transitions remain a complex still not understood phenomenon observed not only in CVs, but also in LMXBs that needs clear explanation. J0746 recently returned to a strongly variable high state, and follow up multi-band monitoring, possibly capturing state transitions, would be particularly important.
Acknowledgements
We thank Dr. Norbert Schartel and the Swift team for granting DDT XMM-Newton and Swift time, respectively. We acknowledge useful discussion with Gianluca Israel. We thank the anonymous referee for the useful comments. FB is founded by the European Union’s Horizon 2020 research and innovation programme under the Marie Sklodowska-Curie grant agreement n. 664931. DdM is supported from the Italian Space Agency and National Institute for Astrophysics, ASI/INAF, under agreements ASI-INAF I/037/12/0 and ASI-INAF n.2017-14-H.0. This work is based on observations obtained with XMM-Newton, an ESA science mission with instruments and contributions directly funded by ESA Member States, with Swift, a NASA science mission with Italian participation, and with Gaia, a ESA mission. Gaia data are processed by the Data Processing and Analysis Consortium (DPAC).
References
- Aizu (1973) Aizu K., 1973, Prog. Theor. Phys., 49, 1184
- Andronov et al. (2003) Andronov N., Pinsonneault M., Sills A., 2003, ApJ, 582, 358
- Arnaud (1996) Arnaud K. A., 1996, in Jacoby G. H., Barnes J., eds, Astronomical Society of the Pacific Conference Series Vol. 101, Astronomical Data Analysis Software and Systems V. p. 17
- Bailer-Jones et al. (2018) Bailer-Jones C. A. L., Rybizki J., Fouesneau M., Mantelet G., Andrae R., 2018, AJ, 156, 58
- Baumgartner et al. (2013) Baumgartner W., Tueller J., Markwardt C., Skinner G., Barthelmy S., Mushotzky R., Evans P., Gehrels N., 2013, ApJS, 297, 19
- Bernardini et al. (2012) Bernardini F., de Martino D., Falanga M., Mukai K., Matt G., Bonnet-Bidaud J.-M., Masetti N., Mouchet M., 2012, A&A, 542, A22
- Bernardini et al. (2013) Bernardini F., et al., 2013, MNRAS, 435, 2822
- Bernardini et al. (2017) Bernardini F., de Martino D., Mukai K., Russell D. M., Falanga M., Masetti N., Ferrigno C., Israel G., 2017, MNRAS, 470, 4815
- Bernardini et al. (2018) Bernardini F., de Martino D., Mukai K., Falanga M., 2018, MNRAS, 478, 1185
- Bird et al. (2016) Bird A. J., et al., 2016, ApJS, 223, 15
- Cropper et al. (1999) Cropper M., Wu K., Ramsay G., Kocabiyik A., 1999, MNRAS, 306, 684
- Done et al. (1995) Done C., Osborne J., Beardmore A., 1995, MNRAS, 276, 483
- Evans et al. (2009) Evans P. A., Beardmore A., Osborne J., O’Brian P., Willingale R. andStarling R., Burrows D. e. a., 2009, MNRAS, 397, 1177
- Ezuka & Ishida (1999) Ezuka H., Ishida M., 1999, ApJS, 120, 277
- Ferrario et al. (2015) Ferrario L., de Martino D., Gänsicke B. T., 2015, Space Sci. Rev., 191, 111
- Gaia Collaboration et al. (2016) Gaia Collaboration et al., 2016, A&A, 595, A2
- Gaia Collaboration et al. (2018) Gaia Collaboration Brown A. G. A., Vallenari A., Prusti T., de Bruijne J. H. J., Babusiaux C., Bailer-Jones C. A. L., 2018, preprint, (arXiv:1804.09365)
- Garnavich & Szkody (1988) Garnavich P., Szkody P., 1988, PASP, 100, 1522
- Goliasch & Nelson (2015) Goliasch J., Nelson L., 2015, ApJ, 809, 80
- Hellier (1995) Hellier C., 1995, in Buckley D. A. H., Warner B., eds, ASP Conf. Ser. Vol. 85, Magnetic Cataclysmic Variables. p. 185
- Hessman et al. (2000) Hessman F. V., Gänsicke B. T., Mattei J. A., 2000, A&A, 361, 952
- Hill et al. (2016) Hill C. A., Watson C. A., Steeghs D., Dhillon V. S., Shahbaz T., 2016, MNRAS, 459, 1858
- Kalberla et al. (2005) Kalberla P. M. W., Burton W. B., Hartmann D., Arnal E. M., Bajaja E., Morras R., Pöppel W. G. L., 2005, A&A, 440, 775
- Kennedy et al. (2017) Kennedy M. R., Garnavich P. M., Littlefield C., Callanan P., Mukai K., Aadland E., Kotze M. M., Kotze E. J., 2017, MNRAS, 469, 956
- Lenz & Breger (2005) Lenz P., Breger M., 2005, Communications in Asteroseismology, 146, 53
- Littlefield et al. (2016) Littlefield C., et al., 2016, ApJ, 833, 93
- Littlefield et al. (2018) Littlefield C., Stiller R., Hambsch F.-J., Shappee B., Holoien T., Garnavich P., Kennedy M., 2018, The Astronomer’s Telegram, 11844
- Livio & Pringle (1994) Livio M., Pringle J. E., 1994, ApJ, 427, 956
- Mason et al. (2001) Mason K. O., et al., 2001, A&A, 365, L36
- Mukai (2017) Mukai K., 2017, PASP, 129, 062001
- Mukai et al. (2015) Mukai K., Rana V., Bernardini F., de Martino D., 2015, ApJ, 807, L30
- Norton & Watson (1989) Norton A. J., Watson M. G., 1989, MNRAS, 237, 853
- Norton et al. (1996) Norton A. J., Beardmore A. P., Taylor P., 1996, MNRAS, 280, 937
- Norton et al. (1997) Norton A. J., Hellier C., Beardmore A. P., Wheatley P. J., Osborne J. P., Taylor P., 1997, MNRAS, 289, 362
- Norton et al. (2004) Norton A. J., Wynn G. A., Somerscales R. V., 2004, ApJ, 614, 349
- Norton et al. (2008) Norton A. J., Butters O., Parker T., Wynn G. A., 2008, ApJ, 672, 524
- Oh et al. (2018) Oh K., et al., 2018, ApJS, 235, 4
- Parisi et al. (2014) Parisi P., et al., 2014, A&A, 561, A67
- Rosen et al. (1988) Rosen S. R., Mason K. O., Cordova F. A., 1988, MNRAS, 231, 549
- Spruit & Ritter (1983) Spruit H. C., Ritter H., 1983, A&A, 124, 267
- Strüder et al. (2001) Strüder L., et al., 2001, A&A, 365, L18
- Suleimanov et al. (2005) Suleimanov V., Revnivtsev M., Ritter H., 2005, A&A, 435, 191
- Thorstensen & Halpern (2013) Thorstensen J. R., Halpern J., 2013, AJ, 146, 107
- Thorstensen et al. (2010) Thorstensen J. R., Peters C. S., Skinner J. N., 2010, PASP, 122, 1285
- Turner et al. (2001) Turner M. J. L., et al., 2001, A&A, 365, L27
- Vaughan (2005) Vaughan S., 2005, A&A, 431, 391
- Wilms et al. (2000) Wilms J., Allen A., McCray R., 2000, ApJ, 542, 914
- Wu et al. (1994) Wu K., Chanmugam G., Shaviv G., 1994, ApJ, 426, 664
- de Martino et al. (2005) de Martino D., et al., 2005, A&A, 437, 935
- den Herder et al. (2001) den Herder J. W., et al., 2001, A&A, 365, L7
- Šimon (2015) Šimon V., 2015, in The Golden Age of Cataclysmic Variables and Related Objects - III (Golden2015). p. 22