Understanding the effect of the base oil on the physical adsorption process of organic additives using molecular dynamics
Abstract
Organic friction modifiers (OFMs) are widely added to oil to reduce the boundary friction in many kinds of lubricants such as vehicle engine oils. At the contact area in machine elements, the OFMs form a self-assembled organic monolayer. Although the friction properties of the monolayer are widely studied on a molecular level, the formation process is not well-known. In this study, the initial adsorbing process of additive molecules in explicit base oil molecules are calculated using molecular dynamics. The adsorption time depends on the structure of the base oils. Another effect of the base oil other than ”chain matching” is found.
1 Introduction
In machine elements, there are many interfaces that perform relative motions, and it is necessary to control the friction and wear generated between the two surfaces. The control of friction and wear leads to the suppression of energy loss, vibration, improvement of function, performance, and reliability at the entire mechanical system. In order to inhibit the contact between the two surfaces, hydrodynamic lubrication by oil may be the best solution. There are, however, many systems that cannot maintain the hydrodynamic lubrication film due to the sliding condition. A boundary lubrication film is the candidate to decrease the friction in such solid contacts. Organic friction modifiers (OFMs) or oiliness agents are some of the most popular additives which produce a boundary lubrication film [Bowden and Tabor(1964)].
OFM additive molecules are composed of alkyl chains and polar groups on the end. Fatty acids are the first used OFMs [1]. The polar group adsorbs on the metal surface and the molecules form a self-assembled monolayer (SAM). The mechanical and physiochemical stability of the monolayer is important to protect the metal surface and to reduce friction.
In the long history of the friction modifiers, OFMs are the most common, which have been used since the 1920s, and widely studied [1]. The most important idea is the formation of an adsorbed self-organized layer by Bowden and Tabor [Bowden and Tabor(1964)]. After this model, the concept of ”chain matching” by Askwith et al. [2] is the important finding in order to consider the effect of the base oil (solvent). If the chain length of the fatty acid additive is same as the chain length of the base oil, the system shows a lower friction than other base oils. Although this idea is supported by experiments, such as the experiments focused on nucleation and crystal growth [3], the precise mechanism of low friction is still an open question [4].
Molecular dynamics (MD) simulations are used to understand the friction phenomena of SAMs, since the MD is the most useful tool to understand the dynamics of SAMs and comparable with the experimental data obtained by a surface force apparatus (SFA) or atom force microscope (AFM) [1]. The MD simulation demonstrated that the friction behavior of the SAMs obtained by AFM experiments is well described by the simulation between the hard AFM tip and the soft SAMs [5, 6, 7, 8]. This was one of the most studied friction systems using MD during the early stage of the nano tribology studies. Recent nonequilibrium molecular dynamics (NEMD) studies show moer detailed structure and friction behavior of OFMs [9, 10, 11], and NEMD of OFM reverse micelles adsorption behaviour under shear [12, 12]. Tight-binding quantum chemistry calculations [14, 15] and density functional theory claculations [16]. have also been used to study OFM adsorption [14, 15, 16]. These methods are required to accurately reproduce strong chemisorption observed in XPS experiments [15], but are computationally expensive and limited in terms of accessible system size and timescales.
The formation process of the monolayers, on the other hand, is not yet well known. In experiments, adsportion process is observed by polarized neutron reflectometry [17] or AFM [18], however, the observation of the initial process is difficult.
The major part of the tribological use of the OFMs used in the solution of the base oil is more than 90 %, and a small amount of additives. In the engine oil of the automobile, the percentage of the OFMs are only a few percent. It is known that only 0.5 % OFMs makes the friction lowering effect significantly [1]. When simulating the solution including 4 % additives by MD, about 96 % of the calculation cost is devoted to the calculation of the fluctuation of the base oil molecules. The formation process of the SAMs using a coarse-grained MD simulation is proposed [20]. Both the adsorption process of the additives and the formation of SAM by aggregation of the adsorbed molecules are simulated. In the simulation, however, the solvent molecules are described as a single sphere molecule using the Lennard-Jones attractive or soft-core repulsive interactions. The effect of the structure of solvent molecules can not be discussed by the sphere model in the coarse-grained simulation. In order to directly know the solvent effect, such as chain matching, the all-atom MD simulation is more appropriate. All-atom force-fields have also important to accurately model OFM film strucure and friction [19].
In this study, the all-atom MD simulation is used to solve the solvent (base oil) effect on the formation process of the OFM film. Since the calculation cost of the base oil is high, only the beginning process of the adsorprtion is discussed here. However, an interesting effect, i.e., the adsorption time varies with the structure of the layer of the base oil molecules is found.
2 Simulation Methods
All-atom MD simulations of the adsorption process of additives (OFMs) are done in the following manner. Schematic picture of the simulation model is shown in Fig. 2, and step by step procedure for preparing the model solution is shown in Fig. 3.
The solution with the hydrocarbon base oil and additives is confined by two solid layers. The top solid layer is a neutral Fe wall and the bottom solid layer is a charged Fe wall (Fig. 2). The Fe walls are modeled as a universal model of solid materials. Then the charge on the bottom solid layer is put, then the adsorption process was simulated. The precise conditions are described as follows.
First, three types of solutions of the base oil with additives under standard conditions is prepared. The base oil (solvent) of n-hexadecane, 2, 4-dimethyltetradecane, and 3, 5-dimethydodecane with the additive (solute) of palmitic acid was chosen as the linear and branched base oils with the solute of the same number of carbons. The latter branched base oils are taken from the structure of the Olefin Copolymer, or Poly olefin. In the MD simulation, the organic molecules are dynamically treated using the Dreiding force field [21]. This all-atom force field include bonds, angles, dihiderals (torsions) and improper torsions for the intra-molecular forces, and Lennard-Jones and Coulomb for the inter-molecular forces. The partial atomic charges on the organic molecules are determined using the MOPAC6 [22] semi-empirical molecular orbital calculation with the Hamiltonian:AM1.
A set of organic molecules is first arranged in a lattice configuration. 96 base oil molecules and 4 solute molecules are arranged in order to set the concentration of the additive at 4 % (Fig. 3(a)), which is the commonly used condition such as in engine oil for automobiles. The size of the simulation box was 27.31 Å along the axis, 32.77 Å along the axis and an arbitrary length for the axis, since the system is then pressed. The molecules are then moved by the MD simulation under the periodic boundary condition in the directions, and reflective wall in the direction, for 500 ps at the constant temperature of 1,000 K in order to anneal the system (Fig. 3(b)).
The MD simulation is then done for 10 ns in order to cool the system to 300 K. The temperature is controlled using the Nose-Hoover thermostat [25, 26, 27]. Then the system is pressed to the direction so that the density of the base oil is the same as the experimental value [28]. The solution in a thermal equilibrium is obtained (Fig. 3(c)). Next, 3 sets of thermal equilibrium fluids are arranged in the direction between the two solid plates, (Fig. 3(d)), in order to form a semi-bulk region in the center of the oil film. The final thickness of the solution in the direction is 194.19 Å. On the and axes, periodic boundary conditions are adopted. On the axe, non-periodic boundary conditions are adopted.
All the organic molecules are connected to a Nose-Hoover thermostat. The long-range Coulombic interactions are calculated by the Multi-Summation Method [29]. This method enables to simulate a non-periodic system. The equations of motion were integrated using a velocity-Verlet method [30] with a time step of 2.0 fs. This time step is long for all-atom simulation. During the simulation, a drift of conserved quantity such as temperature are not found. Since the phenomena is governed by long-range coulomb interaction between the surface and the functional group, and the dynamics of not the hydrogen-carbon but carbon-carbon bonds are critical, we think this phenomena will reproduce at least qualitatively in shorter time step.
Each system was calculated five times, while changing the initial speed. The adsorption dynamics changes drastically by initial speed.
The universal solid plate (wall) to analyze the adsorption process is made by the following procedure. We propose this in order to treat both charged oxidized metal surfaces and the neutral metal surface with the least difference, i.e., the existance of a charge on the surface. If the chemical reality of the surface, including the chemical reactions is in interest, a more realistic model such as copper and copper oxide surface treated by reactive force field should be used [31]. We are now interested in the physical nature of the interface and this model succeeded in reproducing the formation of the elastohydrodynamic lubrication oil film [32, 33, 34]. The parameter for the solid is taken from an alpha-ferrous crystal, a solid atom layer with a lattice of 11 7 5 atoms in the and directions, respectively, and the lattice parameter is set to 2.87 Å. The fluid-solid interface is the (110) surface, and the vibrations of each solid atom are suppressed. These atoms are not connected to the Nose-Hoover thermostat.
The parameter for the solid atoms is then set to 0.2853 Kcal/mol [32]. This parameter is taken from previous study [35] and it is known that the macroscopic slip between solid atoms and fluid molecules under sliding motion are supressed [32].
We then arranged only the bottom solid wall which is charged. The charge distribution on the surface of the solid wall is shown in Fig. 4. The outermost layer is charged at +1e, and the second layer is charged at -1e in order to make system electrical neutral.
3 Results and Discussion
Figure 5 shows snapshots of the adsorption process of the palmitic acid molecule in the n-hexadecane solution on the charged surface. It is obvious that the base oil molecules construct the absorbed layer in the vicinity of the solid wall. The phenomena are suggested by many studies [32, 33, Israelachvili(2010), 36, 37]. The fluid molecules show an oscillating density profile at the interface of the solid atoms [36] due to the cohesive force arising from the attraction potential of the solid atoms to the fluids. In this solution system, since the number of base oil atoms is much higher than the solute palmitic acid, the adsorbed layer of the base oils behave as the wall to inhibit the adsorption of the solute molecules. Subsequently, the palmitic acid molecule breaks through the absorbed layer of the base oils at t = 5.56 ns (this time depends on the initial condition) shown in Fig. 5 (d). This is due to the long-range Coulomb force between the solid atoms and the carboxyl group of the palmitic acid.
The strength of the layer formation of the base oil molecules is also shown by the time development of the fluctuation in the direction of the palmitic acid molecules. Figure 6 shows the time history of two palmitic acid molecules selected from the same ensemble of the solution. In the time development of the finaly adsorbed molecule shown in Fig. 6 (b), the molecule first stays at Å, then stays around this height. After 1.5 ns, it start to descend from Å to Å at t = 4.3 ns and suddenly touches the solid surface. In the time development of the finally not adsorbed molecule shown in Fig. 6 (c), the molecule fluctuates around Å for about 2 ns, then moves in the opposite direction from the surface. This results shows that about a 20 Å thick layer inhibits the palmitic acid molecules to form touching the surface of the solid layer by forming the adsorbed layer.
In the initial condition, in all case, the nearest molecule to the solid surface position are in Å. However, this does not mean the nearest molecule first reach to the solid surface. Even if the initial distribution of the molecules are same, the movement of molecules are very different due to the difference of the initial velocity.
Figure 6 also shows that the time for the first molecule to reach the surface takes about 4.5 ns. The question then arises whether this time will change due to the structure of the base oil molecule. Figure 7 shows the adsorption time, which is the time the palmitic acid molecules first reaches the surface of the solid layer in the 3 base oils, i.e., n-hexadecane and 2, 4-dimethyltetradecane, and 3, 5-dimethydodecane. In each solution, 5 simulations are done by changing the seed of the random number which decides the initial velocity of each atom in the solution. The graph even shows that the difference in the adsorption time in the same base oil molecules is high and the adsorption time between the base oil molecules remarkably differs. The branhced molecules show half the adsorption time vs. the linear molecules, and the time also differs between the two branched molecules. If the length of the branched chain is long (3, 5-dimethydodecane), the adsorption time is long. Therefore, we confirmed that not only the structure [38], but the adsoption time due to the structure of the base oil molecules can be detected using the molecular dynamics simulation.
The difference in the adsorption time may due to structuring of the base oils. Structuring of the base oil in the systems of a branched alkane is weaker than that in the system of a linear alkane. It is thought that the branched alkane side-chains reduce the pair-potential vibration [Israelachvili(2010)].
In order to understand the mechanism, density profiles of each of the base oil molecules are plotted in Fig. 8. The oscillation of the density is clearly shown in the vicinity of the solid atom, and the peak differs between the base oil molecules. The graph also shows that even the system in the direction is asymmetric due to the difference between the charged and not-charged walls, while the distribution the of base oil is not almost different. This is because the base oil molecules, which are made of alkyl chains, are not polarized, so the charge on the solid layer does not affect the structuring, and the van der Waals interaction becomes dominant. In the center of the oil film, a plateau region of the density profiles is found. This means that the film thickness of our simulation is large enough so that the adsorption process from the bulk region to the structured region can be discussed [9, 11].
In order to see the precise distribution of the base oil molecules, the enlarged view of Fig. 8 (a) is plotted in Fig. 8 (b). It is clearly shown that the order of the structuring of the base oil is n-hexadecane, 2, 4-dimethyltetradecane, and 3, 5-dimethydodecane, which is consistent with the length of the adsorption time.
The Fourier power spectrum of the density profile can be used to analyze the strength of the order and periodicity of the molecular distribution [32]. Figure 9 shows the Fourier power spectrum obtained from Fig. 8. The spectrum is calculated using the Octave FFT analyzer [39], and the number of data points is 512 using the rectanglular window as the window function. The peak of the wavelength is about 5 to 6 Å, which is equal to the width of the alkyl chain. The order of the structuring of the base oil is n-hexadecane and 2, 4-dimethyltetradecane, then 3, 5-dimethydodecane. The peak of 3, 5-dimethydodecane is very broad compared to the peak of n-hexadecane. Therefore, we can confirm that the structuring of the base oil is very different between the structure of the base oil molecules, and the more structured system takes more time for the additive molecules to adsorb onto the surface.
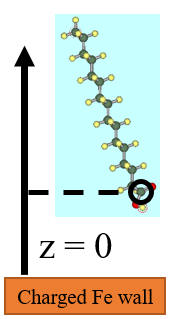
The structure of the base oil at the interface is also understood by the order parameter. The order parameter is defined as the sum of the angle between the direction of the plane and the direction of the end-to-end vector of the base oil molecules. The end-to-end vector is defined as the vector between the most topologically separated carbon atoms of each molecules. In 2, 4-dimethyltetradecane, one carbon atom at the end of alkyl chain in the branched side (see Fig.1) is randomly chosen as the one side. The order parameter is then defined as follows:
| (1) |
where denotes the ensemble average and the is taken from the center of the mass of each molecule. when the end-to-end vector is in the same direction of the plane. When the end-to-end vector is random, is zero since in the random distribution of .
Figure 10 shows the order parameter in the vicinity of the solid surface. In all types of base oil molecules, is almost 1, since the center of mass is the lowest value, and almost all the carbon atoms are in the lowest coordinate. The suddenly decreases with the increase in and shows a minimum when is about 5.0 Å. Comparing this graph with Fig. 8 (b), this region corresponds to the intermediate part of the molecular layer. When the center of mass is in this region, molecules are bridging between the two neighbor molecular layers. The then shows a higher value, which means the molecules are more against the plane. The then increases again, since this region is the second molecular layer counted from the surface. The then periodically oscillates as the increases and reaches to the plateau value. Comparing the base oil molecules in this region, n-hexadecane shows the most ordered structure and 2, 4-dimethyltetradecane and 3, 5-dimethydodecane are less structured. Therefore, we can understand from this viewpoint that the linear alkane molecules are much more structured than the branched molecules. The steric hindrance of the linear alkane molecules are much larger than the branched molecules. If the order parameter is small which mean the molecules are randomly distributed, there may be a gap which the additive molecule can pass through, but when the base oil make a a more structured layer as in the linear alkane, such as n-hexadecane, the additive molecule is hard to go through a small gap.
The adsorption process is a dynamic process in which the additive molecules diffuse through the base oil layers and reach the solid surface. In order to understand the dynamics, analyzing the diffusion of the additive molecules is the best way to show the adsorption mechanism. The number of additive molecules, however, is too low in the MD simulations, thus it is very hard to directly obtain the diffusion coefficient of the additive molecules. Even if the avaraged diffusion constant of additive molecules are obtained, the critical diffusion process is the diffusion in the vicinity of the surface. Therefore, the distribution of diffusion coefficient is needed to discuss. In the dilute solution under considering, the diffusion coefficient of additive molecules shows large fluctuation. Therefore, we calculated the diffusion coefficients of the solvent base oil molecule, in order to clarify the mechanism. The diffusion coefficient of the additive moleule and linear alkane may be similar, since the molecular weight and structure is similar, and interactino between polar groups would not affect in dilute solution. The diffusion coefficient of the additive moleule and branched alkane may be different. Therefore, this analysis of diffusion may be completed in the later studies using more powerful computers.
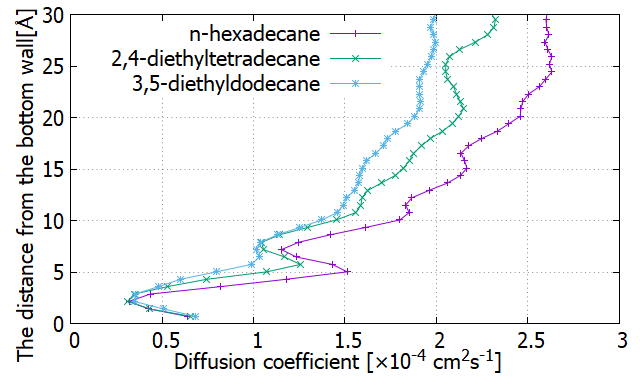
Figure 11 shows the self-diffusion coefficients as the function of the coordinate. is calculated by the following equation.
| (2) |
where is the time and is the coordinate at time . is calculated for every 20 ps of motion of the base oil molecules so that the long-range dynamics are taken. In Fig. 11, decreases as the coordinate decreases from the center of the oil film. This is because the structured oil film in the vicinity of the interface affects not only the static structure but the dynamics is different in the interface. The peak shown at the very low is due to the rebound motion of the reflective solid layer. Each base oil molecule almost stops the motion at = 2.5 Åwhich is the peak of the first molecular layer shown in Fig. 8. then shows the minimum at the intermediate region of the layers and shows maximum at the peak of the layers. Comparing the three base oils, the value of n-hexadecane is the highest except in the first layer. This means that the motion of the molecules are not suppressed in the whole solution, but the structured molecular layer, especially at the first layer, acts as the hardest barrier to the adsorption process.
The diffusion coefficients in bulk calculated by the MD simulation are not well predicted in some studies [40, 41, 42]. However, our calculated diffusion coefficient is on the same order (1.0).
Usually, the adsorption dynamics of molecules are separated into two process, i.e., the adsorption limited process and diffusion limited process [20]. The former is the difficulty of the physical adsorption using the surface interaction. The latter is the diffusion of the additive molecule in the base oil. In a previous study using coarse grained molecular dynamics [20], it showed that the diffusion limited adsorption is the major process. In our study, however, the motion of the additive molecule to break through the first structured layer of the base oil is the limiting process, which mean although the ratio of the importance of both process can not be determined, since the simulation time and space is limited, adsorption limited process is also important.
The diffusion coefficient is rather higher in the linear alkane but the adsorption time is longer in it. The difference in the phenomena is understood by the difference in the base oil model we used.
In real phenomena, this means that not only the structure of additive molecules [14], but the structure of the base oil is important to evaluate the efficiency of the surface protection. The formation time of the adsorbed additive layer, as well as the coverage ratio [10], is important in the case such as the sliding speed of the machine element is high and the pressure is high enough to break the adsorbed layer. If the sliding condition is mild, the stability of the adsorbed layer is more important, which mean the chain matching phenomena may be dominant. There are few studies which take into consideration the formation process of the adsorbed additive layer in tribology. We would like to note that structuring of the base oil on the surface is very important for the friction control using OFMs.
A further study may include the succeeding process of adsorbed additive layers, concentration dependence of additive molecules, and the chemical effect of surface and additives.
4 Conclusions
Using an all-atom molecular dynamics with an explicit base oil, the phenomena that the molecules of the additives break through the adsorbed layer of the base oil is observed. The relative adsorption time depends on the structure of the base oil molecules. The adsorption process is hence not a diffusion limited but adsorption limited process. The result reveals that the structuring of the base oil molecules near the solid wall causes a limitation for the adsorbing process. This phenomena will result in the boundary lubrication effect of the machine elements.
Acknowledgements
This study was supported by JSPS (Japan Society for the Promotion of Science) KAKENHI (Grants-in-Aid for Scientific Research) Challenging Research (Exploratory) Grant Number 18K18813. We also thank Dr. Hiroaki Koshima and Dr. Kazuhiro Yagishita for their usefull discussions.
References
References
- [Bowden and Tabor(1964)] F. Bowden and D. Tabor, in The friction and lubrication of solids, Oxford: Clarendon Press, Oxford, 1964
- [1] H. Spikes, Tribol Lett, 60:5 (2015).
- [2] T. C. Askwith, A. Cameron, R. F. Crouch, Proc. R. Soc. Lond. A, 291, 500-519, (1966).
- [3] F. Hirano, T. Sakai, K. Kuwano, N. Ohno, Trib. Intl., 20, 4, 186 (1987).
- [4] A. Cameron, Tirb. Lett. 3, 13 (1997).
- [5] A. Koike, and M. Yoneya, Molecular dynamics simulations of sliding friction of Langmuir-Blodgett monolayers, J. Chem. Phys, 105, 6060, (1996).
- [6] A. Koike, and M. Yoneya, Effects of Molecular Structure on Frictional Properties of Langmuir-Blodgett Monolayers, Langmuir 13, 1718, (1997).
- [7] T. Ohzono, M. Fujihira, Molecular dynamics simulations of friction between an ordered organic monolayer and a rigid slider with an atomic-scale protuberance, Phys. Rev. B, 62, 17, 055-071, (2000).
- [8] Y. Leng, D. J. Keffer, and P. T. Cummings J. Phys. Chem. B, 107, 43, 11940, (2003).
- [9] M. Doig et al. Structure and Friction of Stearic Acid and Oleic Acid Films Adsorbed on Iron Oxide Surfaces in Squalane. Langmuir 30, 186-195 (2014).
- [10] J. P. Ewen et al. Nonequilibrium Molecular Dynamics Simulations of Organic Friction Modifiers Adsorbed on Iron Oxide Surfaces. Langmuir 32, 4450-4463 (2016).
- [11] J. P. Ewen et al. Slip of Alkanes Confined between Surfactant Monolayers Adsorbed on Solid Surfaces. Langmuir 34, 3864-3873 (2018).
- [12] J. L. Bradley-Shaw et al. Molecular Dynamics Simulations of Glycerol Monooleate Confined between Mica Surfaces. Langmuir 32, 7707-7718 (2016).
- [13] J. L. Bradley-Shaw et al. Self-assembly and friction of glycerol monooleate and its hydrolysis products in bulk and confined non-aqueous solvents. Phys. Chem. Chem. Phys. 20, 17648-17657 (2018).
- [14] S. Loehle et al. Mixed Lubrication with C18 Fatty Acids: Effect of Unsaturation. Tribol. Lett. 53, 319-328 (2014).
- [15] S. Loehle et al. Mixed lubrication of steel by C18 fatty acids revisited. Part I: Toward the formation of carboxylate. Tribol. Int. 82, 218-227 (2015).
- [16] C. Gattinoni et al. Adsorption of Surfactants on ¡alpha¿-Fe2O3(0001): A Density Functional Theory Study. J. Phys. Chem. C 122, 20817-20826 (2018).
- [17] M. Campana et al. Surfactant adsorption at the metal-oil interface. Langmuir 27, 6085-6090 (2011).
- [18] M. Campen et al. In Situ Study of Model Organic Friction Modifiers Using Liquid Cell AFM; Saturated and Mono-unsaturated Carboxylic Acids. Tribol. Lett. 57, 18 (2015).
- [19] J. P. Ewen et al. A Comparison of Classical Force-Fields for Molecular Dynamics Simulations of Lubricants. Materials 9, 651 (2016).
- [20] T. Miura, M.Mikami, Molecular dynamics study of the effects of chain properties on the order formation dynamics of self-assembled monolayers of long-chain molecules, Phys. Rev, E 81, 021801, (2010).
- [21] S. L. Mayo, B. D. Olafson, DREIDING:A Generic Force Field for Molecular Simulations. J.Phys. Chem. 94, 8897-8909, (1990).
- [22] Computational Chemistry, David Young, Wiley-Interscience, 2001. Appendix A.A.3.2 pg 342, MOPAC.
- [23] T. C. Askwith, A. Cameron, and R. F. Crouch, Proc. Roy. Soc. London, A 291, 500, (1966).
- [24] S. Plimpton, Fast Parallel Algorithms for Short-Range Molecular Dynamics, J. Comput. Phys., 117, 1 (1995).
- [25] S.Nosé, A unified formulation of the constant-temperature molecular dynamics methods, J.Chem.Phys. 81, 511, (1984) .
- [26] W. G. Hoover, Canonical dynamics: Equilibrium phase-space distributions, Phys. Rev. A,31, 1695, (1986).
- [27] S.Nosé, A Molcular Dynamics Method for Simulations in the Canonical Ensemble, Molec.Phys., 52, 255, (1984).
- [28] H.C. Anderson, Molecular Dynamics Simulations at Constant Pressure and/or Temperature, J. Chem. Phys., 72, 2384, (1980).
- [29] D. J. Hardy, J. E. Stone, K. Schulten, Parallel Comput. 35, 164 (2009).
- [30] L. Verlet, Computer ”Experiments” on Classical Fluids. I. Thermodynamical Properties of Lennard-Jones Molecules, Phy.Rev. 159, 98, (1967).
- [31] K. Nishikawa, H. Akiyama, K. Yagishita, H. Washizu, ”Molecular dynamics analysis of adsorption process of anti-copper-corrosion additives to the copper surface”, arXiv:1812.10647 (in printing).
- [32] H. Washizu, T. Ohmori. Molecular Dynamics Simulations of Elastohydrodynamic Lubrication Oil Film, Lubrication Sciences, 22, 323, (2010).
- [33] H. Washizu, S. Hyodo, S. Ohmori, N. Nishino, A. Suzuki, Macroscopic no-slip boundary condition confirmed in full atomistic simulation of oil film, Tribology Online 9, (2) 45-50 (2014).
- [34] H. Washizu, T. Ohmori, A. Suzuki, ”Molecular Origin of Limiting Shear Stress of Elastohydrodynamic Lubrication Oil Film Studied by Molecular Dynamics”, Chem. Phys. Lett.,678, 1-4 (2017).
- [35] H. Tamura et al., Molecular Dynamics Simulation of Friction of Hydrocarbon Thin Films, Langmuir, 15 (22), 7816–7821 (1999).
- [Israelachvili(2010)] Israelachvili, in Intermolecular and Surface Forces, Third Edition, Academic Press;, Burlington, 2010
- [36] F.F. Abraham, J. Chem. Phys. 68, 3713 (1978).
- [37] I. Bitsanis et al., J. Chem. Phys. 87, 1733 (1987).
- [38] M. Dijkstra, J. Chem. Phys. Confined thin films of linear and branched alkanes. 107, 3277-3288 (1997).
- [39] J. W. Eaton, D. Bateman, S. Hauberg, R.Wehbring, GNU Octave version 3.8.1 manual: a high-level interactive language for numerical computations, CreateSpace Independent Publishing Platform (2014).
- [40] E. B. Webb III, Gary S. Grest, and Maurio Mondello. Intracrystalline Diffusion of Linear and Branched Alkanes in the Zeolites TON, EUO, and MFI, J. Phys. Chem. B,103 ,4949-4959, (1999).
- [41] K. S. Kostov et al., Dynamics of linear and branched alkane melts: Molecular dynamics test of theory for long time dynamics, J.Chem. Phys. 108, 21, (1998).
- [42] D. Alonso De Mezquia et al., Determination of Molecular Diffusion Coefficient in n-Alkane Binary Mixtures: Empirical Correlations, J. Phys. Chem. B, 116, 2814-2819, (2012).