Nuclei Detection Using Mixture Density Networks
Abstract
Nuclei detection is an important task in the histology domain as it is a main step toward further analysis such as cell counting, cell segmentation, study of cell connections, etc. This is a challenging task due to complex texture of histology image, variation in shape, and touching cells. To tackle these hurdles, many approaches have been proposed in the literature where deep learning methods stand on top in terms of performance. Hence, in this paper, we propose a novel framework for nuclei detection based on Mixture Density Networks (MDNs). These networks are suitable to map a single input to several possible outputs and we utilize this property to detect multiple seeds in a single image patch. A new modified form of a cost function is proposed for training and handling patches with missing nuclei. The probability maps of the nuclei in the individual patches are next combined to generate the final image-wide result. The experimental results show the state-of-the-art performance on complex colorectal adenocarcinoma dataset.
Keywords:
Mixture Density Network, Histology, Nuclei Detection1 Introduction
Precise localizing the nucleus in histology images is a main step for successive medical image analysis such as cell segmentation, counting and morphological analysis [1]. Unfortunately, robust cell detection is a challenging task due to nucleus clutters, large variation in shape and texture, nuclear pleomorphism, touching cells and poor image quality [2]. Since manual detection of nucleus for further diagnostic assessment imposes a high workload on pathologists, computer assisted methods have attracted a lot of interest in recent years [3]. To this end, many automatic cell detection algorithms are proposed in literature. Parvin et al. [4] introduced the iterative voting methods which use oriented kernels to localize cell centers, where the voting direction and areas were updated in each iteration. Qi et al [5] utilize a single path voting mechanism that is followed by clustering step. Similarly, Hafiane et al [6] detect the nuclei by clustering the segmented centers using an iterative voting algorithm. multiscale Laplacian-of-Gaussian (LOG) [7] and construction of concave vertex graph [8] can also be found in the literature. A popular approach to handle touching cells is based on the watershed algorithm [1, 9]. However, due to the large variations in microscopy modality, nucleus morphology, and the inhomogeneous background, it remains to be a challenging topic for these non-learning methods. Data-driven methods utilizing hand-crafted features have also been extensively applied for cell detection due to their promising performance. Interested readers are referred to [10] for more details about methods which rely on hand crafted features and classic supervised methods.
Deep learning has shown an outstanding performance in computer vision analysis of both natural and biomedical images. Deep learning methods extract the appropriate features from an image without the need for laborious feature engineering and parameter tunning. Ciresan et al. [11] applied a deep neural network (DNN) as a pixel classifier to differentiate between mitotic and non-mitotic nuclei in breast cancer histopathology images. Xie et al. [12] proposed a structured regression convolution neural network (CNN) for nuclei detection wherein the gaussian distribution is fitted on the nucleus center to construct the probability map which is considered as an image mask, then a weighted mean squared loss is minimized via pixel-wise back-propagation. Xu et al. [13] proposed a stacked sparse autoencoder strategy to learn high level features from patches of breast histopathology images and then classify these patches as nuclear or non-nuclear. Sirinukunwattana et al. [14] proposed a locality sensitive deep learning approach for nuclei detection in the H&E stained colorectal adenocarcinoma histology images. In this approach, a spatially constrained CNN is first employed to generate a probability map for a given input image using local information.Then the centroids of nucleus are detected by identifying local maximum intensities.
In this paper, we propose a simple yet effective method based on Mixture Density Networks (MDN) introduced by Bishop [15] for solving inverse problems, where we have multiple targets for an individual input. MDN learns the distribution of nucleus within an image hypothesizing that each nuclei has a Gaussian distribution with a maximum value on its center. Here we formalize the concept of MDN for cell detection problem. Due to MDN’s flexibility to localize nucleus, we show that it has a better performance when compared with the other cell detection algorithms on a challenging colon cancer dataset.
Our contributions in this paper are the followings: i) We define the problem of nuclei detection as mapping a single input image patch into the probability density function (pdf) of the nuclei center, from which the observed locations have been sampled. The pdf is modeled as a Gaussian Mixture Model (GMM) and its parameters are learned via a back-propagation. In addition, a Bernoulli distribution is trained whose parameter predicts if the local patch contains any nucleus and thus the fit of the GMM is liable. ii) We show the network can detect the nuclei even when trained with a sparse annotated samples, whereas using other methods result in a poor performance. iii) we demonstrate the capability of algorithm to learn the distribution of nuclei center from the training data without the need to define fixed variance size for all nucleus as some methods do [14, 12].
2 Mixture Density Networks
For a general task of supervised learning our goal is to model a conditional distribution (for image patch x and nucleus center t), which is considered Gaussian for many problems and a least square energy function is often obtained using maximum likelihood. These assumptions can lead to a poor performance in many application having plausible non-Gaussian distributions. One of such applications is one to many mapping where one input corresponds to several outputs. The assumption of having a Gaussian posterior distribution forces the model to predict only one output discarding other target values at best. Moreover, The network prediction is the average of all target values which is incorrect [15]. To address this problem, we can consider a general framework for modeling the conditional posterior probability distribution by modeling it as a mixture density represented as a linear combination of kernel functions:
| (1) |
where is the number of components in the mixture and s are mixing coefficients. We assume that kernel functions are isotropic Gaussian:
| (2) |
where and are the mean and the variance of the th Gaussian, respectively, and is the dimension of target variable.
Here, the parameters of the mixture model are considered to be functions of input image patch . This can be achieved by using a conventional neural network as a function that takes as input. These layers are then combined with other fully connected layers to from the Mixture Density Network (MDN), (see Fig.1). Building the MDN increases the number of parameters from c output to . There are some restrictions on these parameters that can be found in detail in [15].
To define the error function, the standard negative logarithm of the maximum likelihood is used. Therefore the original loss function for the network is [15]:
| (3) |
where summation over applies to all dataset. In the next section, we modify this cost function so that it becomes more suitable to handle image patches with multiple and/or missing nuclei.
2.1 Extending MDN for Nuclei Detection
For nuclei detection, deep learning approaches are either provided with small patches each containing one nuclei[14, 13] or designed as pixel wise structured logistic regression [12, 16]. Here, we formulate the cell detection as the problem of mapping one to many outputs, as each input vector (image) can have multiple variables defined as the locations (coordinates) of the nuclei.
To adjust the MDN for nuclei detection, we modify the equation (3) to take one input (image patch) and all of its corresponding target coordinates of the nuclei during training. This equation can only be used when all input patches contain nuclei (when we have at least one target variable for each image), whereas there are many patches with no nucleus. To address this problem, we add a Bernoulli variable to our loss function to ignore mixture parameters:
| (4) |
where is the number of the training images, is the number of nucleus within each image and is the coordinate of th point within the image patch . is a Bernoulli variable that specifies the probability of the patch containing any nucleus and the variance covering the dilation.
Pointset for each nuclei:
During the training of the network, we use a dilated point set located within 6 pixels from the nucleus center. This augments the training data and increases the training efficiency. We sample 10 points from a Gaussian distribution with the mean on nucleus centroid.
Network Architecture:
In this paper, a CNN model was selected because of its capability to deal directly with raw images, without the need of preprocessing and an explicit features extraction process. The network is trained to capture the important aspects of the input data. By optimizing the dense representation of the input data in the feature maps, the performance of the fully connected part (MDN) is improved.
For having a rich feature and better convergence, Resnet [17] with 18 layers is utilized. In this architecture ’relu’ activation function are replaced with ’elu’. We did not use very deep Resnet architecture as its training requires huge amount of data. Two fully connected layers are added after average-pooling to construct the whole architecture of MDN (See Fig 1).

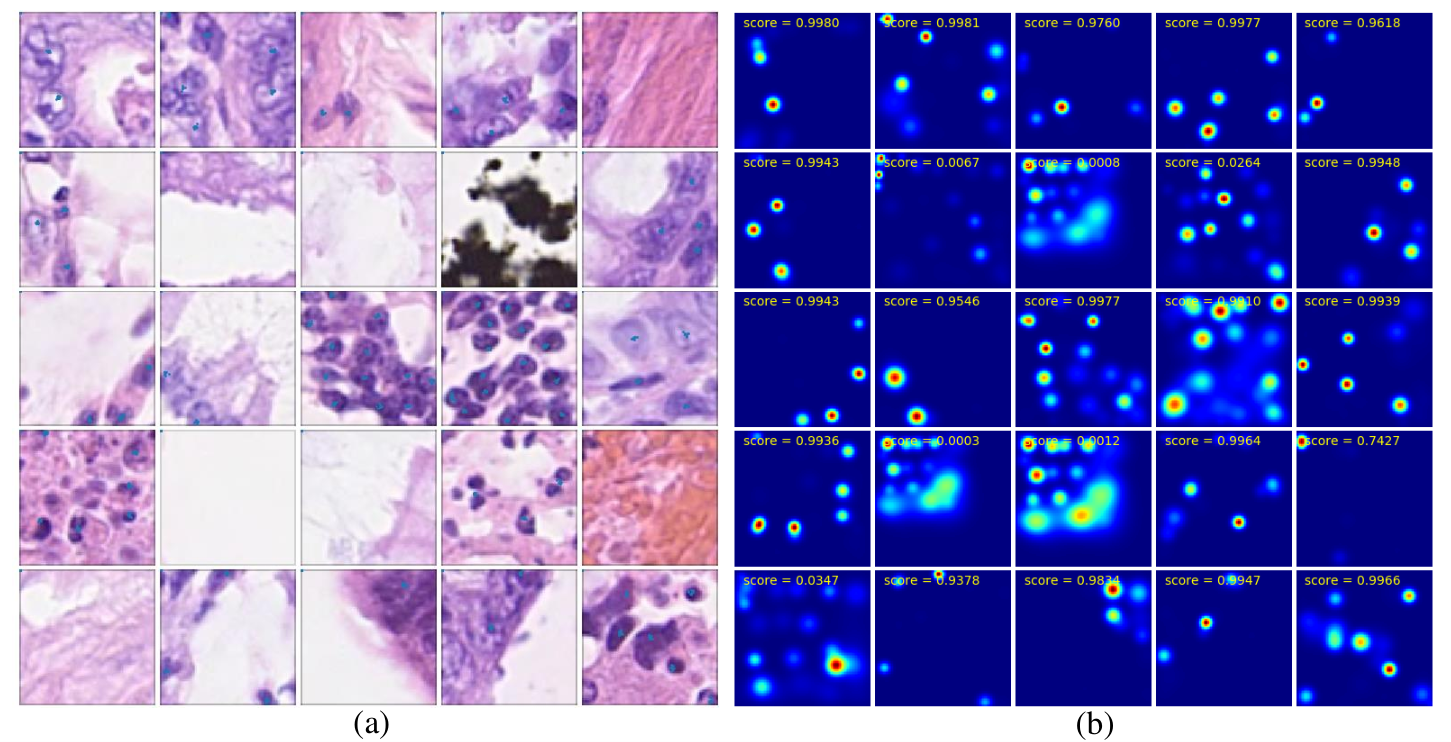
To provide an appropriate input size to the network, the original images were cropped to patches of size 5050. The network architecture consists of 2 fully connected layers (256 and , respectively). We set the number of mixtures to 100, therefore the MDN should predict 401 values (for each mixture 400 values and 1 value for the Bernoulli distribution). After acquiring network predictions, the patches with no nucleus having the low value of are ignored (threshold for is set to 0.5). We choose the most significant Gaussians by applying a threshold of 0.001 on the mixture coefficients (). Afterward, the probability maps are generated using ,s, ,s and ,s. Finally to extract the centroids of the nuclei within the remaining patches, local maxima are sought.
3 Experimental Results
Dataset:
For our experiments, we use the Colorectal cancer (CRC) dataset provided by [14]. It involves 100 H&E images of colorectal adenocarcinomas of size 500500 which are cropped from CRC whole slide images. The total number of 29756 nuclei were annotated for detection purpose. All the images are obtained at 20X magnification. This dataset is randomly divided into two halves for training and testing. The cell detection on this dataset is challenging due to touching cells, blurred (or weak) cell boundaries and inhomogeneous background noise.
Results and Discussion:
Fig. 2 shows the probability maps and the centroid locations along with the ground truth circles overlaid on the original images. As shown, the network could learn the locations of complex nuclei such as epithelial as well as congested area where lymphocyte nuclei lie. The broader view of the two challenging images and their corresponding probability maps are depicted in Figure 3. For visual assessment, the annotated centroids (yellow circles) and predicted locations (red dots) are also shown in Fig 3.
For the quantitative evaluation we use the same two-fold cross validation explained in [14]. Precision, Recall and F1 score are used for validating the detection performance. Each detected nucleus within the radius of 6 pixels from the annotated center is considered as true positive. The final results are shown in table 1. The algorithm has low false negatives which leads to higher recall compared to other methods. In other word, high recall highlights its performance in detecting relatively more cells compared to its counterparts. Overall the F1 score is high, which shows a good detection performance in the proposed MDN based framework.
Due to its probabilistic output, one advantage of the proposed method is its ability to handle images with weak and sparse annotations. We demonstrate this through the following procedure. Firstly we equally divide the dataset into training and validation sets and then remove 30% of the available annotations from the training set and compare the results with SR-CNN. The quantitative results in Table 2, obtained using this sparsely annotated data, show that the proposed method can achieve a better performance.

| Method | Precision | Recall | F1 score |
|---|---|---|---|
| Proposed | 0.788 | 0.882 | 0.832 |
| SC-CNN [14] | 0.781 | 0.823 | 0.802 |
| SR-CNN [12] | 0.790 | 0.834 | 0.811 |
| SSAE [13] | 0.617 | 0.644 | 0.630 |
| Method | Precision | Recall | F1 score |
|---|---|---|---|
| Proposed | 0.67 | 0.75 | 0.71 |
| SR-CNN [12] | 0.59 | 0.63 | 0.60 |
4 Conclusion
In this study, we used a probabilistic approach for detecting nucleus. MDN has been used in literature for one to many regression tasks. Here, we proposed a framework for employing MDN for nuclei detection. Firstly the features learned using a CNN taking images as input. Then, the MDN learns the distribution of nucleus within the image patch using a mixture of Gaussian. Our method is capable of utilizing weak annotated data while preserving a good performance. Finally, we showed that the proposed method can detect nucleus in colorectal histology images with a higher F1 score when compared to other approaches.
References
- [1] Grau, V., Mewes, A., Alcaniz, M., Kikinis, R., Warfield, S.K.: Improved watershed transform for medical image segmentation using prior information. IEEE transactions on medical imaging 23(4) (2004) 447–458
- [2] Quelhas, P., Marcuzzo, M., Mendonça, A.M., Campilho, A.: Cell nuclei and cytoplasm joint segmentation using the sliding band filter. IEEE Transactions on Medical Imaging 29(8) (2010) 1463–1473
- [3] Schmitt, O., Hasse, M.: Radial symmetries based decomposition of cell clusters in binary and gray level images. Pattern Recognition 41(6) (2008) 1905–1923
- [4] Parvin, B., Yang, Q., Han, J., Chang, H., Rydberg, B., Barcellos-Hoff, M.H.: Iterative voting for inference of structural saliency and characterization of subcellular events. IEEE Transactions on Image Processing 16(3) (2007) 615–623
- [5] Qi, X., Xing, F., Foran, D.J., Yang, L.: Robust segmentation of overlapping cells in histopathology specimens using parallel seed detection and repulsive level set. IEEE Transactions on Biomedical Engineering 59(3) (2012) 754–765
- [6] Hafiane, A., Bunyak, F., Palaniappan, K.: Fuzzy clustering and active contours for histopathology image segmentation and nuclei detection. In: International Conference on Advanced Concepts for Intelligent Vision Systems, Springer (2008) 903–914
- [7] Akakin, H.C., Kong, H., Elkins, C., Hemminger, J., Miller, B., Ming, J., Plocharczyk, E., Roth, R., Weinberg, M., Ziegler, R., et al.: Automated detection of cells from immunohistochemically-stained tissues: application to ki-67 nuclei staining. In: Medical Imaging 2012: Computer-Aided Diagnosis. Volume 8315., International Society for Optics and Photonics (2012) 831503
- [8] Yang, L., Tuzel, O., Meer, P., Foran, D.J.: Automatic image analysis of histopathology specimens using concave vertex graph. In: International Conference on Medical Image Computing and Computer-Assisted Intervention, Springer (2008) 833–841
- [9] Jung, C., Kim, C.: Segmenting clustered nuclei using h-minima transform-based marker extraction and contour parameterization. IEEE transactions on biomedical engineering 57(10) (2010) 2600–2604
- [10] Thomas, R.M., John, J.: A review on cell detection and segmentation in microscopic images. In: Circuit, Power and Computing Technologies (ICCPCT), 2017 International Conference on, IEEE (2017) 1–5
- [11] Cireşan, D.C., Giusti, A., Gambardella, L.M., Schmidhuber, J.: Mitosis detection in breast cancer histology images with deep neural networks. In: International Conference on Medical Image Computing and Computer-assisted Intervention, Springer (2013) 411–418
- [12] Xie, Y., Xing, F., Shi, X., Kong, X., Su, H., Yang, L.: Efficient and robust cell detection: A structured regression approach. Medical image analysis 44 (2018) 245–254
- [13] Xu, J., Xiang, L., Liu, Q., Gilmore, H., Wu, J., Tang, J., Madabhushi, A.: Stacked sparse autoencoder (ssae) for nuclei detection on breast cancer histopathology images. IEEE transactions on medical imaging 35(1) (2016) 119–130
- [14] Sirinukunwattana, K., Raza, S.E.A., Tsang, Y.W., Snead, D.R., Cree, I.A., Rajpoot, N.M.: Locality sensitive deep learning for detection and classification of nuclei in routine colon cancer histology images. IEEE transactions on medical imaging 35(5) (2016) 1196–1206
- [15] Bishop, C.M.: Mixture density networks. Technical report, Citeseer (1994)
- [16] Xie, W., Noble, J.A., Zisserman, A.: Microscopy cell counting and detection with fully convolutional regression networks. Computer methods in biomechanics and biomedical engineering: Imaging & Visualization 6(3) (2018) 283–292
- [17] He, K., Zhang, X., Ren, S., Sun, J.: Deep residual learning for image recognition. In: Proceedings of the IEEE conference on computer vision and pattern recognition. (2016) 770–778