BABAR-PUB-18/006
SLAC-PUB-17318
Measurement of the transition form factor
Abstract
We study the process in the double-tag mode and measure for the first time the transition form factor in the momentum-transfer range 2 60 GeV2. The analysis is based on a data sample corresponding to an integrated luminosity of around 469 fb-1 collected at the PEP-II collider with the BABAR detector at center-of-mass energies near 10.6 GeV.
pacs
13.25.Jx, 13.60.Le, 16.66.BcI Introduction

In this article, we report on the measurement of the transition form factor (TFF) by using the two-photon-fusion reaction
illustrated by the diagram in Fig. 1. The TFF is defined via the amplitude for the transition
| (1) |
where is the fine structure constant, is the totally antisymmetric Levi-Civita tensor, and are the polarization vectors and four-momenta, respectively, of the space-like photons, , and is the transition form factor.
We measure the differential cross section of the process in the double-tag mode, in which both scattered electrons11 1 Unless otherwise specified, we use the term “electron” for either an electron or a positron. are detected (tagged). The tagged electrons emit highly off-shell photons with momentum transfers and , where and are the four-momenta, respectively, of the initial- and final-state electrons. We measure for the first time in the kinematic region with two highly off-shell photons GeV2. The transition form factor in the space-like momentum transfer region and in the single-tag mode was measured in several previous experiments [1, 2, 3, 4, 5]. The most precise data at large were obtained by the CLEO [4] experiment, and then by the BABAR [5] experiment, in the momentum transfer ranges GeV2 and GeV2, respectively.
Many theoretical models exist for the description of the TFFs of pseudoscalar mesons, and (see for example Refs. [9, 6, 8, 7]). Measurement of the TFF at large and allows the predictions of models inspired by perturbative QCD (pQCD) to be distinguished from those of the vector dominance model (VDM) [10, 12, 11]. The tree-level diagrams for VDM and pQCD approaches are shown in Fig. 2. In the case of only one off-shell photon, both classes of models predict the same asymptotic dependence as , while for two off-shell photons the asymptotic predictions are quite different, for pQCD, and for the VDM model.
II Theoretical approach to the form factor .
As a consequence of mixing, the wave function can be represented as the superposition of two quark-flavor states [13]:
| (2) |
where
| (3) |
For the mixing angle we use the value [14]. The transition form factor is related to the form factors for the and states through
| (4) |
For large values of momentum transfer, pQCD predicts that the form factors and can be represented as a convolution of a hard scattering amplitude and a non-perturbative meson distribution amplitude (DA) :
| (5) |
where is the longitudinal momentum fraction of the quark struck by the virtual photon in the hard scattering process. For the renormalization scale , we take as proposed in Ref. [15] and for its asymptotic form [16]
| (6) |
where the charge factors are and , the weak decay constants for the and states are and [14], is the pion decay constant, and is the QCD scale parameter.


In the case of two highly off-shell photons, can be represented as
| (7) | |||
| (8) | |||
| (9) |
where () stands for the first term with replacement of by , is the QCD coupling strength, and is a color factor. The expression for the next-to-leading order (NLO) component can be found in Ref. [15], while the leading-order expression corresponds to . Combining Eqs. (4 – 7) we obtain the pQCD prediction for at large and :
| (10) |
Significant effort has been invested to determine the DAs of pseudoscalar mesons at intermediate values of momentum transfer [15, 16, 18, 19, 17]. In contrast to the case of one off-shell photon, the TFF for two off-shell photons is almost insensitive to the shape of the DA, because the amplitude Eq. (7) is finite at the endpoints and .
According to the VDM model the TFF for the case of two off-shell photons is
| (11) |
where is the pole mass parameter (see for example Ref. [11]). In the case of the meson, is found to be from the approximation of with one off-shell photon [14]. The value of can be obtained from the measured value of the two-photon width keV [20] using the formula [16]:
| (12) |
III The BABAR detector and data set
The data used in this analysis were collected with the BABAR detector at the PEP-II asymmetric-energy collider, at the SLAC National Accelerator Laboratory. A total integrated luminosity of 468.6 [21] is used, including 424.7 collected at the peak of resonance and 43.9 collected 40 MeV below the resonance.
The BABAR detector is described in detail elsewhere [22, 23]. Charged particles are reconstructed using a tracking system, which includes a silicon vertex tracker (SVT) and a drift chamber (DCH) inside a 1.5 T axial magnetic field. Separation of pions and kaons is accomplished by means of the detector of internally reflected Cherenkov light and energy loss measurements in the SVT and DCH. Photons are detected in the electromagnetic calorimeter (EMC). Muon identification is provided by the instrumented flux return.
Signal events are simulated with the Monte Carlo (MC) event generator GGResRc [24]. Because the distributions are peaked near zero, MC events are generated with the requirement GeV2. This restriction corresponds to the limit of detector acceptance for the tagged electrons. The transition form factor in simulation is assumed to be constant. The GGResRc event generator includes next-to-leading-order radiative corrections to the Born cross section calculated according to Ref. [25]. In particular, it generates extra soft photons emitted by the initial- and final-state electrons. The maximum center-of-mass (c.m.) energy of the photon emitted from the initial state is required to be less than 0.05, where is the c.m. energy.
IV Event selection


The decay chain is used to reconstruct the meson candidate.
An initial sample of events with at least four tracks and two photon candidates is selected. Tracks must have a point of closest approach to the nominal interaction point that is within 2.5 cm along the beam axis and less than 1.5 cm in the transverse plane. The track transverse momenta must be greater than 50 MeV/. Electrons and pions are separated using a particle identification (PID) algorithm based on information from the Cherenkov detector, EMC, and the tracking system. An event is required to contain two electron and two pion candidates. The electron PID efficiency is better than 98%, with the pion misidentification probability below 10%. The pion PID efficiency is 98%, with an electron misidentification probability of about 7%.
To recover electron energy loss due to bremsstrahlung, the energy of all the calorimeter showers close to the electron direction (within 35 and 50 mrad for the polar and azimuthal angle, respectively) is combined with the measured energy of the electron track. The resulting c.m. energy of the electron candidate must be greater than 0.2 GeV.
The photon candidates are required to have an energy in the laboratory frame greater than 30 MeV. Two photon candidates are combined to form an candidate. Their invariant mass is required to be in the 0.45–0.65 GeV range. We apply a kinematic fit to the two photons, with an mass constraint to improve the precision of their momentum measurement. An candidate is formed from a pair of oppositely charged pion candidates and an candidate. The candidate invariant mass must be in the range of 0.90–1.02 GeV.
The final selection uses tagged electrons and is based on variables in the c.m. frame of the initial and . The total momentum of the reconstructed system (22 2 The superscript asterisk indicates a quantity calculated in the c.m. frame) must be less than 0.35 GeV/. The distribution of the total momentum is shown in Fig. 4 for data and simulated signal events. The total energy of the system must be in the range of 10.30–10.65 GeV as indicated by the arrows in Fig. 4. To reject background from QED events, requirements on the energies of the detected electron and positron are applied. The two-dimensional distributions of the electron c.m. energy versus the positron c.m. energy are shown in Fig. 5 for data and simulated signal events. The lines indicate the boundary of the selection area. Events that lie above and to the right of the lines are rejected.


The distribution of the candidate mass versus the one for the selected data and simulated signal samples is shown in Fig. 6. A clustering of events in the central region of the data distribution corresponds to the two-photon production. To further suppress background we require that the invariant mass of the candidate be in the range 0.50–0.58 GeV/, as shown by the horizontal lines in Fig. 6. For events with more than one or candidate (about 10% of the selected events), the candidate with smallest absolute value of the total momentum of the system in the c.m. frame is selected.
Data events that pass all selection criteria are divided into five (, ) regions, as illustrated on Fig. 7 for events with GeV/c2. Because of the symmetry of the process under the exchange of the with the , regions 3 and 4 each include two disjunct regions, mirror symmetric with respect to the diagonal. The number of signal events () in each (, ) region is obtained from a fit to the invariant mass spectrum with a sum of signal and background distributions as shown in Fig. 8. The signal line shape is obtained from the signal simulation, while the background is assumed to be linear. The fitted numbers of events for the five (, ) regions are listed in Table 1. The total number of signal events is . For the regions 2 and 5 we also use conservative estimates of the number of signal events as upper limits at 90% C.L. using the Feldman-Cousins approach [26].
To estimate the uncertainty related to the description of the background, we repeat the fits using a quadratic background shape. The deviation in the fitted number of signal events is 1.7%. The uncertainty associated with the signal shape (3.3%) is estimated by including into the signal probability function a mass shift MeV/c2 and additional Gaussian smearing width MeV/. These parameters are obtained from our previous study of events [5], based on single-tagged events, where the statistical precision was significantly larger. The total systematic uncertainty (3.7%) is obtained by adding the individual terms in quadrature.
Following the methods developed in the single-tag analysis of Ref. [5], we have studied possible sources of peaking background: annihilation into hadrons, the two-photon process , and the vector meson bremsstrahlung processes and . As in Ref. [5], the impact of these processes on the results is found to be negligible.
V Detection efficiency
| , (GeV2) | () region (GeV2) | , ) | ||||
|---|---|---|---|---|---|---|
| (fb/GeV4) | (GeV-1) | |||||
| 6.48, 6.48 | 0.019 | 1.03 | 14.7 | 1471.8 | 14.32 0.83 0.14 | |
| 16.85, 16.85 | 0.282 | 1.10 | 4.2 | 4.2 | 5.35 0.31 0.42 | |
| 14.83, 4.27 | 0.145 | 1.07 | 15.8 | 39.7 | 8.24 0.48 0.65 | |
| 38.11, 14.95 | 0.226 | 1.11 | 10.0 | 3.0 | 6.07 0.35 1.21 | |
| 45.63, 45.63 | 0.293 | 1.22 | 1.6 | 0.6 | 8.71 0.50 1.04 | |
| 5.0 | 1.9 | 32.03 |
| Source | Uncertainty (%) |
|---|---|
| identification | 1.0 |
| identification | 1.0 |
| Other selection criteria | 11.0 |
| Track reconstruction | 0.9 |
| reconstruction | 2.0 |
| Trigger, filters | 1.3 |
| Background subtraction | 3.7 |
| Radiative correction | 1.0 |
| Luminosity | 1.0 |
| Total | 12% |
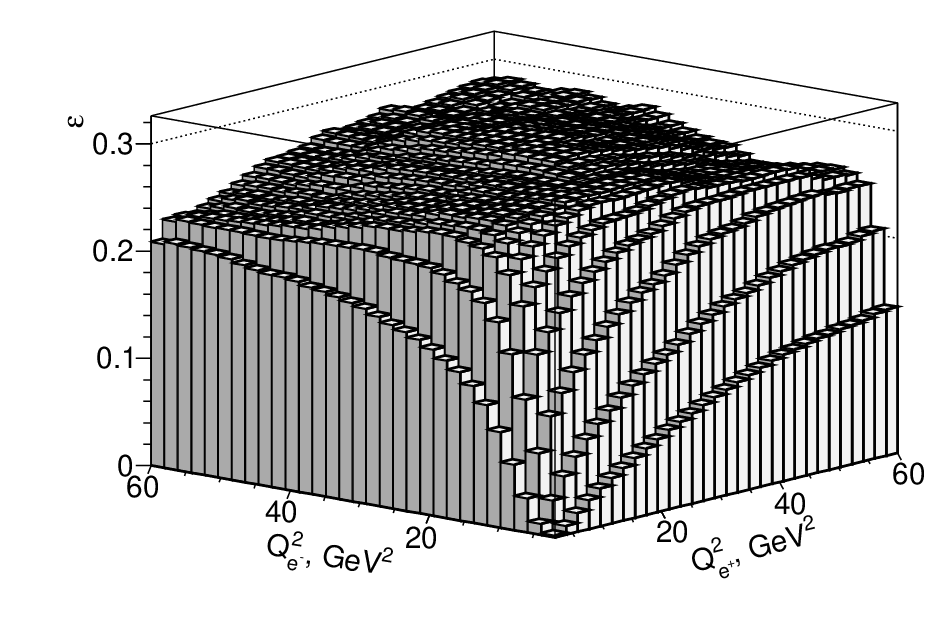
The detection efficiency () is determined from MC simulation in the (, ) plane as the ratio of the selected over generated events and is shown in Fig. 9. The detector acceptance limits the efficiency at small momenta and the minimum measurable is 2 GeV2. The difference between the energies of the and beams at PEP-II leads to an asymmetry in the dependence of the efficiency on and .
Because of the symmetry of the form factor , we use the notation
| (13) |
Since signal MC events are generated with a constant TFF, the average detection efficiency for the specific () region is calculated as the ratio of the following integrals:
| (14) |
where the form factor is described by Eq. (10). The obtained values of the detection efficiency for the five () regions are listed in Table 1.
The systematic uncertainties related to the detection efficiency are listed in Table 2. The uncertainties related to track reconstruction, reconstruction, trigger and filters, and the pion PID were studied in our previous single-tag analysis [5]. To estimate the efficiency uncertainty related to other selection criteria, we apply a less strict condition on a criterion, perform the procedure of background subtraction described in the previous section, and calculate the ratio of the number of selected events in data and simulation. We consider the less strict requirements GeV/, GeV, GeV/, and remove the requirements on and entirely. The quadratic sum of the deviations from the nominal value of the ratio (11%) is used as the total systematic uncertainty of the detection efficiency.
VI Cross section and form factor
The differential Born cross section for the process is calculated as
| (15) |
where is the number of signal events in the () region divided by the area of this region, is the integrated luminosity, and is a radiative correction factor accounting for distortion of the spectrum due to the emission of photons from the initial state and for vacuum polarization effects. The factor is the product of the branching fractions [20]. The radiative correction factor is determined using simulation at the generator level, i.e., without detector simulation. The spectrum is generated using only the pure Born amplitude for the process, and then using a model with radiative corrections included. The factor is evaluated as the ratio of the second spectrum to the first. The values of the cross section for the five () regions are listed in Table 1. The cross section in the entire range of momentum transfer GeV2 is
| (16) |
where the uncertainty is statistical. The systematic uncertainty includes the uncertainty in the number of signal events associated with background subtraction (Sec. IV), the uncertainty in the detection efficiency (Sec. V), the uncertainty in the calculation of the radiative correction (1%) [25], and the uncertainty in the integrated luminosity (1%) [21]. All sources of systematic uncertainty in the cross section are summarized in Table 2. The total systematic uncertainty (12%) is the sum in quadrature of all the systematic contributions. The model uncertainty will be discussed below.
To extract the TFF we compare the value of the measured cross section from Eq. (15) with the calculated one. The latter is evaluated using obtained from Eq. (10). Therefore, the measured form factor is determined as
| (17) |
where and correspond to Eq. (10).
The average momentum transfer squared for each () region is calculated using the data spectrum normalized to the detection efficiency:
| (18) |
For regions 1, 2, and 5, the and are additionally averaged.

The model uncertainty arises from the model dependence of and . Repeating the calculation of Eqs. (14), (15), and (17) with a constant TFF, we estimate the model uncertainty. In the case of the cross section it is about 60% because of the strong dependence of on the input model for TFF at small values of and . However, the transition form factor is much less sensitive to the model.
The obtained values of the transition form factor are listed in Table 1 and are represented in Fig. 10 by the triangles. The error bars attached to the triangles indicate the statistical uncertainties. The quadratic sum of the systematic and model uncertainties is shown by the shaded rectangles. The open and filled squares in Fig. 10 correspond to the LO and NLO pQCD predictions [Eq. (10)], respectively. The NLO correction is relatively small. The measured TFF is, in general, consistent with the QCD prediction. The circles in Fig. 10 represent the predictions of the VDM model [Eq. (11)], which exhibits a clear disagreement with the data.
VII Summary
We have studied for the first time the process in the double-tag mode and have measured the transition form factor in the momentum-transfer range GeV2. The measured values of the form factor are in agreement with the pQCD prediction and contradict the prediction of the VDM model.
VIII ACKNOWLEDGMENTS
We are grateful for the extraordinary contributions of our PEP-II colleagues in achieving the excellent luminosity and machine conditions that have made this work possible. The success of this project also relies critically on the expertise and dedication of the computing organizations that support BABAR. The collaborating institutions wish to thank SLAC for its support and the kind hospitality extended to them. This work is supported by the US Department of Energy and National Science Foundation, the Natural Sciences and Engineering Research Council (Canada), the Commissariat à l’Energie Atomique and Institut National de Physique Nucléaire et de Physique des Particules (France), the Bundesministerium für Bildung und Forschung and Deutsche Forschungsgemeinschaft (Germany), the Istituto Nazionale di Fisica Nucleare (Italy), the Foundation for Fundamental Research on Matter (The Netherlands), the Research Council of Norway, the Ministry of Education and Science of the Russian Federation, Ministerio de Economía y Competitividad (Spain), the Science and Technology Facilities Council (United Kingdom), and the Binational Science Foundation (U.S.-Israel). ndividuals have received support from the Russian Foundation for Basic Research (grant No. 18-32-01020), the Marie-Curie IEF program (Euro- pean Union) and the A. P. Sloan Foundation (USA).
References
- [1] C. Berger et al. (PLUTO Collaboration), Phys. Lett. B 142, 125 (1984).
- [2] H. Aihara et al. (TPC/Two Gamma Collaboration), Phys. Rev. D 38, 1 (1988); Phys. Rev. Lett. 64, 172 (1990).
- [3] H.-J. Behrend et al. (CELLO Collaboration), Z. Phys. C 49 (1991) 401.
- [4] J. Gronberg et al. (CLEO Collaboration), Phys. Rev. D 57, 33 (1998).
- [5] P. del Amo Sanchez et al. (BABAR Collaboration), Phys. Rev. D 84, 052001 (2011).
- [6] G. Kopp, T. F. Walsh, and P. M. Zerwas, Nucl. Phys. B 70, 461 (1974).
- [7] S. Berman and D. Geffen, Nuovo Cim. 18, 1192 (1960).
- [8] P. Kroll, Nucl. Phys. B (Proc. Suppl.) 219-220, 2 (2011).
- [9] S. Agaev et al., Phys. Rev. D 90, 074019 (2014).
- [10] B.-l. Young, Phys. Rev. 161, 1620 (1967).
- [11] L. G. Landsberg, Phys. Rep. 128, 301 (1985).
- [12] A. Dorokhov, M. Ivanov, and S. Kovalenko, Phys.Lett. B 677, 145 (2009).
- [13] T. Feldmann, P. Kroll and B. Stech, Phys. Rev. D 58, 114006 (1998).
- [14] Fu-Guang Cao, Phys. Rev. D 85, 057501 (2012).
- [15] E. Braaten, Phys. Rev. D 28, 524 (1983).
- [16] S. J. Brodsky and G. P. Lepage, Phys. Rev. D 24, 7 (1981); G. P. Lepage and S. J. Brodsky, Phys. Rev. D 22, 2157 (1980).
- [17] V. L. Chernyak and A. R. Zhitnitsky, Nucl. Phys. B 201, 492 (1982); Phys. Rep. 112 173 (1984); Nucl. Phys. B 246, 52 (1984).
- [18] T. Feldmann and P. Kroll, Phys. Rev. D 58, 057501 (1998).
- [19] A. J. Brodsky, F. Cao and G. Teramond, Phys. Rev. D 84, 033001 (2011).
- [20] C. Patrignani et al. (Particle Data Group), Chin. Phys. C 40, 100001 (2016).
- [21] J. P. Lees et al. (BABAR Collaboration), Nucl. Instrum. Methods Phys. Res., Sect. A 726, 203 (2013).
- [22] B. Aubert et al. (BABAR Collaboration), Nucl. Instrum. and Meth. A 479, 1 (2002).
- [23] B. Aubert et al. (BABAR Collaboration), Nucl. Instrum. and Meth. A 729, 615 (2013).
- [24] V. P. Druzhinin, L. V. Kardapoltsev and V. A. Tayursky, Comput. Phys. Commun. 185, 236 (2014).
- [25] S. Ong and P. Kessler, Phys. Rev. D 38, 2280 (1988).
- [26] G. J. Feldman and R. D. Cousins, Phys. Rev. D 57, 3873 (1998).