The impact of spiral density waves on the distribution of Supernovae
Abstract
We present an analysis of the impact of spiral density waves (DWs) on the radial and surface density distributions of supernovae (SNe) in host galaxies with different arm classes. We use a well-defined sample of 269 relatively nearby, low-inclination, morphologically non-disturbed and unbarred Sa–Sc galaxies from the Sloan Digital Sky Survey, hosting 333 SNe. Only for core-collapse (CC) SNe, a significant difference appears when comparing their -normalized radial distributions in long-armed grand-design (LGD) versus non-GD (NGD) hosts, with that in LGD galaxies being marginally inconsistent with an exponential profile, while SNe Ia exhibit exponential surface density profiles regardless of the arm class. Using a smaller sample of LGD galaxies with estimated corotation radii (), we show that the -normalized surface density distribution of CC SNe indicates a dip at corotation. Although not statistically significant, the high CC SNe surface density just inside and outside corotation may be the sign of triggered massive star formation by the DWs. Our results may, if confirmed with larger samples, support the large-scale shock scenario induced by spiral DWs in LGD galaxies, which predicts a higher star formation efficiency around the shock fronts, avoiding the corotation region.
Keywords:
supernovae: general – galaxies: spiral – galaxies: kinematics and dynamics – galaxies: star formation – galaxies: structure.1 Introduction
The spiral arm structure of star-forming disc galaxies was explained in the framework of density wave (DW) theory by the pioneering work of Lin & Shu (1964). According to this theory, semi-permanent spiral patterns especially in grand-design (GD) galaxies, i.e. spiral galaxies with prominent and well-defined spiral arms, are created by long-lived quasi-stationary DWs. Despite an excellent progress of the theory (Dobbs & Baba, 2014; Shu, 2016, for recent comprehensive reviews, see), there are many disputes on the lifetime of spiral patterns, and the ability of DWs to generate large-scale shocks and trigger star formation, as originally proposed by Roberts (1969). For example, the simulations by Sellwood (2011) manifest short-lived patterns. In another example, using a multiband analysis for some GD galaxies, Foyle et al. (2010) found that there is no shock trigger, and that the spiral arms just reorganize the material from the disc out of which stars form (Grosbøl & Dottori, 2012, see also).
Nevertheless, the results of many other studies are consistent with the picture where the DWs cause massive star formation to occur by compressing gas clouds as they pass through the spiral arms of GD galaxies (Cepa & Beckman, 1990; Knapen et al., 1996; Seigar & James, 2002; Grosbøl & Dottori, 2009; Martínez-García et al., 2009, e.g.). For example, using H direct imaging accompanied with broad-band images in and bands, Cedrés et al. (2013) studied the distribution of H II regions of spiral arms and found clear evidence for the triggering of star formation in the sense of a high density of H II regions at the fixed radial ranges in some GD galaxies. Recently, Pour-Imani et al. (2016) showed that pitch angle of galaxies is statistically more tightly wound, i.e. smaller, when viewed in the light from the evolved/older stellar populations. Both the results, complementing each other, are in excellent agreement with the prediction of theory that stars are not only born in the DW but also move out of it as they age (Shabani et al., 2018, see also most recent results by).
An alternative to the DW theory is the idea of reorganization of the distribution of H II regions in multiple arms of differentially rotating disc with star formation processes generated by the stochastic self-propagating method developed by Mueller & Arnett (1976) and Gerola & Seiden (1978). This mechanism is supposed to work in non-GD (NGD) galaxies, producing flocculent spiral arms.
In the context of above-mentioned scenarios, the main goal of this article is to study the possible impact of spiral DWs (triggering effect) on the distribution of supernovae (SNe) in discs of host galaxies, when viewing in the light of different nature of Type Ia and core-collapse (CC) SNe progenitors. Recall that Type Ia SNe result from stars with masses lower than (Maoz & Mannucci, 2012, ages from Gyr up to Gyr, see) in close binary systems, while the progenitors of Types Ibc and II SNe,11 1 Traditionally, SNe of Types Ib and Ic, including uncertain spectroscopic Type Ib/c, are denoted as SNe Ibc. All these and other subtypes of CC SNe, i.e. Ibc, II, IIb (transitional objects with observed properties close to SNe II and Ib), and IIn (dominated by emission lines with narrow components) SNe, arise from young massive stars with possible differences in their masses, metallicities, and ages (see e.g. Smith et al., 2011, for more details). collectively called CC SNe, are massive (Williams et al., 2018, , see e.g.) young short-lived stars (Anderson et al., 2015; Maund, 2018; Xiao et al., 2018, from a few up to Myr, see).
The first attempt to study the distribution of SNe within the framework of DW theory was performed by Moore (1973). Using the locations of 19 SNe, he suggested that stars in a spiral galaxy are formed in a shock front on the inner edge of a spiral arm, then drift across the arm as they age, predicting for SN progenitors (more likely for SNe II) a short lifetime (a few million years) and high masses (a few tens of solar masses). However, using the fractions of GD and flocculent galaxies in a sample of 111 hosts with 144 SNe, McCall & Schmidt (1986) suggested that DWs do not greatly enhance the massive star formation rate per unit luminosity of a galaxy, mentioning that star formation in most galaxies may be dominated by stochastic processes. Results similar to those in Moore (1973) were obtained also by McMillan & Ciardullo (1996) and Mikhailova et al. (2007) for Types II and Ibc SNe, respectively. In other studies, different authors (Maza & van den Bergh, 1976; Bartunov et al., 1994; Petrosian et al., 2005, e.g.) investigated the distribution of SNe relative to spiral arms of galaxies. Such studies did not interpret their results within the DW theory nor did they distinguish among various spiral arm classes (Elmegreen & Elmegreen, 1987, ACs;) of SNe host galaxies.
Indeed, in our recent paper (Aramyan et al., 2016), we already studied the distribution of SNe relative to the spiral arms of their GD and NGD host galaxies, using the Sloan Digital Sky Survey (SDSS) images from the , , and bands. We found that the distribution of CC SNe (i.e. tracers of recent star formation) is affected by the spiral DWs in their host GD galaxies, being distributed closer to the corresponding edges of spiral arms where large-scale shocks, thus star formation triggering, are expected (see also farther in the text of Section 4). Such an effect was not observed for Type Ia SNe (less-massive and longer-lived progenitors) in GD galaxies, as well as for both types of SNe in NGD hosts. In this paper, we expand our previous work, and for the first time study the differences between the radial distributions of SNe in unbarred Sa–Sc host galaxies with various spiral ACs. In parallel, to check the triggering effect at different galactocentric radii, we study the consistency of the surface density distribution of SNe (normalized to the optical radii, and for a smaller sample also to corotation radii of hosts) with an exponential profile in GD and NGD galaxies.
The layout of this article is the following. In Section 2, we present sample selection and reduction, and determination approach of spiral ACs. The results and their interpretation within the framework of DW theory are presented in Sections 3 and 4, respectively. Section 5 summarizes our conclusions. To conform the values used in databases of our recent papers (Hakobyan et al., 2012; Hakobyan et al., 2014; Hakobyan et al., 2016; Aramyan et al., 2016), a cosmological model with , , and Hubble constant (Spergel et al., 2007) are adopted in this article.
2 The sample
In order to obtain a homogeneous dataset of structural features of SNe host galaxies, including morphology, identification of bars and spiral ACs, we compile the sample of this study in the same way as in Hakobyan et al. (2012), being restricted to relatively nearby SNe with distances . The whole compilation, reduction, and classification procedures are given below.
2.1 Sample selection and reduction
We used the updated version of the Asiago Supernovae Catalogue (Barbon et al., 1999, ASC;), which at the time of writing the article includes SNe detected before 1 July 2017. To identify SNe host galaxies, we cross-matched the coordinates of all classified Type Ia and CC (Ibc and II) SNe from the ASC with the footprint of the SDSS Data Release 13 (Albareti et al., 2017, DR13;). We then classified the identified host galaxies according to Hakobyan et al. (2012) and selected only Sa--Sc types,22 2 Many of the identified host galaxies are already listed in database of Hakobyan et al. (2012), which is based on the SDSS DR8. Here, because we added new SNe, for homogeneity we redid the entire reduction for this restricted sample based only on DR13. since it is known that both GD and NGD shapes are well represented in Sa–Sc spirals (Ann & Lee, 2013; Bittner et al., 2017, e.g.).
We excluded all barred galaxies from our sample to eliminate the effect of substantial suppression of massive star formation in the radial range swept by strong bars (James et al., 2009; James & Percival, 2018, e.g.), i.e. the observed suppression of CC SN numbers inside the bar radius (Hakobyan et al., 2016), and study only the expected impact of the DWs on the distribution of SNe.33 3 It is important to note that in some SN host galaxies we may not detect tiny bars with lengths shorter than a tenth of the optical disc (Hakobyan et al., 2014). However, by the inner truncation of host discs (see Subsection 3.1) we exclude any possible impact of these bars on the distribution of SNe. In addition, we removed host galaxies with strong morphological disturbances according to Hakobyan et al. (2014), i.e. interacting, merging and post-merging/remnant cases, which may add significant distortion into the SN distribution in discs of galaxies.
For the remaining SNe host galaxies, the next step is the measurement of their photometry and geometry. Following Hakobyan et al. (2012), we constructed isophotes in the SDSS DR13 -band, and then visually fit onto each isophote an elliptical aperture. We then measured the major axes (), elongations (), and position angles (PA) of galaxies. In our analysis, we used the corrected for Galactic (Schlegel et al., 1998) and host galaxy internal extinction (Bottinelli et al., 1995). Finally, we calculated the inclinations of host galaxies using elongations and morphological types, following the method presented in Paturel et al. (1997). These procedures are explained in detail in Hakobyan et al. (2012).
We also removed highly inclined galaxies (), because at these inclinations strong absorption and projection effects play a destructive role in discovering SNe (Cappellaro & Turatto, 1997, e.g.) and correcting their radial distribution for inclination of host disc (Hakobyan et al., 2016, e.g.). Moreover, it is difficult to classify highly inclined galaxies and determine their barred structure (Buta, 2013, see review by).
After these operations, we obtained 353 SNe within 285 host galaxies with the aforementioned restrictions.
2.2 Determination of spiral arm classes
Following our recent study (Aramyan et al., 2016), we determined ACs of 285 host galaxies (unbarred Sa–Sc types) with according to the classification scheme by Elmegreen & Elmegreen (1987). To accomplish this, we used the background subtracted and photometrically calibrated -band44 4 Among the SDSS , , and bands with good signal-to-noise ratio, the arm-interarm contrast is the highest in the -band, as it traces the young stellar populations in the spiral arms (Aramyan et al., 2016, see). SDSS images, as well as the RGB colour images from the , , and SDSS data channels. We assigned ACs according to the flocculence, regularity, and shapes of the spiral arms. The SDSS three-colour images representing examples of SN host galaxies with different ACs can be found in Fig. 1. Below, we describe these classes in detail according to Elmegreen & Elmegreen (1987).
Galaxies with AC 12 contain two long symmetric arms, and the ones with AC 9 have two symmetric inner arms, multiple long and continuous outer arms. The underlying mechanism that explains the lengths of arms and their global symmetry in these galaxies is most probably a DW, dominating the entire optical disc (Elmegreen et al., 1992, e.g.). We denote galaxies with ACs 9 and 12 as long-armed GD (LGD) galaxies.
Galaxies with AC 5 have two symmetric short arms in the inner region and irregular outer arms. The AC 6 is like AC 5 in the inner disc region, however with feathery ringlike outer structure. The short inner symmetric arms in these galaxies might be explained by the DW mechanism, dominating only in the inner part of the optical disc (Elmegreen et al., 1992, e.g.). We denote galaxies with ACs 5 and 6 as short-armed GD (SGD) galaxies.
Galaxies with AC 1 are described by chaotic, fragmented and unsymmetric arms, AC 2 is fragmented spirals arm pieces with no regular pattern, AC 3 is fragmented arms uniformly distributed around the galactic centre. Galaxies with AC 4 have only one permanent arm, otherwise fragmented arms. All these flocculent galaxies (ACs 1-4) appear to lack global DWs, instead their spirals may be sheared self-propagating star formation regions (see review by Buta, 2013, and references therein). We denote galaxies with ACs 1-4 as NGD galaxies.
Galaxies with AC 7 have two symmetric long outer arms, feathery or irregular inner arms. In these galaxies, the DWs play a role, most probably, only in the outer part of the optical disc (see review by Buta, 2013, and references therein). In our study, due to the small number statistics (especially for CC SNe), these galaxies are not denoted to a separate class. We have only 11 Type Ia and 6 CC SNe in these hosts. On the other hand, because of the different placement of DWs, it is inadvisable to mix them with other classes. Therefore, we simply omit them from the sample.
Galaxies with AC 8 have tightly wrapped ringlike arms. These ringlike arms (rings and pseudorings) are thought to be related to the gathering of material near dynamical resonances in the disc (Buta, 2013, see review by). Because of the different structural feature and small number statistics (only 3 Type Ia SNe), we omit these galaxies from the sample as well.
Finally, according to Elmegreen & Elmegreen (1987), ACs 10 and 11 were previously reported to be barred galaxies and objects with close neighbors, respectively, and are no longer used.
In the present study, we mainly used these broad classes: LGD (AC 9, 12), SGD (AC 5, 6), and NGD (AC 1-4). Table 1 presents the distributions of 333 SN types among various morphological types of the broad ACs of host galaxies. The number of individual host galaxies is 269. The mean distance of the galaxies is 82 Mpc (standard deviation is 39 Mpc). The mean of the hosts is 120 arcsec with the minimum value of 23 arcsec. In Table 1, we present the numbers of Types Ibc and II SNe separately. However, to increase statistical significance of our results (especially in Section 4), we combined SNe Ibc and II into a single CC SNe class.
| Sa | Sab | Sb | Sbc | Sc | All | |
| LGD (9, 12) | ||||||
| Ia | 2 | 4 | 7 | 21 | 27 | 61 |
| Ibc | 1 | 0 | 2 | 14 | 19 | 36 |
| II | 0 | 1 | 13 | 22 | 61 | 97 |
| All | 3 | 5 | 22 | 57 | 107 | 194 |
| SGD (5, 6) | ||||||
| Ia | 0 | 0 | 2 | 8 | 8 | 18 |
| Ibc | 0 | 0 | 2 | 1 | 6 | 9 |
| II | 0 | 0 | 3 | 7 | 22 | 32 |
| All | 0 | 0 | 7 | 16 | 36 | 59 |
| NGD (1-4) | ||||||
| Ia | 3 | 3 | 5 | 10 | 11 | 32 |
| Ibc | 0 | 5 | 1 | 4 | 4 | 14 |
| II | 1 | 1 | 4 | 9 | 19 | 34 |
| All | 4 | 9 | 10 | 23 | 34 | 80 |
Notes. Among these 333 SNe, there are only 23 uncertain (20 peculiar) classifications. SNe of Type II include only 10 SNe IIb. All Type IIn SNe are removed from the sample due to uncertainties in their progenitor nature (Habergham et al., 2014, e.g.), and often in their classification (Silverman et al., 2013; Pastorello et al., 2018, e.g.).
In order to test our visual classification of spiral arms, the entire sample of SNe host galaxies was independently classified by the first three authors of this paper. By comparing these classifications, we determined that our ACs are 97 per cent reliable. Following Aramyan et al. (2016), it is important to note that the most common mis-classifications of ACs are from 2 or 3 to 4 (or vice versa), from 5 to 6 (or vice versa), and from 9 to 12 (or vice versa). Because we separated SNe host galaxies by their ACs into three broad classes: LGD, SGD, and NGD, the possible mis-classification between them is negligible.
Of the sample galaxies, 56 are in common with galaxies for which ACs were determined by Elmegreen & Elmegreen (1987) on the blue images of the Palomar Observatory Sky Survey (POSS).55 5 For comparison of ACs, another arm-classification by Buta et al. (2015) might be used. However, it is based on middle-infrared images (while we use the SDSS/optical images) and another definition of broad ACs (flocculent: grouping 1-4 ACs, multi-arm: grouping 5-9 ACs, and GD: only AC 12), which complicate the comparison. A comparison of the ACs shows that about 65 per cent of the galaxies have the same broad classes. On the other hand, about 25 per cent of objects change from NGD to SGD or from SGD to LGD (or vice versa). The ACs change from NGD to LGD (or vice versa) only in about 10 per cent of the cases (6 individual galaxies). In all the cases, the SDSS images have deeper exposure and better resolution that the blue photographic plates of the POSS (in some cases, they are even overexposed due to high surface brightness of the object). Therefore, the SDSS based arm-classification seems to be more reliable and more structure is revealed.
The full database of 333 individual SNe (SN designation, type, and offset from host galaxy nucleus) and their 269 hosts (galaxy SDSS designation66 6 For the host galaxies included in Table 4, the PGC names are also available in the database., distance, morphological type, , PA, corrected -band , and AC) is available in the online version (Supporting Information) of this article.
3 Results
To reveal the possible influence of DWs in discs of Sa–Sc galaxies on the distribution and surface density of SNe, we now study the deprojected and normalized galactocentric radii of Type Ia and CC SNe in discs of host galaxies with various ACs.
3.1 The radial distribution and surface density
In Hakobyan et al. (2016); Hakobyan et al. (2017), we already showed that in spiral galaxies all CC SNe and the overwhelming majority of Type Ia SNe belong to the disc, rather than the bulge component. Considering this observational fact, we adopt a simplified model where all SNe are located on infinitely thin host discs and, following Hakobyan et al. (2009), we deproject the galactocentric radii of SNe () for the inclinations of these discs. For each SN, we then normalize to the corresponding host galaxy optical radius, i.e. , to neutralize the greatly different linear (in kpc) sizes of various hosts (as was shown in Hakobyan et al. 2009).77 7 For the normalization, one can suggest to use the SDSS scale lengths (exponential model fits) of galaxies. However, our sample includes a large number of host galaxies with large angular sizes ( arcsec) for which the SDSS fails in estimation of the model scale lengths due to the blending/defragmenting of galaxies with large angular sizes (the scales are not reliable, this is well-known problem). In Hakobyan et al. (2012), we already commented about the SDSS model failure. Thus, reliable scale lengths are not available for many galaxies of our sample.
| Subsample 1 | Subsample 2 | ||||||||
|---|---|---|---|---|---|---|---|---|---|
| Host | SN | Host | SN | ||||||
| LGD | Ia | 61 (50) | versus | NGD | Ia | 32 (24) | 0.521 (0.497) | 0.690 (0.708) | |
| LGD | Ia | 61 (50) | versus | SGD | Ia | 18 (16) | 0.761 (0.800) | 0.505 (0.821) | |
| NGD | Ia | 32 (24) | versus | SGD | Ia | 18 (16) | 0.557 (0.641) | 0.216 (0.671) | |
| LGD | CC | 133 (111) | versus | NGD | CC | 48 (40) | 0.087 (0.048) | 0.106 (0.022) | |
| LGD | CC | 133 (111) | versus | SGD | CC | 41 (39) | 0.410 (0.096) | 0.430 (0.125) | |
| NGD | CC | 48 (40) | versus | SGD | CC | 41 (39) | 0.080 (0.356) | 0.108 (0.312) | |
| LGD | Ia | 61 (50) | versus | LGD | CC | 133 (111) | 0.720 (0.702) | 0.719 (0.706) | |
| SGD | Ia | 18 (16) | versus | SGD | CC | 41 (39) | 0.834 (0.697) | 0.862 (0.590) | |
| NGD | Ia | 32 (24) | versus | NGD | CC | 48 (40) | 0.545 (0.384) | 0.284 (0.169) | |
Notes. The probabilities from two-sample KS and AD tests ( and ) are calculated using the calibrations by Massey (1951) and Pettitt (1976), respectively. The statistically significant differences between the distributions are highlighted in bold.
In Table 2, using the two-sample Kolmogorov--Smirnov (KS) and Anderson--Darling (AD) tests,88 8 The null hypothesis for the two-sample nonparametric KS (or AD) test is that the two distributions being compared are drawn from the same parent population, and the alternative hypothesis that they are not. Traditionally, we chose the threshold of 5 per cent for significance levels (-values) of the tests. The AD test detects differences better than the KS test and generally requires less data to reach sufficient statistical power Engmann & Cousineau (2011). we compare the deprojected and normalized () radial distributions of Type Ia and CC SNe in different pairs of NGD, SGD, and LGD subsamples. From the -values in Table 2, we see no statistically significant differences between the radial distributions of SNe in various subsamples. However, when we compare the inner truncated radial distributions (; shown in brackets), a significant difference appears for CC SNe in LGD versus NGD hosts. The upper panel of Fig. 2 presents the histograms of radii of CC SNe. From these histograms, we see that the radial distribution of CC SNe in NGD subsample is concentrated to the centre of galaxies with a relatively narrow peak and fast decline in the outer disc. In contrast, the distribution of CC SNe in LGD galaxies has a broader peak, shifted to the outer region of the discs, with a somewhat slower decline. The radial distribution of SNe in SGD hosts appears to be intermediate between those in NGD and LGD galaxies.
The inner truncation of the radial distribution of SNe, especially for CC ones, is crucial because of several important effects. The observed numbers of SNe at indicate that because of high surface brightness of galactic nuclei and imperfect reduction of astronomical images it is difficult to discover objects at or near the centre of galaxies, even for nearby ones (Leaman et al., 2011, e.g.). On the other hand, dust extinction in host galaxy disc, particularly in the nuclear region (Holwerda et al., 2015, e.g.), can affect the radial distributions of SNe (Wang et al., 1997; Hatano et al., 1998, e.g.). Since CC SNe have peak luminosities that are magnitudes lower than do SNe Ia (Richardson et al., 2002, e.g.), CC SNe are more strongly affected by these effects than are Type Ia SNe.
| Host | SN | ||||||||||
|---|---|---|---|---|---|---|---|---|---|---|---|
| (1) | (2) | (3) | (4) | (5) | (6) | (7) | (8) | (9) | (10) | ||
| All | Ia | 111 | 0.141 | 0.148 | 90 | 0.272 | 0.333 | ||||
| LGD | Ia | 61 | 0.730 | 0.514 | 50 | 0.886 | 0.791 | ||||
| SGD | Ia | 18 | 0.318 | 0.290 | 16 | 0.737 | 0.506 | ||||
| NGD | Ia | 32 | 0.557 | 0.489 | 24 | 0.449 | 0.379 | ||||
| All | CC | 222 | 0.005 | 0.002 | 190 | 0.117 | 0.172 | ||||
| LGD | CC | 133 | 0.017 | 0.018 | 111 | 0.070 | 0.043 | ||||
| SGD | CC | 41 | 0.023 | 0.035 | 39 | 0.349 | 0.440 | ||||
| NGD | CC | 48 | 0.191 | 0.180 | 40 | 0.579 | 0.407 | ||||
Notes. Columns 1 and 2 give the subsample; Col. 3 is the number of SNe in the subsample; Cols. 4 and 5 are the and probabilities from one-sample KS and AD tests, respectively, that the global () distribution of SNe is drawn from the best-fitting exponential surface density profile; Col. 6 is the maximum likelihood value of with bootstrapped error (repeated times); Cols. 7–10 are respectively the same as Cols. 3–6, but for the inner-truncated () distribution. The and are calculated using the calibrations by Massey (1951) and D’Agostino & Stephens (1986), respectively. The statistically significant deviations from an exponential law are highlighted in bold.
In Hakobyan et al. (2016), we already demonstrated that in the central regions of unbarred spiral galaxies the surface densities of SNe show a drop, significantly for CC SNe (see also in the middle panel of Fig. 2), in comparison with the exponential surface density profiles of the parent populations (van den Bergh, 1997; Wang et al., 2010, see also). We list, in columns 4 and 5 of Table 3, for different subsamples of the present study, the and probabilities from one-sample KS and AD tests, respectively, that the distributions of SNe are drawn from the best-fitting exponential surface density profiles. We obtain profiles using the maximum likelihood estimation (MLE) method, where is the scale length of the distribution (column 6 of Table 3) and is the central surface density of SNe. The -values in Table 3 show that the global () distributions of Type Ia SNe in different subsamples are consistent with the exponential profiles. However, the surface density distributions of CC SNe are not consistent with the exponential profiles in all subsamples of host galaxies, except the NGD hosts.
To exclude the selection effects at the centres of host galaxies, we repeat our procedure for range (see columns 7–10 in Table 3). Now, with only one exception, the surface density distributions of Type Ia and CC SNe in different subsamples are consistent with the exponential profiles. The inner-truncated scale lengths are in agreement with those in Hakobyan et al. (2016): using nearby low-inclined early-type spiral galaxies (unbarred Sa–Sbc, without splitting the sample according to ACs) we found and in the SDSS -band.
Only the surface density distribution of CC SNe in LGD galaxies is inconsistent with an inner-truncated exponential profile (as seen in Table 3 for the AD statistic but only very marginally so in the KS statistic). From the middle panel of Fig. 2, we see that the surface density is marginally higher than the best-fitting exponential profile at . The inconsistency becomes more evident if we compare the distribution of CC SNe in LGD galaxies with the inner-truncated exponential profile with the scale length of CC SNe in NGD galaxies ( and ). For the visualization, the latter (upper blue dashed line in the middle panel of Fig. 2) is also scaled according to the central surface density of the profile in LGD hosts. The bottom panel of Fig. 2 shows the cumulative distributions of CC SN radii with their best-fitting exponential cumulative distribution functions (CDFs).
4 Interpretation within the framework of density wave theory
In this section, we interpret the results above in the context of triggered massive star formation by the DWs in GD galaxies, especially in LGD hosts (Cepa & Beckman, 1990; Seigar & James, 2002; Cedrés et al., 2013, e.g.).

In a simple model of GD host galaxies (Fig. 3), we assume that the spiral pattern rotates with a constant angular velocity, while the gas and stars have differential rotation, and a corotation radius/region () exists where these two angular velocities are equal. Inside the corotation radius, the disc rotates faster than the spiral arm pattern, and therefore massive star formation triggering is expected in a shock front around the inner edges of arms (thick black curves inside red solid circle in Fig. 3, see also fig. 9 of Aramyan et al. 2016), as originally proposed by Roberts (1969). On the contrary, outside the corotation radius, the arm pattern rotates faster than the disc. Therefore, gas and stars are caught up by the spiral arms. In this case, star formation is expected to be triggered in a shock front around the outer edges of arms (thick black curves outside red solid circle in Fig. 3). Indeed, in Aramyan et al. (2016), we already showed that the distribution of CC SNe (explosions of young short-lived massive stars) relative to the SDSS -band peaks of spiral arms depends on the galactocentric radial range. In particular, the locations of CC SNe are shifted to the inner and outer edges of the spiral arms inside and outside the mean corotation radius () of LGD galaxies, respectively. For Type Ia SNe (explosions of less-massive and longer-lived stars), the distribution relative to spiral arms showed no significant dependence on galactocentric radii.
In the corotation region (thick gray ring in Fig. 3) where the stars and gas rotate at the same velocity as the spiral pattern, the triggering of star formation is not expected, given the absence of spiral shocks. Mainly, the gravitation instability is responsible for the star formation in this region (as in the entire disc of a NGD galaxy). Due to absence of star formation triggering spiral shocks in the corotation region (Cedrés et al., 2013, e.g.), the surface density of CC SNe should show a drop around in GD galaxies. At the same time, at large radii () the DWs are expected to fade (Elmegreen et al., 1992, e.g.). Therefore, at large radii, star formation triggered by shock fronts at the outer edges of arms should be not significant (thick black dashed curves in Fig. 3).
Notes. Column 1 is the host galaxy PGC name; Col. 2 is the galaxy AC (see Subsection 2.2); Cols. 3 and 4 are the numbers of Type Ia and CC SNe in the galaxy; Cols. 5 and 6 are the normalized corotation radii of the galaxy; Col. 7 is the references of corotation radii. The values are calculated using the in arcsec from the mentioned references and the galaxy in the SDSS -band (see Subsection 2.1). When more than one references are available for the same corotation region and the reported radii are matched within the errors, we list their mean values. Nuclear and circumnuclear corotation radii (coincided with star-forming rings/ovals), as well as those with uncertain (very weak/noisy) estimation are not selected from the references.
To study the distribution of SNe relative to of hosts, we carried out an extensive literature search for corotation radii of our SGD and LGD galaxies. Only 30 nearby host galaxies () with 8 Type Ia and 48 CC SNe have available corotation radii (Table 4). These radii were estimated using different methods. For example, Elmegreen et al. (1992) found clear evidences for the corotation radii in gas-rich galaxies, in the form of sharp endpoints to star formation ridges and dust lanes in GD spirals. Verley et al. (2007) used Fourier analysis and focused on the modes of the spiral arms, computing the torques between the gas and newly formed stars (H emission), and the bulk of the optical matter (-band), which can be used to locate the corotation regions. Buta & Zhang (2009) used the potential-density phase-shift method on deprojected -band images to locate the corotation radii for a large number of spiral galaxies. Font et al. (2014) used the changes in direction of the radial component of the in-plane velocities, using the emission in H, at the resonance radii to find corotations in disc galaxies. For more details of these and other methods, the reader is referred to the original papers mentioned in Table 4. Farther in our study, we use these corotation radii normalized to the optical radii of host galaxies in the SDSS -band, i.e. .
In Table 4, it can be seen that for some individual galaxies more than one corotation radius is found. This is not unexpected because real spiral galaxies are more complex physical objects in comparison with the simple model presented in Fig. 3. In some galaxies, single pattern velocities and single corotation radii are observed, while in other systems multiple spiral patterns with different velocities and resonant coupling (Meidt et al., 2009, e.g.), and therefore multiple corotation radii are discovered (Buta & Zhang, 2009; Font et al., 2014, e.g.). In particular, Buta & Zhang (2009) found that GD galaxies have on average 2-3 corotation radii, except for exceptionally strong GD spirals (AC12), which mostly have a single corotation radius. This is in agreement with our ACs of SNe host galaxies and collected corotation radii in Table 4.
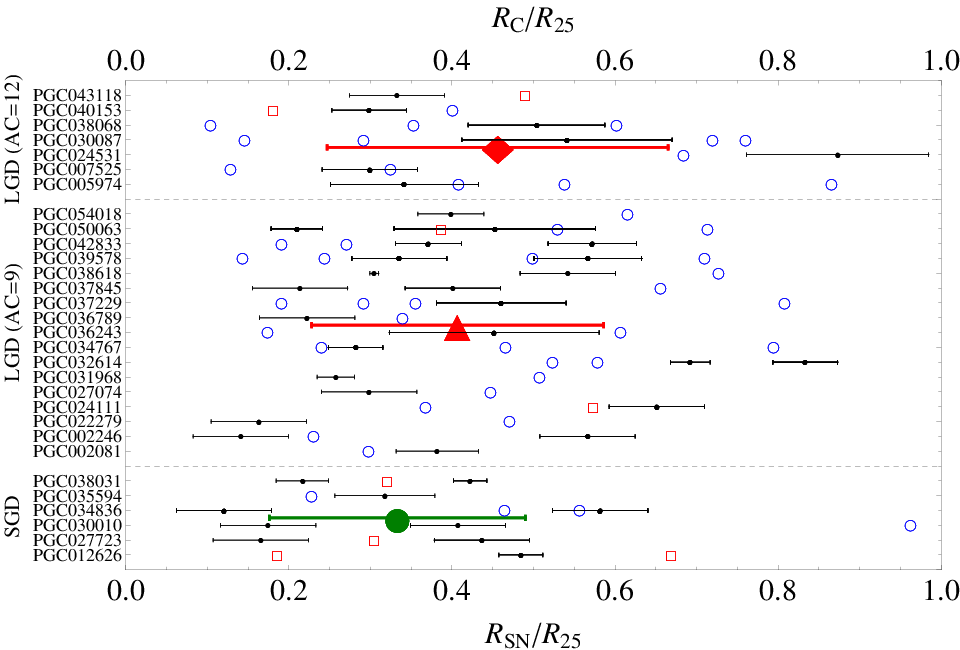
In Fig. 4, we present the galactocentric positions for 30 host galaxies of Table 4, separated according to their ACs: 6 SGD (AC5 and 6), 17 LGD (AC9), and 7 LGD (AC12) galaxies. Here, we separate LGD host galaxies between two ACs in order to check possible differences between the distributions and the mean values of their corotation radii. A similar separation is impossible for SGD galaxies due to the small size of this subsample (see Table 4). In Fig. 4, we also show the galactocentric positions of SNe for each host galaxy.

The mean values of normalized corotation radii and the standard deviations are 0.330.16, 0.18, and for SGD, LGD with AC9 and AC12 galaxies, respectively. For the united LGD (AC9 and 12) subsample, the normalized corotation radius is . Meanwhile, the two-sample KS and AD tests show that the difference between the distributions of values in LGD (AC9 and 12) and SGD galaxies is statistically not significant ( and ). The same is valid when comparing the distributions in LGD (AC12) and SGD galaxies ( and ). Therefore, further in our study we do not separate the LGD subsample. Fig. 5 shows the histograms and cumulative distributions of values of LGD and SGD galaxies. Also, it is important to note, that the value for LGD galaxies is in good agreement with that () adopted in our previous study (Aramyan et al., 2016).


To check the possible impact of DWs on the distribution of SNe (as schematically presented in Fig. 3), we now normalize the SN radii to the corresponding corotation radii of host galaxies. When a host galaxy has two corotation radii in Table 4, we use a proximity criterion, selecting only the value of that is closest to the value of . For LGD host galaxies, Fig. 6 displays the histogram and surface density of 44 CC SNe positions in units of the corotation radii (). The surface density of CC SNe is consistent with the best-fitting global (, ) and inner-truncated (, ) exponential profiles with the MLE scale lengths of and , respectively. However, the figure indicates a strong dip at the corotation radius, and excess surface densities of CC SNe at and .
Since the lifetime of massive progenitors of CC SNe is significantly short, their explosion sites, on average, coincide with the birthplace. Therefore, the prominently high surface density of CC SNe in comparison with the best-fitting exponential profile around the mentioned radii, inside and outside the corotation region, can be considered as a plausible indicator of triggered massive star formation by the DWs in LGD host galaxies. These results are in agreement with those of Cedrés et al. (2013), who found clear evidence of massive star formation triggering in the sense of a high density of H II regions at the fixed radii, avoiding the corotation region, created after the passage of the arm material through the DW in some GD galaxies (Cepa & Beckman, 1990; Seigar & James, 2002, see also).
Considering that the different LGD host galaxies have various corotation radii (see Table 4 and Fig. 4) distributed around the mean value of (see Fig. 5), the radii of triggered star formation by DWs should be blurred within a radial region including to range in units of , preventing to observe a drop in the mean corotation region (middle panel of Fig. 2). Therefore, most probably, the impact of DWs (triggering effect) is responsible for a marginally higher surface density of CC SNe within the mentioned radial range, and for the inconsistency of the surface density distribution with the inner-truncated exponential profile in LGD hosts (middle panel of Fig. 2 and Table 3).
To check the significance of the drop of surface density at and excess at and (see Fig. 6), we study the distribution of CC SNe distances to the nearest corotation in units of corotation radius, . Fig. 7 displays the differential and cumulative distances in the global disc of LGD galaxies. Since a given value of distance can occur either for position or for position (both in units of corotation radius), the probability distribution function (PDF) of distances follows
| (4) |
where is the best-fitting scale length of the SNe (in units of the corotation radii). The CDF for is then
| (8) |
In Fig. 7, the black curves are the best-fitting (with MLE) expected distribution. Fig. 7 highlights the lack of CC SNe at corotation and excess outside/inside the in the LGD hosts. However, a KS test indicates a P-value of 0.176, while an AD test indicates a P-value of 0.197. We check the significance of the drop/excess in the global disc, adding also four CC SNe from SGD sample. The result is: and . For the inner-truncated disc of LGD (LGD+SGD) galaxies, the and . Thus, the lack of CC SNe at corotation and excess at and do not appear statistically significant. Note that these tests ignore the uncertainties on the corotation radii. Including them would weaken even more the statistical significance of these features in the surface density profile of CC SNe.
It is important to note that, if one wants to test the star formation activity at the corotation, the estimates of corotation radii based on kinematic or dynamic arguments (Font et al., 2014, e.g.) would be preferable as they would be more independent of the regions with lack of star formation (Elmegreen et al., 1992, e.g.) or specific morphological features in the discs (Buta & Zhang, 2009, e.g.). Only 18 CC SNe (17 in LGD and one in SGD) have host galaxies with such preferable estimates of . If we consider only these objects, the triggering evidence and the dip in the global disc remain not significant ( and ), probably due to even smaller statistics.
Another importance is that galaxies with several spiral patterns with different angular velocities, i.e. more than one corotation, might have interactions between the patterns (e.g. Font et al., 2014, at of one with inner/outer Lindblad resonance of the other) causing turbulence in the interface regions between the patterns and thereby increase star formation activity at those regions (Dobbs & Baba, 2014; Shu, 2016, see reviews by). Therefore, the distribution of CC SNe (Figs. 6 and 7) might be contaminated by the objects at the , weakening the observed dip. In Table 4, we see that 31 CC SNe (30 in LGD and one in SGD) have host galaxies with single . If we consider only these objects, the triggering evidence and the dip in the global disc are again statistically not significant ( and ).
Unfortunately, due to the insufficient number of CC SNe in SGD galaxies (only 4 objects, see Table 4), as well as Type Ia SNe in the LGD (4 cases) and SGD (4 objects) subsamples, a similar study of their distributions relative to is ineffective. In the future, when more information is available on corotation radii of SN host galaxies, we will be able to extend our study including all SN types in LGD and SGD galaxies.
5 Conclusions
In this study, using a well-defined and homogeneous sample of SN host galaxies from the coverage of SDSS DR13, we analyse the radial and surface density distributions of Type Ia and CC SNe in host galaxies with different ACs to find the possible impact of spiral DWs as triggers for star formation. Our sample consists of 269 relatively nearby (, the mean distance is 82 Mpc), low-inclination (), morphologically non-disturbed and unbarred Sa–Sc galaxies, hosting 333 SNe in total. In addition, we perform an extensive literature search for corotation radii, collecting data for 30 host galaxies with 56 SNe.
The main results concerning the deprojected and inner-truncated () distributions of SNe in host galactic discs are the following:
- 1.
We find no statistical differences between the pairs of the -normalized radial distributions of Type Ia and CC SNe in discs of host galaxies with different spiral ACs, with only one significant exception: CC SNe in LGD and NGD galaxies have significantly different radius distributions (Table 2). The radial distribution of CC SNe in NGDs is concentrated to the centre of galaxies with relatively narrow peak and fast exponential decline at the outer region, while the distribution of CC SNe in LGD galaxies has a broader peak, shifted to the outer region of the discs (upper panel of Fig. 2).
- 2.
The surface density distributions of Type Ia and CC SNe in most of the subsamples are consistent with the exponential profiles. Only the distribution of CC SNe in LGD galaxies appears to be inconsistent with an exponential profile (Table 3 for the AD statistic but only very marginally so for the KS statistic), being marginally higher at . The inconsistency becomes more evident when comparing the same distribution with the scaled exponential profile of CC SNe in NGD galaxies (middle panel of Fig. 2).
- 3.
Using a smaller sample of LGD galaxies with estimated corotation radii, we show, for the first time, that the surface density distribution of CC SNe shows a dip at corotation, and enhancements at corotation radii around it (Fig. 6). However, these features are not statistically significant (Fig. 7). The CC SNe enhancements around corotation may, if confirmed with larger samples, indicate that massive star formation is triggered by the DWs in LGD host galaxies. Considering that the different LGD host galaxies have various corotation radii (Table 4 and Fig. 4) distributed around the mean value of (Fig. 5), the radii of triggered star formation by DWs are most probably blurred within a radial region including to range in units of , without a prominent drop in the mean corotation region (middle panel of Fig. 2).
These results for CC SNe in LGD galaxies may, if confirmed with larger samples and better corotation estimates, support the large-scale shock scenario (Moore, 1973, e.g.), originally proposed by Roberts (1969), which predicts a higher star formation efficiency, avoiding the corotation region (Cepa & Beckman, 1990; Seigar & James, 2002; Cedrés et al., 2013; Aramyan et al., 2016, e.g.).
When more information will become available on corotation radii of SN host galaxies, it would be worthwhile to extend our study, by comparing the -normalized radial and surface density distributions of Type Ia and CC SNe in LGD galaxies. This will also allow to check the impact of spiral DWs on the distribution of less-massive and longer-lived progenitors of Type Ia SNe. Moreover, similar analysis of SNe in SGD galaxies can help to understand the role of DWs in star formation triggering, if any.
Acknowledgements
We would like to thank the referee, Preben Grosbøl, for excellent comments that improved the clarity of this paper. AGK, AAH, and LVB acknowledge the hospitality of the Institut d’Astrophysique de Paris (France) during their stay as visiting scientists supported by the Programme Visiteurs Extérieurs (PVE). This work was supported by the RA MES State Committee of Science, in the frames of the research project number 15T–1C129. This work was made possible in part by a research grant from the Armenian National Science and Education Fund (ANSEF) based in New York, USA. V.A. acknowledges the support from Fundação para a Ciência e Tecnologia (FCT) through Investigador FCT contract nr. IF/00849/2015/CP1273/CT0003 and the support from FCT through national funds and by FEDER through COMPETE2020 by the grant PTDC/FIS-AST/7073/2014 & POCI-01-0145-FEDER-016880. Funding for the SDSS–IV has been provided by the Alfred P. Sloan Foundation, the US Department of Energy Office of Science, and the Participating Institutions. SDSS–IV acknowledges support and resources from the Center for High-Performance Computing at the University of Utah. The SDSS web site is www.sdss.org. SDSS–IV is managed by the Astrophysical Research Consortium for the Participating Institutions of the SDSS Collaboration including the Brazilian Participation Group, the Carnegie Institution for Science, Carnegie Mellon University, the Chilean Participation Group, the French Participation Group, Harvard-Smithsonian Center for Astrophysics, Instituto de Astrofísica de Canarias, The Johns Hopkins University, Kavli Institute for the Physics and Mathematics of the Universe (IPMU) / University of Tokyo, Lawrence Berkeley National Laboratory, Leibniz Institut für Astrophysik Potsdam (AIP), Max-Planck-Institut für Astronomie (MPIA Heidelberg), Max-Planck-Institut für Astrophysik (MPA Garching), Max-Planck-Institut für Extraterrestrische Physik (MPE), National Astronomical Observatories of China, New Mexico State University, New York University, University of Notre Dame, Observatário Nacional / MCTI, The Ohio State University, Pennsylvania State University, Shanghai Astronomical Observatory, United Kingdom Participation Group, Universidad Nacional Autónoma de México, University of Arizona, University of Colorado Boulder, University of Oxford, University of Portsmouth, University of Utah, University of Virginia, University of Washington, University of Wisconsin, Vanderbilt University, and Yale University.
References
- Albareti et al. (2017) Albareti F. D., et al., 2017, ApJS, 233, 25
- Anderson et al. (2015) Anderson J. P., James P. A., Habergham S. M., Galbany L., Kuncarayakti H., 2015, PASA, 32, e019
- Ann & Lee (2013) Ann H. B., Lee H.-R., 2013, J. Kor. Astron. Soc., 46, 141
- Aramyan et al. (2016) Aramyan L. S., et al., 2016, MNRAS, 459, 3130
- Barbon et al. (1999) Barbon R., Buondí V., Cappellaro E., Turatto M., 1999, A&AS, 139, 531
- Bartunov et al. (1994) Bartunov O. S., Tsvetkov D. Y., Filimonova I. V., 1994, PASP, 106, 1276
- Bittner et al. (2017) Bittner A., Gadotti D. A., Elmegreen B. G., Athanassoula E., Elmegreen D. M., Bosma A., Muñoz-Mateos J.-C., 2017, MNRAS, 471, 1070
- Bottinelli et al. (1995) Bottinelli L., Gouguenheim L., Paturel G., Teerikorpi P., 1995, A&A, 296, 64
- Buta (2013) Buta R. J., 2013, in Oswalt T. D., Keel W. C., eds, Planets, Stars and Stellar Systems, Vol. 6: Extragalactic Astronomy and Cosmology. Springer, Dordrecht. p. 1
- Buta & Zhang (2009) Buta R. J., Zhang X., 2009, ApJS, 182, 559
- Buta et al. (2015) Buta R. J., et al., 2015, ApJS, 217, 32
- Canzian & Allen (1997) Canzian B., Allen R. J., 1997, ApJ, 479, 723
- Cappellaro & Turatto (1997) Cappellaro E., Turatto M., 1997, in Ruiz-Lapuente P., Canal R., Isern J., eds, NATO Adv. Sci. Inst. Ser. C, Vol. 486, Thermonuclear Supernovae. Springer, Dordrecht. p. 77
- Cedrés et al. (2013) Cedrés B., Cepa J., Bongiovanni Á., Castañeda H., Sánchez-Portal M., Tomita A., 2013, A&A, 560, A59
- Cepa & Beckman (1990) Cepa J., Beckman J. E., 1990, ApJ, 349, 497
- Comerón et al. (2014) Comerón S., et al., 2014, A&A, 562, A121
- D’Agostino & Stephens (1986) D’Agostino R. B., Stephens M. A., 1986, Goodness-of-Fit Techniques, Statistics: Textbooks and Monographs, Vol. 68, Marcel Dekker Inc., New York, Basel
- Dobbs & Baba (2014) Dobbs C., Baba J., 2014, PASA, 31, e035
- Egusa et al. (2009) Egusa F., Kohno K., Sofue Y., Nakanishi H., Komugi S., 2009, ApJ, 697, 1870
- Elmegreen & Elmegreen (1987) Elmegreen D. M., Elmegreen B. G., 1987, ApJ, 314, 3
- Elmegreen et al. (1992) Elmegreen B. G., Elmegreen D. M., Montenegro L., 1992, ApJS, 79, 37
- Engmann & Cousineau (2011) Engmann S., Cousineau D., 2011, J. Appl. Quant. Methods, 6, 1
- Font et al. (2014) Font J., Beckman J. E., Querejeta M., Epinat B., James P. A., Blasco-herrera J., Erroz-Ferrer S., Pérez I., 2014, ApJS, 210, 2
- Foyle et al. (2010) Foyle K., Rix H.-W., Walter F., Leroy A. K., 2010, ApJ, 725, 534
- Fridman et al. (2001) Fridman A. M., et al., 2001, MNRAS, 323, 651
- Gerola & Seiden (1978) Gerola H., Seiden P. E., 1978, ApJ, 223, 129
- Gonzalez & Graham (1996) Gonzalez R. A., Graham J. R., 1996, ApJ, 460, 651
- Grosbøl & Dottori (2009) Grosbøl P., Dottori H., 2009, A&A, 499, L21
- Grosbøl & Dottori (2012) Grosbøl P., Dottori H., 2012, A&A, 542, A39
- Habergham et al. (2014) Habergham S. M., Anderson J. P., James P. A., Lyman J. D., 2014, MNRAS, 441, 2230
- Hakobyan et al. (2009) Hakobyan A. A., Mamon G. A., Petrosian A. R., Kunth D., Turatto M., 2009, A&A, 508, 1259
- Hakobyan et al. (2012) Hakobyan A. A., Adibekyan V. Z., Aramyan L. S., Petrosian A. R., Gomes J. M., Mamon G. A., Kunth D., Turatto M., 2012, A&A, 544, A81
- Hakobyan et al. (2014) Hakobyan A. A., et al., 2014, MNRAS, 444, 2428
- Hakobyan et al. (2016) Hakobyan A. A., et al., 2016, MNRAS, 456, 2848
- Hakobyan et al. (2017) Hakobyan A. A., et al., 2017, MNRAS, 471, 1390
- Hatano et al. (1998) Hatano K., Branch D., Deaton J., 1998, ApJ, 502, 177
- Holwerda et al. (2015) Holwerda B. W., Reynolds A., Smith M., Kraan-Korteweg R. C., 2015, MNRAS, 446, 3768
- James & Percival (2018) James P. A., Percival S. M., 2018, MNRAS, 474, 3101
- James et al. (2009) James P. A., Bretherton C. F., Knapen J. H., 2009, A&A, 501, 207
- Knapen et al. (1996) Knapen J. H., Beckman J. E., Cepa J., Nakai N., 1996, A&A, 308, 27
- Kranz et al. (2003) Kranz T., Slyz A., Rix H.-W., 2003, ApJ, 586, 143
- Leaman et al. (2011) Leaman J., Li W., Chornock R., Filippenko A. V., 2011, MNRAS, 412, 1419
- Lin & Shu (1964) Lin C. C., Shu F. H., 1964, ApJ, 140, 646
- Maoz & Mannucci (2012) Maoz D., Mannucci F., 2012, PASA, 29, 447
- Martínez-García et al. (2009) Martínez-García E. E., González-Lópezlira R. A., Bruzual-A G., 2009, ApJ, 694, 512
- Massey (1951) Massey F. J., 1951, J. Am. Stat. Assoc., 46, 68
- Maund (2018) Maund J. R., 2018, MNRAS, 476, 2629
- Maza & van den Bergh (1976) Maza J., van den Bergh S., 1976, ApJ, 204, 519
- McCall & Schmidt (1986) McCall M. L., Schmidt F. H., 1986, ApJ, 311, 548
- McMillan & Ciardullo (1996) McMillan R. J., Ciardullo R., 1996, ApJ, 473, 707
- Meidt et al. (2009) Meidt S. E., Rand R. J., Merrifield M. R., 2009, ApJ, 702, 277
- Mikhailova et al. (2007) Mikhailova G. A., Bartunov O. S., Tsvetkov D. Y., 2007, Astronomy Letters, 33, 715
- Moore (1973) Moore E., 1973, PASP, 85, 564
- Mueller & Arnett (1976) Mueller M. W., Arnett W. D., 1976, ApJ, 210, 670
- Pastorello et al. (2018) Pastorello A., et al., 2018, MNRAS, 474, 197
- Paturel et al. (1997) Paturel G., et al., 1997, A&AS, 124, 109
- Petrosian et al. (2005) Petrosian A., et al., 2005, AJ, 129, 1369
- Pettitt (1976) Pettitt A. N., 1976, Biometrika, 63, 161
- Pour-Imani et al. (2016) Pour-Imani H., Kennefick D., Kennefick J., Davis B. L., Shields D. W., Shameer Abdeen M., 2016, ApJ, 827, L2
- Rautiainen et al. (2008) Rautiainen P., Salo H., Laurikainen E., 2008, MNRAS, 388, 1803
- Richardson et al. (2002) Richardson D., Branch D., Casebeer D., Millard J., Thomas R. C., Baron E., 2002, AJ, 123, 745
- Roberts (1969) Roberts W. W., 1969, ApJ, 158, 123
- Schlegel et al. (1998) Schlegel D. J., Finkbeiner D. P., Davis M., 1998, ApJ, 500, 525
- Seigar & James (2002) Seigar M. S., James P. A., 2002, MNRAS, 337, 1113
- Sellwood (2011) Sellwood J. A., 2011, MNRAS, 410, 1637
- Sempere & Rozas (1997) Sempere M. J., Rozas M., 1997, A&A, 317, 405
- Shabani et al. (2018) Shabani F., et al., 2018, MNRAS, 478, 3590
- Shu (2016) Shu F. H., 2016, ARA&A, 54, 667
- Silverman et al. (2013) Silverman J. M., et al., 2013, ApJS, 207, 3
- Smith et al. (2011) Smith N., Li W., Filippenko A. V., Chornock R., 2011, MNRAS, 412, 1522
- Spergel et al. (2007) Spergel D. N., et al., 2007, ApJS, 170, 377
- Tamburro et al. (2008) Tamburro D., Rix H.-W., Walter F., Brinks E., de Blok W. J. G., Kennicutt R. C., Mac Low M.-M., 2008, AJ, 136, 2872
- van den Bergh (1997) van den Bergh S., 1997, AJ, 113, 197
- Verley et al. (2007) Verley S., Combes F., Verdes-Montenegro L., Bergond G., Leon S., 2007, A&A, 474, 43
- Waller et al. (1997) Waller W. H., et al., 1997, ApJ, 481, 169
- Wang et al. (1997) Wang L., Höflich P., Wheeler J. C., 1997, ApJ, 483, L29
- Wang et al. (2010) Wang J., Deng J. S., Wei J. Y., 2010, MNRAS, 405, 2529
- Williams et al. (2018) Williams B. F., Hillis T. J., Murphy J. W., Gilbert K., Dalcanton J. J., Dolphin A. E., 2018, ApJ, 860, 39
- Xiao et al. (2018) Xiao L., Galbany L., Eldridge J. J., Stanway E. R., 2018, preprint, (arXiv:1805.01213)
Supporting information
Supplementary data are available at MNRAS online
Onlinedata.csv
Please note: Oxford University Press is not responsible for the
content or functionality of any supporting materials supplied by
the authors. Any queries (other than missing material) should be
directed to the corresponding author for the article.