Scalability Analysis of a LoRa Network under Imperfect OrthogonalityThanks: A. Mahmood, L. Guntupalli, R. Rondón and M. Gidlund are with the Department of Information Systems and Technology, Mid Sweden University, 851 70 Sundsvall, Sweden, e-mail: aamir.mahmood@miun.se.Thanks: E. Sisinni is with the Department of Information Engineering, University of Brescia, 25123 Brescia, Italy.Thanks: S. A. Hassan is with the School of Electrical Engineering and Computer Science, National University of Sciences and Technology, Islamabad 44000, Pakistan.
Abstract
Low-power wide-area network (LPWAN) technologies are gaining momentum for internet-of-things (IoT) applications since they promise wide coverage to a massive number of battery-operated devices using grant-free medium access. LoRaWAN, with its physical (PHY) layer design and regulatory efforts, has emerged as the widely adopted LPWAN solution. By using chirp spread spectrum modulation with qausi-orthogonal spreading factors (SFs), LoRa PHY offers coverage to wide-area applications while supporting high-density of devices. However, thus far its scalability performance has been inadequately modeled and the effect of interference resulting from the imperfect orthogonality of the SFs has not been considered. In this paper, we present an analytical model of a single-cell LoRa system that accounts for the impact of interference among transmissions over the same SF (co-SF) as well as different SFs (inter-SF). By modeling the interference field as Poisson point process under duty-cycled ALOHA, we derive the signal-to-interference ratio (SIR) distributions for several interference conditions. Results show that, for a duty cycle as low as 0.33%, the network performance under co-SF interference alone is considerably optimistic as the inclusion of inter-SF interference unveils a further drop in the success probability and the coverage probability of approximately 10% and 15%, respectively for 1500 devices in a LoRa channel. Finally, we illustrate how our analysis can characterize the critical device density with respect to cell size for a given reliability target.
Index Terms:
Low power wide area networks, LoRaWAN, interference analysis, coverage probability, fading channelsI Introduction
Over the past few years, the implementation of internet- of-things (IoT) in a variety of sectors, including smart- home, office, city and industry, has experienced an exponential growth [1]. In general, IoT applications require the network to be low-cost, low-energy, reliable and, given the increasing number of connected devices, scalable. At the moment, IoT applications are supported by available technologies such as Zigbee, Bluetooth and WiFi for short-range communication; and cellular networks (e.g., 3G, LTE, 5G) for long-reach scenarios [2, 3].
However, applications that require the energy-efficient performance of short-range technologies but aim at reaching longer distances, prove to be a challenge for cellular systems. To this end, low-power wide-area networks (LPWAN) are recently taking the research spotlight [4]. LPWANs provide long-rage communication by limiting bit rates, making them a viable alternative for these cases. LoRaWAN is one of such emerging solutions supporting many smart applications [5].
Smart metering, for instance, is one of the potential applications of LoRaWAN [6]. The smart metering emables remote monitoring of resource (electricity, water, gas) consumption, which is becoming necessary both for operators and consumers, e.g., for demand response, dynamic pricing, load monitoring and forecasting [7][8]. In urban cities, as the massive number of metering devices are to be connected, the choice of the communication technology depends on the number of supported devices and its scalability [9]. In this respect, LoRaWAN with its scalable–star-of-stars–network architecture and simple medium access mechanism offers the required elements to support such applications. In a LoRaWAN cell, the nodes communicate with a gateway via a single-hop LoRa link using grant-free pure ALOHA protocol as medium access mechanism, which allows multiple nodes to uplink event-reports without any handshaking. As ALOHA works without any contention mechanism and is prone to collisions, LoRa–the physical (PHY) layer [10]–offers degrees of freedom in carrier frequency (CF), bandwidth (BW), coding rate (CR) and spreading factors (SFs) to orthogonalize transmissions, and thus can support high-density deployment of devices. Also, thanks to the chirp spread spectrum (CSS) modulation employed by LoRa, the SFs act as virtual channels for a given CF, BW and CR. Despite the apparent robustness of LoRaWAN technology, a scalability analysis; how does LoRa scale with device density and cell size while ensuring a certain quality of service, is required to understand its potential for enabling smart applications.
I-A Related Works and Motivation
In general, the scalability of a LoRa network can be affected by: a) co-SF interference, caused by unruly same channel transmissions using the same SF, that can restrict the scalability in plausible high-density deployments if the signal-to-interference ratio (SIR) of the desired transmission is below a certain threshold, b) inter-SF interference, which stems from the imperfect orthogonality among different SFs and implies that the transmissions from different SFs are not completely immune to the adjacent SFs, thus requiring a certain level of SIR protection. A common assumption in the literature is that the different SFs are completely orthogonal to each other, thus providing complete protection to concurrent transmissions of different SFs [11]. Recently in [12], based on simulations and USRP-based implementation, the impact of quasi-orthogonality of the SFs on link-level performance reveals the opposite, thus invalidating that common notion. Although the required SIR protection is low, it can severely affect the network performance in cases when the interfering terminal is closer to the receiver (a gateway) than the desired terminal, usually referred to as the near-far conditions.
Apart from assuming the complete orthogonality among SFs, the LoRa performance modeling and analysis under co-SF interference is also limited. In [13, 14, 15, 6], the authors analyzed the LoRa performance only by simulations. On the other hand, there exists a few analytical studies in the literature, for instance, in [14, 16] pure ALOHA was assumed and the concurrent transmissions were considered to be lost regardless of the SIR level at the receiver. Similarly in [5], LoRa capacity was studied based on the superposition of independent pure ALOHA-based virtual networks corresponding to the available SFs per channel. In [11][17], on the contrary, the performance of a LoRa system was analyzed under the capture effect, i.e., the SIR of a desired signal is above an isolation threshold for successful packet reception. However in [11], only the strongest co-SF interferer was modeled using stochastic geometry. While in [17], the model considered the capture effect with each co-SF interferer separately wherein the channel fading was also ignored. Therefore, the system level performance of a LoRa network under the aggregate effect of both the co-SF interference and inter-SF interference is yet to be modeled and investigated.
I-B Contributions
In this paper, we investigate the scalability of a LoRa network–a multi-annuli single cell system–based on uplink coverage probability under the joint effect of both the co-SF and inter-SF interference. The multi-annuli structure is a simple yet logical scheme for allocating SFs based on their respective signal-to-noise ratio (SNR) thresholds. In addition, it helps to realize the near-far conditions and hence to analyze the impact of inter-SF interference. We apply the tools from stochastic geometry to model the interference field as a Poisson point process (PPP), and include the medium access and control (MAC)- and PHY-layer features and regulatory constraints into the model. Thereon, the key contributions of this paper are summarized as follows:
- •
The SIR distributions are derived in the presence of dominant co-SF interferer, cumulative co-SF interference and inter-SF interference, under a realistic path loss model and channel fading. It is shown how two co-SF interference-based distributions differ; the dominant interferer case, giving an upper bound on success probability, loses its imperviousness to cumulative co-SF interference effects with an increase in device density.
- •
Using SIR distributions, the coverage probability is evaluated. It is shown that co-SF interference causes a major coverage loss in interference-limited scenarios. However due to imperfect orthogonality, inter-SF interference exposes the network for further 15% coverage loss for a small number of concurrently transmitting end-devices.
- •
Coverage probability contours are presented, which accentuate the significance of our analytical models for scalability analysis and also can act as a valuable tool for dimensioning the cell size and node density under medium access and reliability constrains.
- •
How a strategy to allocate SFs to the devices influences the overall network performance is studied using three different SF allocation schemes.
- •
A extension framework for modeling interference in a multi-cell network is formulated based on the presented single-cell model.
The rest of this paper is organized as follows. Section II introduces the LoRa system. Section III presents the network geometry and, signal and channel models. Section IV finds the SNR-based success probability while Section V develops the SIR distributions under interference. Section VI presents numerical results, analyzes the effect of different SF-allocation schemes and gives a framework to extend our model to a multi-cell LoRa network. Finally, Section VII concludes the paper.
II The LoRa System
As an LPWAN solution, the LoRa system consists of two main components: LoRa–a proprietary PHY layer modulation scheme designed by Semtech Corporation [18], and LoRaWAN–the rest of the protocol stack developed, as an open standard, by LoRa Alliance [19]. Fig. 1 summarizes the LoRaWAN architecture and the protocol stack.

II-A LoRaWAN Architecture
A LoRa network provides wireless connectivity analogous to cellular systems but optimized in terms of energy efficiency for IoT-focused applications. The network typically follows a hierarchical or star-of-stars architecture, where the end devices (EDs) are connected via LoRa PHY to one or many gateways. The gateway is then connected to a common network server (NetServer) over standard IP protocol stack. The NetServer is finally connected to an application server (AppServer) over IP. The functionality of each entity is as follows:
- •
End device (ED) supports both the uplink and downlink messages to/from the gateway, generally with a focus on event-triggered uplink transmissions.
- •
Gateway performs relaying of the messages to EDs or NetServer received over LoRa PHY or IP interface. The gateway is transparent to the EDs, which are logically connected to the NetServer.
- •
NetServer handles the overall network management, e.g., resource allocation (such as SF and bandwidth) for enabling adaptive data rate (ADR), authentication of EDs etc.
- •
AppServer is in charge of admitting EDs to the network and taking care of data encryption/decryption.
The LoRa network operates on unlicensed sub-GHz RF bands, which are subject to regulation on medium access duty-cycling or listen-before-talk (LBT) and effective radiated power (ERP). The most common approach for the wireless medium access is the simple ALOHA protocol, which is primarily regulated by the NetServer.
II-B LoRa PHY layer
The LoRa PHY–a derivative of CSS modulation–spreads the data symbols with chirps, where each chirp is a linear frequency-modulated sinusoidal pulse of fixed bandwidth and chirp duration . By varying the chirp duration, quasi-orthogonal signals, acting as virtual channel, can be created. In addition, the chirp duration leads to a tradeoff between the throughput and the robustness against noise and interference. For a fixed , the data symbols are coded by unique instantaneous frequency trajectory, obtained by cyclically shifting a reference chirp. These cyclic shifts, representing symbols, are discretized into multiples of chip-time , while only possible edges in the instantaneous frequency exist. Therefore, each chirp represents bits where is referred to as SF. As a result, the modulation signal, , of th LoRa symbol can be expressed as
where is the rate of frequency increase over symbol duration .
The NetServer can adapt the data rate by changing the bandwidth kHz and , which together relate to chirp duration as . Note that the chirp rate remains the same, and equals to , while the chirp duration (consequently time-on-air) increases drastically with the SF. On the positive side, higher SF yields higher processing gain and thus reduces the target signal-to-noise ratio (SNR) for correct reception at the receiver.
Because of ALOHA-based MAC, two or more signals from EDs using the same or different SFs can overlap in time and frequency. In such cases, the demodulator output can be indistinct depending on the isolation threshold and the processing gain of the SFs. The signals using and can be decoded correctly only if capture effect [20] occurs, i.e., the SIR of the desired signal is above the isolation threshold. The thresholds for two conditions, co-SF interference and inter-SF interference , are given by the SIR matrix [12]
Each element in is the SIR margin that a packet sent at must have in order to be decoded correctly if the colliding packet is sent at .

III System, Signal and Channel Models
III-A System Model
We present the uplink system model for a single LoRa gateway, which takes into account the interference from concurrent uplink transmissions on a desired uplink transmission. The notation used in this paper are summarized in Table I. The system model is as follows:
- •
End devices are spatially distributed in a deployment region , which is a 2-D Euclidean space, according to a homogeneous PPP of intensity (density) , with a gateway located at its origin. The region is a disk of radius and area , and it contains devices which is a Poisson random variable with mean .
- •
Devices make independent decisions to transmit in the uplink using ALOHA. In addition, the devices satisfy the per-frequency band duty cycle constraint of , as per ETSI specifications [19]. Therefore, the set of all transmitting devices at a given time also makes a homogeneous PPP of intensity due to independent thinning of the PPP.
- •
Each device is equipped with an omni-directional antenna, and transmits at a fixed transmission power in a same channel of bandwidth .
- •
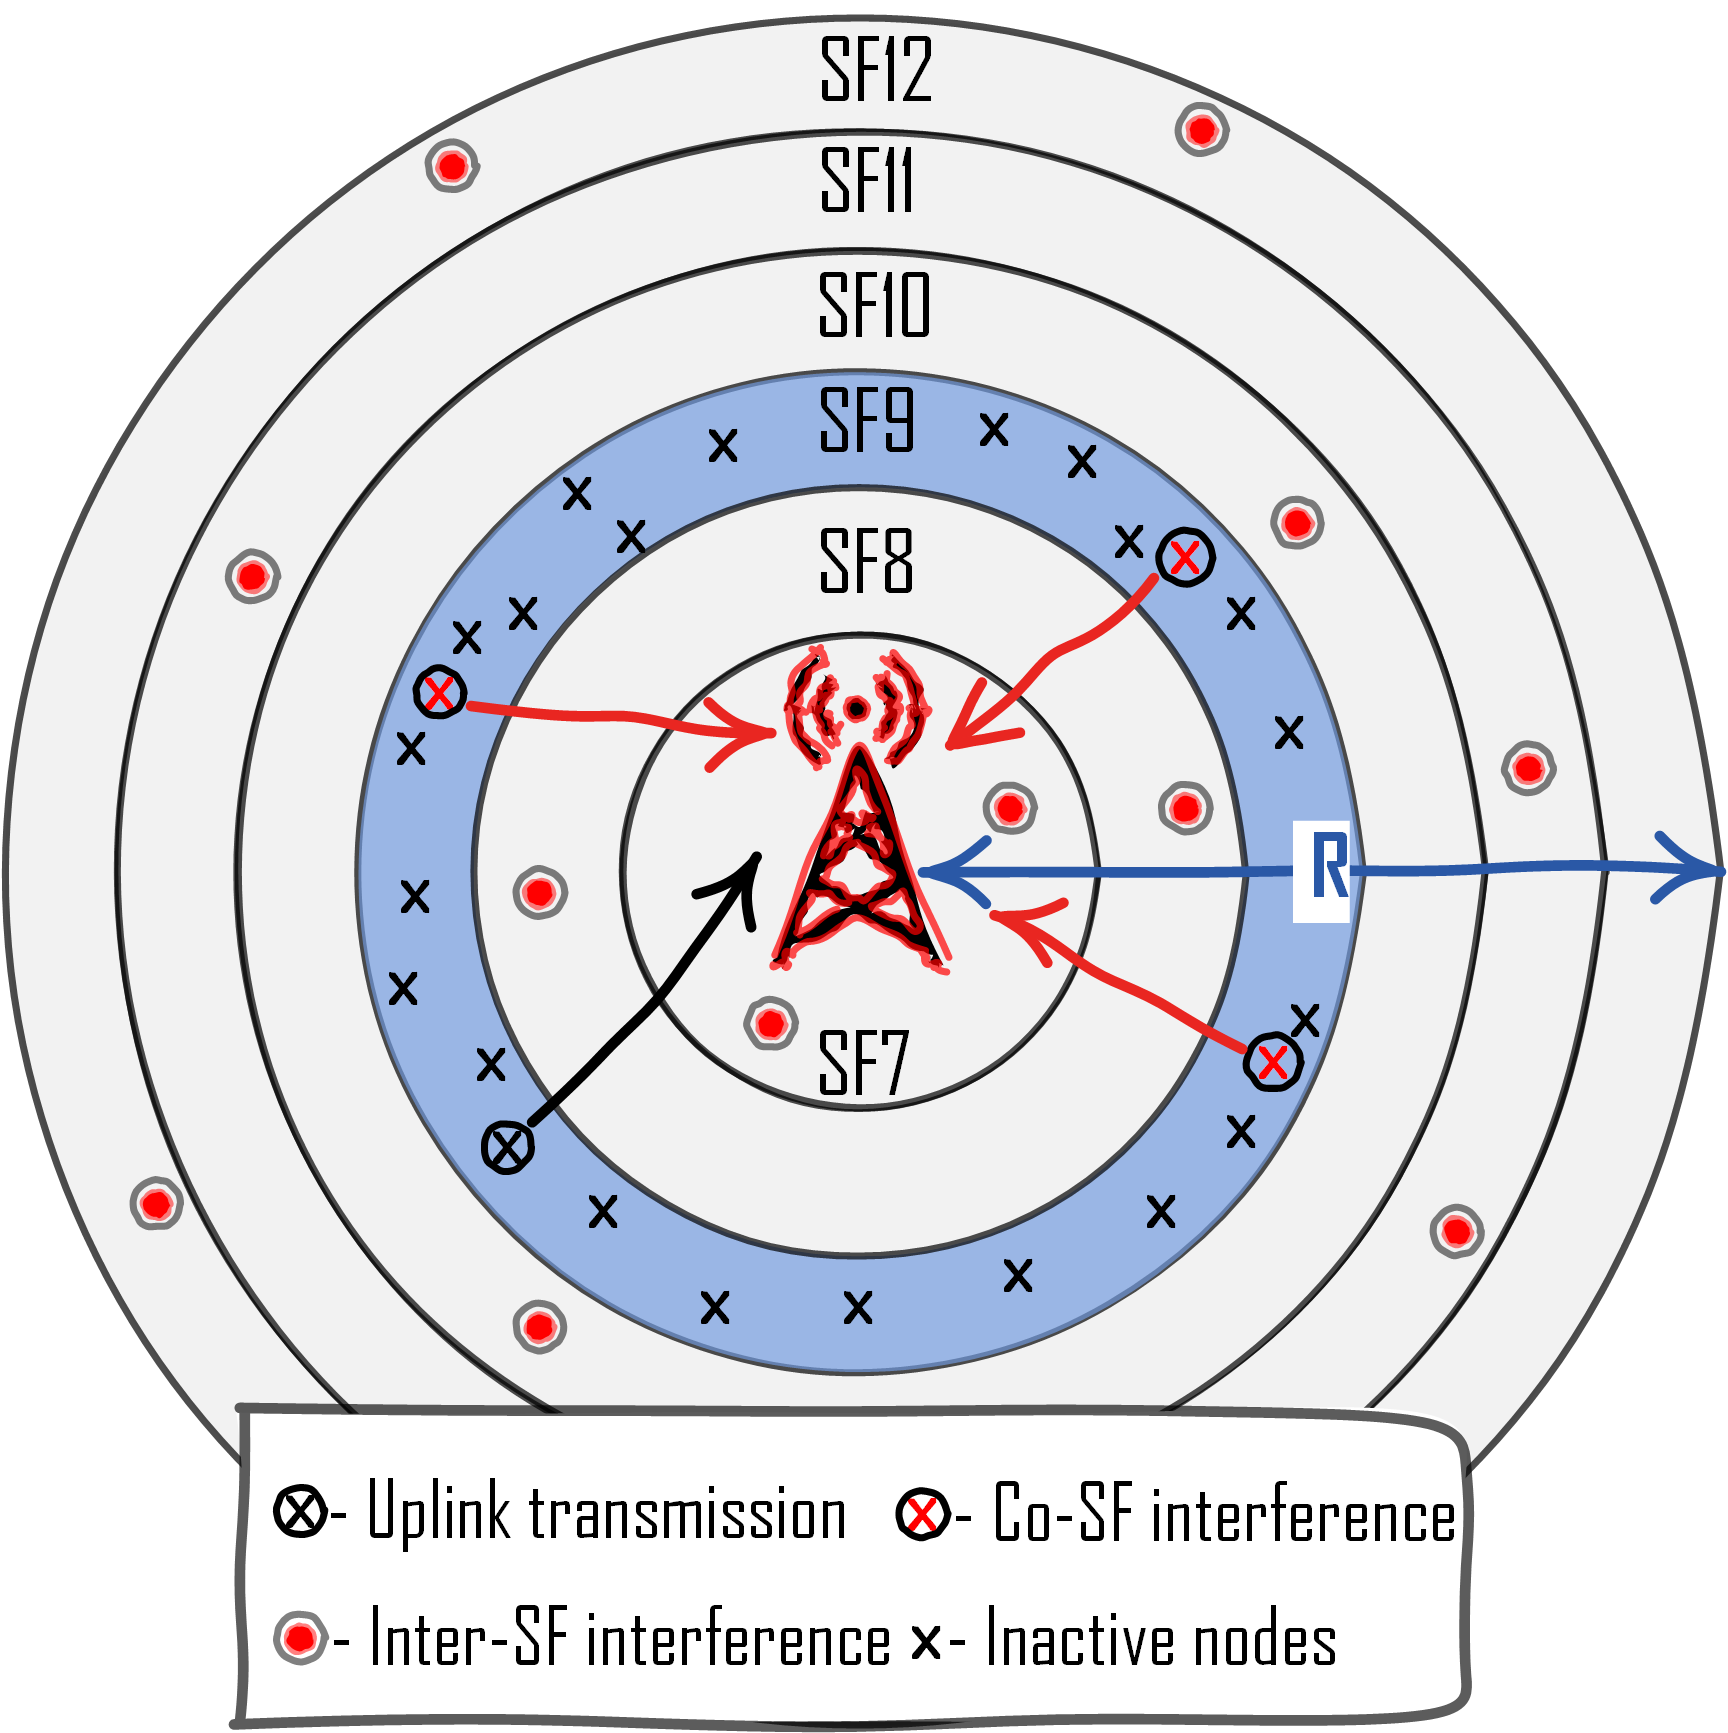
Each device is assigned an SF by the NetServer according to its distance from the gateway. In reality, it can be assigned based on the SNR of the received packets, and the devices in a certain range can use the same SF (see Section VI-C). For simplicity, the network is divided into disjoint annuli of width each, starting at the center and moving outwards. In this case, if are disjoint subsets of , then is the superposition of . The parameter is determined by the cardinality of the set of available SFs, that is, . The annuli set is denoted as , and th () annulus defined by the inner and outer radii and have the same SF, and the area of the th annulus is .
An illustration of a multi-annuli single gateway LoRa network with concurrently active nodes in the regions employing same SF as well as different SFs is shown in Fig. 2(a). The simultaneous same SF transmissions interfere at the gateway to a desired transmission thus resulting in co-SF interference, whereas the inter-SF interference results from concurrent transmissions from all the other regions with devices employing quasi-orthogonal SFs. Note that in realistic signal propagation conditions, the sharp boundaries for SFs allocation as in Fig. 2(a) might not exist. In practice, it is likely to have mixed SNR levels favoring the allocation of two SFs in the same annulus as in Fig. 2(b). However, our mathematical model can easily address any of such network configurations without loss of generality.
| Symbol | Description |
|---|---|
| 2-dimensional Euclidean space | |
| Duty cycle constraint | |
| PPP of EDs, active EDs with intensity | |
| Total number of annuli, set of annuli | |
| Area, width of th annulus | |
| Outer, inner boundary of th annulus | |
| Average number of active EDs in th annulus | |
| Path loss exponent | |
| SNR threshold for an SF | |
| SIR threshold for successful reception of a packet transmitted at under a concurrent transmission at | |
| Fading coefficient of the useful, interfering signal | |
| Channel gain of the useful, interfering signal | |
| Statistical expectation, probability measure | |
| Variance of AWGN noise | |
| Total number of EDs using | |
| Free space path loss of an th ED located at | |
| Indicator function of th ED using | |
| Success probability in AWGN noise | |
| Success probability under dominant co-SF interferer | |
| Success probability under cumulative co-SF interference | |
| Success probability under cumulative co-SF & inter-SF interference | |
| Total interference from concurrently active co-SF EDs | |
| Total interference from concurrently active inter-SF EDs | |
| Laplace transform of | |
| Laplace transform of | |
| Coverage probability with | |
III-B Signal and Channel Model
While focusing on a single end device, we investigate its uplink performance under the simultaneous interfering transmissions originating from co-SF and inter-SF regions. Although the inter-SF transmissions are less disruptive (i.e., requiring less SIR threshold), the impact of inter-SF interference must be taken into account for a realistic analysis. Assume that device located in th annulus intends to communicate with the gateway, and the devices other than act as a set of potential interferers. Let be the desired signal transmitted with spreading factor and experiences block-fading with instantaneous fading coefficient in addition to power-law path loss. The is a zero-mean circularly symmetric complex Gaussian (CSCG) random variable with unit-variance i.e., which corresponds to Rayleigh fading. Similarly, let be the interfering signal from device at over the Rayleigh block-fading channel with fading coefficient . Then the received signal, , under co-SF and inter-SF interference can be expressed as
| (8) |
In this signal model, other than explaining the notations a few remarks are:
- •
is the additive white Gaussian noise (AWGN) with zero mean and variance , where is the noise power density, NF is the receiver design-dependent noise figure, and is the channel bandwidth.
- •
is an indicator function for a device transmitting at , and is the total number of devices using .
- •
is the path loss attenuation function, where is the Euclidean distance in meters between the device and the gateway. From the Friis transmission equation and following a non-singular model [22], we consider , where is the path loss exponent, and is the critical distance to avoid that tends to infinity (i.e., when ). In addition, where is the carrier wavelength.
III-C Performance Metrics
In absence of any interference, the link performance is determined by an SF specific SNR threshold. On the other hand, when co-SF and/or inter-SF transmissions interfere with the desired signal, the performance can be determined by the SF-dependent SIR. In this respect, the cumulative distribution function (CDF) of SNR/SIR is an important measure for characterizing the link performance; that is, for a given SNR/SIR threshold , the CDF gives the link outage probability , whereas the complementary CDF (CCDF) gives the success probability , . If , then
| (9) |
The other important metric, derived from the , is the coverage probability , which is equivalent to the probability that a randomly chosen device achieves the target SNR/SIR threshold . It can be defined as
| (10) |
In this paper, we analyze the uplink performance of a LoRa network based on the derivations of (9) and (10) for the aforementioned network configuration, while considering three interference situations; 1) dominant co-SF interferer–takes into account the interfering power of only the dominant co-SF interfering device, 2) cumulative co-SF interference–considers the impact of cumulative interference from co-SF devices, and 3) cumulative co-SF and inter-SF interference–assumes the joint cumulative interference from co-SF and inter-SF devices.
IV Interference Free Uplink Performance
When considering an interference-free scenario, uplink outage of the useful signal occurs if the SNR of the received signal falls below the threshold, , which depends on the used SF. Let be the channel gain between the device and the gateway, which is an exponential random variable with unit mean i.e., . Then, the instantaneous SNR can be defined from (8) as where is the transmit power of the node. The success probability, as a complement of outage probability, of a device located at distance from the gateway is given by
| (11) |
Note that (11) is independent of the device intensities and , and the threshold remains fixed in an annulus.
V Uplink Performance Analysis in Poisson Field of Interferers
In order to analyze the uplink performance in the presence of concurrent transmissions, we utilize the stochastic geometry which is a powerful tool to model stochastic behavior of a network [23]. Stochastic geometry is based on finding the stochastic average of the interference power by summing over the interfering transmissions in the network. To this end, modeling the interference as a shot noise process is widely used (e.g.,[23]), considering the noise components as Poisson distributed time instants. For a spatial random process, the time instants are replaced with spatial locations of the nodes while the impulse responses associated to the time instants are replaced with the path loss model.
When the duty cycle constrained devices transmit using the same SF, the concurrently active devices within in annulus are reduced significantly. In this respect, it is interesting to relate the effect of interfering power from the dominant interferer to that of the total interference on the success probability of a desired uplink transmission. The success probability under the dominant interferer can be analyzed based on the extreme order statistics [24].
In what follows, we derive the success probabilities considering the dominant co-SF interferer which is built upon [11] for the considered path loss model, as well as the joint impact of cumulative co-SF and inter-SF interference.
V-A SIR Success - Dominant Interferer
We consider the success probability of the desired signal under interfering signals of the same SF, however under the effect of the strongest interferer only. Let us define the strongest interferer , in th annulus, as
| (12) |
then success probability is determined by the condition that the desired signal is times stronger than the dominant interferer
| (13) |
Let , then the success probability under the strongest interferer can be calculated from the order statistics. The CDF of the maximum interferer according to the extreme order statistics is , where is a Poisson distributed random variable with mean , which is the expected number of concurrently transmitting interferers from an annulus of area . If is the probability mass function of , then from the total probability theorem, the order statistics in a sample of random size determines as
| (14) |
By using the series representation , and taking expectation over channel gain , the success probability from (13) can be determined as
| (15) |
where is the CDF of product distribution [25] of the probability density function (PDF) of and . The distance distribution of the devices to the gateway in th annulus with boundaries and area is . Thus, for the considered path loss model, the probability density function (PDF) of is defined over , and is
| (16) |
where is the upper incomplete gamma function [26].
V-B SIR Success - Cumulative Interference
In this section, we perform the SIR based outage or success probability analysis of the desired signal subjected to aggregate co- and inter-SF interference. The objective is to find how cumulative interference, as apposed to the dominant interferer, affects the performance considering the dominant interferer analysis to be an upper bound on the outage.
V-B1 SIR Success under Co-Spreading Factor Interference
The SIR experienced by the desired signal, from the th annulus, at the gateway under concurrent co-SF interference is
| (17) |
Let be the threshold needed for the desired signal at SFi against interferers using the same SFi, then the condition for success probability can be expanded as
| (18) |
where (a) in (18) follows from . Also in (b), is the Laplace transform (LT) at of the cumulative interference power , which can be evaluated with the probability generating functionals (PGFLs). Using the LT definition, from (17) and (18) we have
| (19) |
where the expectation is over the point process and channel gain . The expectation with respect to can be moved inside, as is independent from the PPP. Then, using the moment generation function of exponential random variable with in (19) yields
| (20) |
By using the PGFL of homogeneous PPP [23] with respect to the inner function of (20) i.e., for any no-negative function , we have
| (21) |
Finally, the transformation of Cartesian to polar coordinates gives
| (22) |
where and are the inner and outer boundaries of the th annulus. Replacing gives the success probability of a zero-noise network i.e., for an interference-limited case.
V-B2 SIR Success under Inter-Spreading Factor Interference
When inter-SF interference is considered, the outage occurs when the SIR of the desired signal of goes below the threshold (see SIR matrix (II-B)) when the concurrent transmissions of quasi-orthogonal SFs are interfering. Let the device transmitting the useful signal be located in the th annulus, then concurrent transmissions with orthogonal SFs will originate from annuli i.e., all the annuli except th annulus and SIR can be defined as
| (25) |
However, the desired signal has a different SIR margin with respect to the interfering transmissions from each annulus. As all annuli are disjoint, from the independence of PPP, the success probability of the desired transmission in the th annulus under inter-SF interference, originating from annuli, can be determined from (18) as,
| (26) |
where is the LT of cumulative inter-SF interference power at which can be found from (19)-(22)
| (27) |
where is defined in (24).
V-B3 SIR outage under Co- and Inter-SF Interference
V-C Coverage Analysis
Based on the analyzed success probabilities, , from (10) the coverage probability can be determined by averaging over the distance distribution of , as
| (29) |
Using the PDF of the distance of a uniformly distributed random devices within the area , the coverage probability for the assumed geometry of the LoRa network, from (29), is
| (30) |
VI Results and Discussion
In this section, we validate the analytical models for success probability and network coverage through Monte Carlo simulations. In the simulation setup, the devices are distributed in a disk of radius according to a homogeneous PPP of intensity , where is the average number of devices. The disk is divided into disjoint annuli of equal width (unless specified otherwise), where is the number of available SFs. To calculate the success probability of a desired uplink transmission at the gateway, we move the node location from the inner to the outer radius of an annulus with a minimal fixed step size. At each location, the success of the desired transmission is evaluated for two conditions: 1) the SNR of the useful signal is above the SF-dependent SNR threshold, 2) the SIR of the same signal exceeds the SIR threshold under simultaneously active devices causing co-SF and inter-SF interference. The set of concurrently transmitting devices is determined by the duty cycle parameter . Then, we find the success probability at each distance as expected frequency over independent realizations of nodes’ distribution. Similarly, we find the coverage probability with respect to under noise and the considered interference conditions.
The matching of the numerical and simulation results demonstrates the accuracy of the developed models. The parameters used to obtain the results are given in Table II while the allocation of SFs in a single-cell multi-annuli network is based on Table III, where the SF-dependent SNR thresholds are from [10]. The SIR thresholds are given in SIR matrix (II-B).
VI-A Success Probability
In Fig. 3, the success probability of the assumed LoRa network for the studied SNR- and SIR-based conditions is shown for two different cell sizes; km in Fig. 3(a) and km in Fig. 3(b). The curve from (11) shows that the success probability decreases with respect to the distance from the gateway due to path loss and fading. It is however interesting to note how success probability improves at the annuli transitions (e.g., at km for km) with the use of higher SFs. The gain in the performance is due to the lower receiver sensitivities and hence the lower required SNRs for higher SFs. As a result, a higher SF yields a positive performance jump at the inner boundary of each annulus and the multi-annuli allocation of SFs gives a saw-tooth trend to the interference-free success probability. Note that the gain depends on the SF-dependent SNR threshold and on the strategy to allocate SFs. In these results, we assume an equal-interval based annuli structure as described in Sec. III-A, where the EDs in the inner most annulus use the lowest SF and the SFs’ strength increases for the outer annuli.
When it comes to study the network performance under self-interference, we use three SIR based metrics: strongest co-SF interferer (), aggregate co-SF interference () and aggreagte co-SF and inter-SF interference (). The respective curves obtained from (15), (22) and (27) are shown in Fig. 3. From these results, we can make the following remarks:
| Parameter | Symbol | Value |
|---|---|---|
| Signal bandwidth | kHz | |
| Carrier frequency | MHz | |
| Noise power density | dBm/Hz | |
| Noise figure | NF | dB |
| Transmit power | dBm | |
| Duty cycle | % 11 1 Note that as per ERC Recommendation 70-03 [27], the duty cycle limitation of % is on the whole h1.4 frequency band of EU 868.0 - 868.6 MHz. Therefore for signal bandwidth of 125 kHz, there can be 3 channels in total and it is per-channel duty cycle limitation. | |
| Pathloss exponent | ||
| Annulus | SF | SNR thresh. () | Range |
|---|---|---|---|
| (dB) | (m) | ||
| 1 | 7 | ||
| 2 | 8 | ||
| 3 | 9 | ||
| 4 | 10 | ||
| 5 | 11 | ||
| 6 | 12 | ||
- •
In general, the saw-tooth trend in the success probability curves, produced by the ED switching to a higher SF region, is observed in all the considered interference conditions, although less prominent compared to non-interference case. This small gain can be attributed to the relative location of the ED at the inner boundary of the annulus compared to the co-SF interfering EDs, thus making it more probable for the ED to achieve an SIR of at least 1 dB. Despite the small gain, the success probability decreases with the distance from the gateway due to increase in number of EDs causing co-SF and/or inter-SF interference.
- •
At annuli boundaries, the small gain in , and is determined by the co-SF and/or inter-SF based SIR thresholds in addition to the SF allocation strategy.
- •
The success probability under cumulative co-SF interference (), modeled as a shot-noise process, follows the success probability obtained under dominant interferer (). In fact, serves as an upper bound but it loses its tightness for higher SFs annuli because the number of EDs is proportional to the area of an annulus and hence the impact of cumulative interference increases.
- •
The inter-SF interference can cause up to 15% loss in the success probability () as compared to co-SF interference only, which is significant enough to be taken into consideration in a realistic scalability analysis.
The SNR- and SIR-based performance indicators must be observed together to understand the dominant cause of the performance degradation. Although in very dense deployment scenarios, the interference can be a main cause of drop in the performance. However considering the cell size, limited transmit power of EDs and signal propagation conditions, the impact of background noise must also be accounted for. As can be observed from Fig. 3, the impact of interference on the success probability dominates for a cell of radius km (see Fig. 3) while for km the impact of noise is more than the interference (see Fig. 3). In essence, as is the same for both cell sizes, we observe that the relative impact of the interference on the desired transmission remains the same. However, the success probability under noise is degraded more in Fig. 3 due to a bigger cell size. The overall impact can be deduced based on the joint success probability by multiplying with .
VI-B Coverage Probability

We also evaluate the network coverage probability, , under the studied success probabilities i.e., using (30), which is shown in Fig. 4. These results depict the scalability of a LoRa network with an increasing number of EDs for two cell size; km in Fig. 4(a) and km in Fig. 4(b). The coverage results can give important guidelines for network dimensioning.
Fig. 4, any subplot, shows that the SNR- based coverage probability () is constant as it is independent of the number of EDs. In essence, it gives the noise-only coverage characteristics with respect to cell size. On the other hand, SIR-based coverage probabilities, i.e., , and , decrease exponentially with the increase in EDs. This diminishing performance is the direct result of the increasing co-SF and inter-SF interference, which together make it less likely for the desired signal to achieve the desired SIR protection. From any of these subfigures, it can observed that the coverage probability under dominant co-SF interferer only () is optimistic compared to the one given by aggregate co-SF interference (). gives an upper bound on co-SF interference and it reduces its tightness with the increase in the device density. In comparison to , the coverage probability under both the co-SF and inter-SF () has a larger decay constant. As a result, decreases much faster with respect to the number of EDs, and the imperfect orthogonality together with same SF interference can have up to 15% lower coverage probability than the same SF case only for 1500 devices per LoRa channel.
The impact of cell size on the coverage probability can be observed from Fig. 4(a) and Fig. 4(b). The coverage probability under noise , although independent of device density, changes proportionally to the cell size. Whereas, the SIR-based coverage probabilities remain invariant to the change in the cell size because the relative sum interference remains the same for a given . How noise and interference together limit the scalability of a LoRa network can be observed from the joint coverage probability curves in Fig. 4(a) and Fig. 4(b). From these results, it can be concluded that if an EDs achieves full coverage in absence of any interference, the coverage probability under both the co-SF and inter-SF interference mainly determines the network scalability with an increasing number of EDs.
Fig. 5 shows the contour of joint coverage probability for possible channel configurations of a LoRa network with respect to duty cycle and transmit power. These settings correspond to h1.4, h1.5 and h1.6 subbands of ERC recommendations [27], and can serve as a useful indicator for network dimensioning. For example, if a smart application, such as smart metering, requires a certain coverage probability which translates directly into quality of service, then for a given cell radius, the number of EDs operating on a frequency can be determined or suggested. Fig. 5(a) and Fig. 5(b) show that as the duty cycle increases, the number of devices that can achieve a certain coverage probability with a given cell size decreases significantly. On the other hand, Fig. 5(c) shows that the cell radius increases at dBm. However due to the 10% permitted duty cycle, the impact of interference under concurrent transmissions becomes severe, which in turn reduces the maximum number of EDs drastically.
VI-C SF Allocation Strategies
So far, our scalability analysis assumes equal-width annuli for SFs’ allocation, which we refer to as equal-interval-based (EIB) scheme. To analyze how an SF allocation scheme influences the network performance, we compare EIB with two additional SF allocation strategies, namely equal-area-based (EAB) [28] and path-loss-based (PLB) [29, 30] schemes. The EAB scheme uses equal-area annuli while PLB defines annuli based on a path loss model and the SF-specific SNR thresholds. Using the path loss model, the PLB scheme calculates the SNR with respect to the distance. The distance at which SNR falls below the threshold for the lowest SF defines the outer boundary of the annulus, and the higher SF’s allocation begins from that boundary and so on.
The annuli parameters for each scheme can be determined from Table IV. For PLB scheme, the path loss model is defined in Sec. III-B and the SF-specific thresholds are given in Table III. The success and coverage probabilities obtained under these schemes are compared in Fig. 6. A common cell radius km, determined by PLB strategy, is used that corresponds to the maximum distance at which the required SNR for the highest SF is satisfied.
| Parm. | EIB | EAB | PLB |
| Width | |||
| Area | — | — | |
The SNR-based success probability (Fig. 6 (a)) for EIB scheme is mostly higher than that for PLB and EAB schemes except at the cell boundary, where the same SF is utilized by each scheme, it becomes equal. Both PLB and EAB select a higher SF at a distance higher than EIB scheme, and this lag results into higher drop in their success probabilities. On the other hand, interesting observations can be made for SIR-based (with co-SF and inter-SF interference) success probability (see Fig. 6(b)): a) compared to EIB, the higher area–implying higher number of co-SF interferers–and higher width–meaning more pronounced near-far conditions–of the first PLB and EAB annuli causes more performance loss, b) the success probability for PLB improves for the subsequent annuli in comparison with EIB due to small-area annuli, c) the effect of EAB scheme is unusual; it causes performance drop up to a certain distance and then performance improves, mainly due to geometrical structure of EAB annuli. As the width of an outer annulus is less than an inner annulus, the near-far condition in each outer annulus is pronounced less. Therefore, after a certain annuli, the probability to achieve co-SF SIR-target at the gateway increases as compared to the previous annulus.
Fig. 6(c) reflects the mentioned drop in success probability under PLB and EAB schemes at low SF regions on the joint coverage probability. The coverage probability for EIB scheme remains higher than the other two. We also observed (not shown here) that by adding a fading margin in PLB scheme, essentially by reducing the cell size, only brings the coverage results closer for the studied SF allocation schemes.
VI-D Modeling a Multi-Cell LoRa Network
In this study, interference modeling of an elemental single-cell LoRa system revealed useful scalability results. In particular, the coverage contours show how to dimension a cell with respect to its size and the number of devices, while the numbers are not that optimistic especially if the required QoS is high. However, in practical applications, the coverage demand is expected to span over a large geographical area. As a result, a LoRa network will consist of multiple cells to satisfy the coverage and QoS requisites. In this respect, interference modeling of a multi-cell network is essential which we discuss below based on our proposed approach.
In smart city applications, the devices are usually clustered with centers at the parent points i.e., the gateways. Therefore, a clustering process must be defined for interference modeling of a multi-cell network. A well-known spatial point process to model the distribution of the gateways is Poisson cluster process, where the gateways form a PPP and the devices within each cluster form an independent PPP [31]. Next, using the joint success probability under noise, intra-cell and inter-cell interference, we see how the clustering process affects the analysis.
Let and denote the LT of intra-cell interference from –the reference cell, and inter-cell interference, respectively. Then, in a multi-cell network, the success probability of a device located at in th annulus of is
| (31) |
where the first term is as in (11) while the second term is the given in (28) under co-SF interference (i.e., ) and inter-SF interference in a cell. Whereas, the last term considers the impact of interference from all the other cells on the success probability.At , under the PPP distribution of the gateways can be defined as
| (32) |
where is the distance between the reference gateway and the device in annulus of cell , and is the channel gain of the same device.
To evaluate (32) where the expectation over remains the same (see (20)), one need to consider the distance distribution of and the clustering process of the ’gateways’ to find the expectation over and respectively, which we leave as a future work.
VII Conclusions
In this paper, we investigated the impact of interference on a LoRa network caused by simultaneous transmissions using the same SF as well as different SFs. While, the co-SF interference is natural and requires SIR protection to have any benefits from capture effect, the imperfect orthogonality among SFs can also cause a significant impact in high-density deployment of devices. To this end, using stochastic geometry to model the interference field, we derived the SIR distributions to capture the uplink outage and coverage performance with respect to the distance from the gateway. The SIR distributions are derived based on the aggregate co-SF and inter-SF interference power. The results obtained by comparing the aggregate co-SF interference alone to the corresponding upper bound based on dominant interferer, defy the validity of the argument- LoRa is impervious to the cumulative interference effects[11]- which is shown here to be dependent on the device density. Moreover, our analysis reveals that the network scalability under the joint impact of co-SF and inter-SF interference is more accurate compared to the optimistic results usually reported when considering co-SF alone. We showed in a LoRa frequency channel only a limited number of devices can successfully transmit, otherwise the devices would waste energy in retransmissions of collided packets. In particular, for higher SFs this effect is more noticeable due to lower success probability. We summarized the usefulness of our analytical models for: a) network dimensioning under reliability constraints using contour plots for three baseline LoRa channel settings, b) interference modeling of a multi-cell LoRa network. In addition, we analyzed the network performance for three SF allocation schemes and showed that a simple equal-width-based scheme yields better results than the equal-area- and path loss-based schemes.
References
- [1] M. Centenaro, L. Vangelista, A. Zanella, and M. Zorzi, “Long-range communications in unlicensed bands: The rising stars in the IoT and smart city scenarios,” IEEE W. Commun., vol. 23, no. 5, pp. 60–67, Oct 2016.
- [2] G. A. Akpakwu, B. J. Silva, G. P. Hancke, and A. M. Abu-Mahfouz, “A survey on 5G networks for the Internet of Things: Communication technologies and challenges,” IEEE Access, vol. 6, 2018.
- [3] A. D. Zayas, C. A. G. Pérez, Á. M. R. Pérez, and P. Merino, “3GPP evolution on LTE connectivity for IoT,” in Integration, Interconnection, and Interoperability of IoT Systems. Springer, 2018, pp. 1–20.
- [4] U. Raza, P. Kulkarni, and M. Sooriyabandara, “Low power wide area networks: An overview,” IEEE Commun. Surveys Tut., vol. 19, no. 2, pp. 855–873, 2017.
- [5] F. Adelantado, X. Vilajosana, P. Tuset-Peiro, B. Martinez, J. Melia-Segui, and T. Watteyne, “Understanding the limits of LoRaWAN,” IEEE Commun. Mag., vol. 55, no. 9, pp. 34–40, 2017.
- [6] N. Varsier and J. Schwoerer, “Capacity limits of LoRaWAN technology for smart metering applications,” in IEEE ICC, May 2017, pp. 1–6.
- [7] S. Tripathi and S. De, “An efficient data characterization and reduction scheme for smart metering infrastructure,” IEEE Trans. Ind. Informat., vol. PP, no. 99, pp. 1–1, 2018.
- [8] D. Alahakoon and X. Yu, “Smart electricity meter data intelligence for future energy systems: A survey,” IEEE Trans. Ind. Informat., vol. 12, no. 1, pp. 425–436, Feb 2016.
- [9] V. C. Gungor, D. Sahin, T. Kocak, S. Ergut, C. Buccella, C. Cecati, and G. P. Hancke, “A survey on smart grid potential applications and communication requirements,” IEEE Trans. Ind. Informat., vol. 9, no. 1, pp. 28–42, Feb 2013.
- [10] Semtech, “LoRa modulation basics, AN1200.22,” Revision 2, May 2015.
- [11] O. Georgiou and U. Raza, “Low power wide area network analysis: Can LoRa scale?” IEEE W. Commun. Lett., vol. 6, no. 2, pp. 162–165, 2017.
- [12] D. Croce, M. Gucciardo, S. Mangione, G. Santaromita, and I. Tinnirello, “Impact of LoRa imperfect orthogonality: Analysis of link-level performance,” IEEE Commun. Lett., vol. PP, no. 99, pp. 1–1, 2018.
- [13] M. C. Bor, U. Roedig, T. Voigt, and J. M. Alonso, “Do LoRa low-power wide-area networks scale?” in Proc. of ACM MSWiM, 2016, pp. 59–67.
- [14] A. Augustin, J. Yi, T. Clausen, and W. M. Townsley, “A study of LoRa: Long range & low power networks for the internet of things,” Sensors, vol. 16, no. 9, 2016.
- [15] F. V. den Abeele, J. Haxhibeqiri, I. Moerman, and J. Hoebeke, “Scalability analysis of large-scale LoRaWAN networks in ns-3,” IEEE IoT J., vol. 4, no. 6, pp. 2186–2198, Dec 2017.
- [16] K. Mikhaylov, J. Petaejaejaervi, and T. Haenninen, “Analysis of capacity and scalability of the LoRa low power wide area network technology,” in 22th European Wireless Conference, May 2016, pp. 1–6.
- [17] D. Bankov, E. Khorov, and A. Lyakhov, “Mathematical model of LoRaWAN channel access with capture effect,” in IEEE PIMRC, Oct 2017, pp. 1–5.
- [18] O. B. Seller and N. Sornin, “Low power long range transmitter,” Feb. 2016, US Patent 9,252,834.
- [19] N. Sornin and A. Yegin, “LoRaWAN 1.1 Specification,” LoRa Alliance, Oct 2017.
- [20] C. H. Liao, G. Zhu, D. Kuwabara, M. Suzuki, and H. Morikawa, “Multi-hop LoRa networks enabled by concurrent transmission,” IEEE Access, vol. 5, pp. 21 430–21 446, 2017.
- [21] ATDI, “LoRa simulation using ATDIs RF solution,” http://www.atdi.com/wp-content/uploads/2016/07/LoRa.pdf, accessed: Jan 2018.
- [22] M. Aljuaid and H. Yanikomeroglu, “Investigating the Gaussian convergence of the distribution of the aggregate interference power in large wireless networks,” IEEE Trans. Vehi. Tech., vol. 59, no. 9, pp. 4418–4424, 2010.
- [23] M. Haenggi and R. K. Ganti, “Interference in large wireless networks,” Foundations and Trends in Networking, vol. 3, no. 2, pp. 127–248, 2009.
- [24] S. Kotz and S. Nadarajah, Extreme Value Distributions: Theory and Applications. World Scientific, 2000.
- [25] V. K. Rohatgi and A. M. E. Saleh, An Introduction to Probability and Statistics. John Wiley & Sons, 2015.
- [26] I. S. Gradshteyn and I. M. Ryzhik, Table of Integrals, Series, and Products. Academic press, 2014.
- [27] ERC Recommendation 70-03, “Relating to use of short range devices,” Oct 2017.
- [28] J. T. Lim and Y. Han, “Spreading factor allocation for massive connectivity in LoRa systems,” IEEE Commun. Lett., vol. 22, no. 4, pp. 800–803, Apr 2018.
- [29] J. Haxhibeqiri, F. Van den Abeele, I. Moerman, and J. Hoebeke, “LoRa scalability: A simulation model based on interference measurements,” Sensors, vol. 17, no. 6, p. 1193, 2017.
- [30] D. Bankov, E. Khorov, and A. Lyakhov, “Mathematical model of LoRaWAN channel access,” in IEEE WoWMoM, Jun 2017, pp. 1–3.
- [31] R. K. Ganti and M. Haenggi, “Interference and outage in clustered wireless ad hoc networks,” IEEE Trans. Inf. Theory, vol. 55, no. 9, pp. 4067–4086, Sept 2009.