Confirmation of the link between central star binarity and extreme abundance discrepancy factors in planetary nebulae
Abstract
It has recently been noted that there seems to be a strong correlation between planetary nebulae with close binary central stars, and highly enhanced recombination line abundances. We present new deep spectra of seven objects known to have close binary central stars, and find that the heavy element abundances derived from recombination lines exceed those from collisionally excited lines by factors of 5–95, placing several of these nebulae among the most extreme known abundance discrepancies. This study nearly doubles the number of nebulae known to have a binary central star and an extreme abundance discrepancy.
A statistical analysis of all nebulae with measured recombination line abundances reveals no link between central star surface chemistry and nebular abundance discrepancy, but a clear link between binarity and the abundance discrepancy, as well as an anticorrelation between abundance discrepancies and nebular electron densities: all nebulae with a binary central star with a period of less than 1.15 d have an abundance discrepancy factor exceeding 10, and an electron density less than 1000 cm-3; those with longer period binaries have abundance discrepancy factors less than 10 and much higher electron densities. We find that [O ii] density diagnostic lines can be strongly enhanced by recombination excitation, while [S ii] lines are not.
These findings give weight to the idea that extreme abundance discrepancies are caused by a nova-like eruption from the central star system, occuring soon after the common-envelope phase, which ejects material depleted in hydrogen, and enhanced in CNONe but not in third-row elements.
Keywords:
planetary nebulae: general – circumstellar matter – stars: mass-loss – stars: winds, outflows – binaries: close – ISM: abundances1 Introduction
The abundance discrepancy problem in ionized nebulae was first observed over 70 years ago, when Wyse (1942) found, with primitive atomic data and measurements from photographic plates, that the abundance of oxygen calculated from emission lines formed by recombination exceeded that calculated from lines formed by collisional excitation by large factors in the planetary nebulae (PNe) NGC 7009 and NGC 7027. Subsequent improvements in observational techniques and atomic data calculations confirmed that this discrepancy was real. Its magnitude is now known to be typically of the order of 2-3 in planetary nebulae (Tsamis et al. 2004, Wesson et al. 2005, García-Rojas et al. 2013), but reaching 2–3 orders of magnitude in the most extreme cases – e.g. 70–80 in Hf 2–2 (Liu et al. 2006b), 150–300 in Abell 46 (Corradi et al. 2015, and 700 in Abell 30 (Wesson et al. 2003).
Mechanisms proposed for the discrepancy include temperature fluctuations in a chemically homogeneous gas (Peimbert 1967), abundance gradients (Torres-Peimbert et al. 1990), density fluctuations (Viegas & Clegg 1994), X-ray illumination of quasi-neutral material (Ercolano 2009), hydrogen-deficient clumps (Liu et al. 2000), non-thermal electron energy distributions (Nicholls et al. 2012) and most recently resonant temperature fluctuations caused by varying ionization fields in nebulae with binary central stars (Bautista & Ahmed 2017). Strong indirect evidence for hydrogen-deficient material has been found in a number of objects, and such material is directly observed in a small number of unusual planetary nebulae such as Abell 30 (Wesson et al. 2003) and Abell 58 (Wesson et al. 2008).
Surveys aimed at determining the binary fraction of PN central stars have in recent years revealed binaries inside planetary nebulae with periods of hours or days, which would have placed the companion inside the Asymptotic Giant Branch (AGB) progenitor (e.g. Miszalski et al. 2009a, De Marco et al. 2013, Jones & Boffin 2017). These indicate that the nebula was ejected in a common envelope phase. Corradi et al. 2015 pointed out that several of the nebulae with the most extreme abundance discrepancies were post-common envelope nebulae, suggesting that the two phenomena were linked. Further support for this scenario was obtained by Jones et al. (2016), who studied the planetary nebula NGC 6778, and confirmed the prediction of a high abundance discrepancy based on its central star being a binary system with a period of 3.7 h; the measured abundance discrepancy factor (adf) was 18 in an integrated spectrum, and a spatial analysis showed that it peaked at over 40 close to the central star. With a clear association between binarity and extreme recombination line abundances, one can ask whether binarity is a necessary, sufficient and unique condition for an extreme abundance discrepancy.
Here we present the results of a study in which we investigate this question, by measuring new chemical abundances in a sample of nebulae known to host close binary central stars. Before the current work was carried out, nine nebulae with a confirmed short period (10 d) binary central star had had their abundances determined from recombination lines, out of a total of nearly 150 nebulae for which the abundance discrepancy has been measured. 2 had a “normal" adf, 2 had an “elevated" adf, and 5 had an “extreme" adf11 1 Throughout this paper, we consider an adf5 to be “normal”, a value between 5 and 10 to be “elevated”, and values greater than 10 to be “extreme” With studies in recent years having revealed close binaries in a number of planetary nebulae, we targeted objects known to have binary central stars, with the aim of further investigating the link between the two phenomena and building a statistically useful sample of binary objects with well-determined chemistries. We have identified six new objects that have both an elevated or extreme abundance discrepancy and a close binary central star. We describe our observations in Section 2, our line measurements in Section 3, and abundance analysis in Section 4.
2 Sample selection and observations

We obtained observations of 42 planetary nebulae in ESO programmes 093.D-0038(A) and 096.D-0080(A). The nebulae in our sample were southern hemisphere objects selected from a list of PNe with close binary central stars22 2 http://www.drdjones.net/bCSPN. The sample included Hf 2-2, already known to exhibit an extreme abundance discrepancy (Liu et al. 2006), both as an opportunity to check our methodology and the quality of our observations, and to permit a spatially resolved study of the object. For all the other objects in the sample, there were no previously published recombination line abundances.
The observations were carried out during service time with the FORS2 instrument mounted on the ESO VLT’s UT1 Antu telescope (Appenzeller et al., 1998). The programmes were designated as filler programmes, designed to be performed under any conditions, including periods of bad weather (seeing greater than 2" and/or clouds). Because of this, a number of our targets were observed during times of poor seeing and transparency, and nebular emission was sometimes only very weakly detected. We detected strong recombination line emission in 8 objects, while in 20 objects, the spectra were deep enough to obtain collisionally excited line abundances but not recombination line abundances. In 14 objects, no abundances could be measured. The effect of sub-optimal conditions on our observations is further discussed in Section 4.
The instrument set-up consisted of a long slit measuring 0.7″6.8′, and a mosaic of two 4k2k MIT/LL CCDs binned 22 (0.25 arcsec per pixel). The slit was orientated along the major axis of the nebula, where images were available to determine this, and north-south otherwise. For all objects, a single exposure was taken using the GRIS_1200B grism, followed by a further exposure with the GRIS_1200R grism and GG435 filter (in the case of those objects observed during period P93 as part of programme 093.D-0038(A)) or the GRIS_600RI and GG435 filter (in the case of objects observed during period P96 as part of programme 096.D-0080(A)), resulting in a resolution of 1.5–3Å across the observed wavelength range of 3600–5000Å and 5800–7200Å/5010–8300Å (GRIS_1200R/GRIS_600RI), for the blue and red grisms respectively. A log of the observations is shown in Table 7.
3 Data reduction and analysis
The two-dimensional spectra were bias subtracted, wavelength calibrated and flux calibrated against exposures of standard stars taken using the same set-up (as part of the standard ESO calibration plan), all using standard starlink routines (Shortridge et al., 2014; Warren-Smith et al., 2014). Cosmic ray removal was achieved using a combination of starlink’s figaro routines and a python implementation of the LAcosmic algorithm (van Dokkum, 2001). The spectra were then sky subtracted and extracted to one-dimensional spectra. The nebular windows for the extraction are indicated in Figure 1; we excluded a region around the central star when the star was bright enough to potentially contaminate the nebular spectrum.
Emission line fluxes were measured using the automated line-fitting algorithm, alfa (Wesson, 2016), which has been used by Jones et al. (2016) and Sowicka et al. (2017) to perform similar analyses for the high adf PN NGC 6778 and low adf PN IC 4776 respectively. alfa derives fluxes by optimizing the parameters of Gaussian fits to line profiles using a genetic algorithm, after subtracting a globally fitted continuum. The observed and dereddened fluxes for each object, along with their 1 uncertainties, are given in the Appendix in section A. alfa calculates uncertainties from the RMS of the residuals after subtracting the fitted lines and continuum from the observations, and does not include any contribution from systematic uncertainties, such as those originating from the flux calibration. As such, the quoted uncertainties are lower limits. alfa calculates the spectral resolution, and reports lines as blended if they are separated by less than the half width at half-maximum at the calculated resolution. Figure 2 shows the fits for the objects with prominent recombination line spectra, in the region around 4650Å where there are numerous recombination lines. The complete list of measured emission lines for each object is given in Appendix A.

4 Physical conditions and abundances
The code neat (Wesson et al., 2012, Nebular Empirical Analysis Tool;) was then used to derive final ionic and elemental abundances from these emission line fluxes. neat corrects for interstellar extinction using the flux-weighted ratios of H and H to H and the Galactic extinction law of Howarth (1983). The H/H ratio was not used to calculate the extinction but rather as a check to ensure that line fluxes measured from the non-overlapping red and blue spectra were consistent. In a few objects, we scaled the red spectrum such that the extinction derived from H was consistent with the values from H and H. The corrections applied were up to 22%. The necessity for such corrections may arise from several factors. First, for many of our observations, the object was reacquired between red and blue exposures, resulting in a small shift in the position of the slit (see Jones et al. 2016 for details of this in relation to NGC 6778). Second, due to the filler nature of our programme, many targets were observed in poor conditions. This may have given rise to variation in the sky transparency between red and blue spectra, while changing seeing conditions could also result in red and blue spectra experiencing differing degrees of slit losses. For example, Hf 2-2 was observed on the night of 2014-06-19, with the blue spectrum starting at 07:08:22UT, and the red spectrum starting at 07:29:54UT. Archived data for Paranal from ESO’s Astronomical Site Monitor33 3 http://www.eso.org/asm show that the seeing during the blue exposure varied between 1.1 and 1.8 arcsec, while during the red exposure it exceeded 2 arcsec. Although these measurements overestimate the actual image quality44 4 Seeing measurements at Paranal are recorded by a Differential Image Motion Monitor (DIMM), which measures a larger seeing than measured by the VLT Unit Telescopes, due to a turbulent surface layer at the observatory site that the DIMM is exposed to but the UTs are not (Sarazin et al. 2008), they indicate that variations in slit losses between red and blue exposures are very likely to have occurred.
This rescaling has only a small effect on our results and does not affect any of our conclusions. Temperatures derived from He i lines depend on the ratio of lines in the red spectra to lines in the blue, while abundances of N+, S+ and Ar2+ are derived from lines in the red spectra only. These measurements are thus affected by the scaling, which may introduce an additional uncertainty into their values.
We determined the physical conditions in our sample nebulae from traditional collisionally excited line diagnostics, from He i line ratios, and from O ii recombination line ratios. For most of our nebulae we were not able to estimate a temperature from the Balmer jump, as it lies very close to the blue end of our wavelength coverage and is subject to large flux calibration uncertainties. However, it was well enough detected in both Hf 2-2 and NGC 6326 for a temperature to be estimated. In both objects, we find very low temperatures. For Hf 2-2, we find TBJ=840 K, in excellent agreement with the value of 890 K reported by Liu et al. (2006b).
For the O ii recombination line temperatures, we also show their values in Figure 3. Temperatures and densities were derived using the data of Storey et al. (2017), and the figure shows the locuses of possible values of the ratios of line pairs 4649/4089 and 4649/4662, for given combinations of temperatures and densities. Similarly to Storey et al. (2017), we find that some of our objects have line ratios implying temperatures below the lowest value for which the atomic data are available. Hen 2-283 in particular has ratios that appear spuriously low, perhaps indicating that the 4089 line is overestimated. This may simply be due to noise: this object has the lowest adf and thus the weakest recombination lines. It has also been suggested that a [Si iv] line coincident with the O ii line could result in an overestimate of the O ii flux (Peimbert & Peimbert 2013), although in that case, [Si iv] emission should also be present at 4116 Å with twice the flux of the 4089 emission. We see no feature at this wavelength and so we attribute the extremely low ratio in Hen 2-283 to noise alone.

Abundances were derived using neat version 2.1. neat version 1.0’s abundance analysis scheme was described in Wesson et al. (2012); updates since then have extended the analysis to report many new diagnostics and abundances where the relevant lines are available, including the O ii temperature and density diagnostics shown in Figure 3. Changes to the original analysis scheme other than extensions are: the incorporation of the ionization correction scheme of Delgado-Inglada et al. (2014) as the default scheme, replacing Kingsburgh & Barlow (1994); the incorporation of He i recombination coefficients from Porter et al. (2012) and Porter et al. (2013) as default; and a change to the default abundance weighting scheme. Originally, recombination line abundances for O2+ and N2+ were determined using the flux-weighted average of lines within a multiplet to determine the abundance for each multiplet, with the final ionic abundance being the equally weighted average of all multiplet abundances. In the latest version of neat, the multiplet abundances are instead weighted by the co-added intensity of the multiplet. neat allows the user to set any weight where the default is not suitable; we set the weight of the V5 multiplet of O2+ to zero as it frequently gives higher abundances than other well detected multiplets. Line flux uncertainties are propagated through the analysis into the derived quantities.
neat calculates abundances using a three-zone model; lines from ions with ionization potential (IP) 20 eV are assigned to the low ionization zone, those with 20 eVIP45 eV to the medium ionization zone, and those with IP45 eV to the high ionization zone. As our spectral coverage does not include the [N ii] 5754 line, and no high ionization zone temperature diagnostics are observed, the medium ionization zone temperature derived from [O iii] (4959+5007)/4363 is also used for the low and high ionization zones. The atomic data used in neat v2.1 is listed in Table 1, while Table 2 shows the diagnostics used in each zone, and the ions for which they are used. The electron temperatures and densities derived for the sample objects are given in Table 3, while the abundances are given in Table 4.
| Ion | Transition probabilities | Collision strengths |
|---|---|---|
| O+ | Zeippen (1982) | Pradhan (1976) |
| S2+ | Mendoza & Zeippen (1982) | Mendoza & Zeippen (1983) |
| Ion | Recombination coefficients |
|---|---|
| H+ | Storey & Hummer (1995) |
| He+ | Porter et al. (2012); Porter et al. (2013) |
| He2+ | Storey & Hummer (1995) |
| C2+ | Davey et al. (2000) |
| C3+ | Pequignot et al. (1991) |
| N2+ | Escalante & Victor (1990) |
| N3+ | Pequignot et al. (1991) |
| O2+ (3s–3p) | Storey (1994) |
| O2+ (3p–3d, 3d–4f) | Liu et al. (1995) |
| Ne2+ (3s–3p) | Kisielius et al. (1998) |
| Ne2+ (3d-4f) | Storey (unpublished) |
| Zone | Temperature diagnostics | Density diagnostics | Ions |
|---|---|---|---|
| Low | [O iii] (4959+5007)/4363 | [O ii] 3727/3729 | N+, O+, S+ |
| [S ii] 6717/6731 | |||
| Medium | [O iii] (4959+5007)/4363 | [Ar iv] 4711/4740 | C2+, O2+, Ne2+, Ar2+, Ar3+, S2+ |
| High | (none observed) | ||
4.1 Recombination line abundances and abundance discrepancies
We have detected strong heavy element recombination line emission in Fg 1, Hen 2-283, Hf 2–2, MPA J1759-3007 (abbreviated hereafter as MPA 1759), NGC 6326, NGC 6337, and Pe 1-9. In Figure 2, we show the 4650 Å region of the spectra of each of these objects, on a scale where F(H)=100, with the alfa fit and residuals also shown.
alfa identified between 11 and 33 lines of O ii in these seven objects. Lines of multiplets V1, V2, V10, V20 and 3d–4f transitions generally give abundances in good agreement with each other in good-quality spectra; see for example García-Rojas et al. (2013). The V1 and V10 multiplets are the best detected and thus received the most weight in our abundance determinations. Other 3-3 transitions and a few 3d-4f lines are detected in the deeper spectra, and are also used for the abundance calculation but with lower weight according to their observed flux.
Where RLs are detected, we obtain the adf for O2+/ and O/H. In three objects, we can also estimate the adf for N/H, although the uncertainty is always large. N+/H+ can only be derived from CELs, while N2+ can only be derived from RLs. RLs of N3+ are also detected in some cases but cannot be used for abundance measurements as they are excited by continuum fluorescence as well as recombination (Ferland 1992). Thus, no adf can be derived for any single ion of nitrogen, and the total abundance comparison relies on the ionization correction, which is very uncertain for CELs as only a small fraction of N is in the form of N+. Fluorescence excitation can also be significant for N+ and N2+ lines in very low excitation nebulae, such as IC 418 (Escalante et al. 2012). However, this is not likely to be the case for the nebulae observed here; He2+ emission is not detected in very deep spectra of IC 418 where lines with fluxes of 10F(H) are observed (Sharpee et al. 2003), whereas He2+ 4686 has a flux of at least 0.03F(H) in all our nebulae.
The adfs we derive from the seven objects are all high. The lowest is that of Hen 2-283, which at a factor of 6 is higher than at least 80% of PNe but far lower than the most extreme objects. For the other six objects, the adfs are between 18 and 95, all counting as among the highest known.
| Diagnostic | Fg 1 | Hen 2-283 | Hf 2-2 | MPA 1759 | NGC 6326 | NGC 6337 | Pe 1-9 |
|---|---|---|---|---|---|---|---|
| Density diagnostics | |||||||
| [O ii] 3727/3729 | |||||||
| [Ar iv] 4711/4740 | – | – | |||||
| [S ii] 6717/6731 | |||||||
| O ii 4649/4089,4649/4662 | – | – | – | – | – | ||
| Temperature diagnostics | |||||||
| [O iii] (4959+5007)/4363 | 8700 | ||||||
| Balmer Jump | 6000 | 810 | – | 950 | – | ||
| He i 5876/4471 | 6450 | ||||||
| He i 6678/4471 | |||||||
| O ii 4649/4089,4649/4662 | – | 400 | 2000 | 3500 | – | 2000 | – |
| Abundance | Fg 1 | Hen 2-283 | Hf 2-2 | MPA 1759 | NGC 6326 | NGC 6337 | Pe 1-9 |
|---|---|---|---|---|---|---|---|
| CEL abundances | |||||||
| N+/H | 6.260.05 | 7.410.02 | 6.72 | 6.160.04 | 6.610.02 | 7.03 | 7.100.01 |
| icf(N) | 15.00 | 14.60 | 7.30 | 23.00 | 8.52 | 23.50 | 5.87 |
| N/H | 7.440.05 | 8.57 | 7.590.07 | 7.520.09 | 7.540.03 | 8.400.05 | 7.87 |
| O+/H | 7.330.11 | 7.70 | 7.20 | 6.830.08 | 7.080.02 | 7.31 | 7.53 |
| O2+/H | 8.460.06 | 8.710.02 | 7.90 | 8.160.03 | 7.920.02 | 8.57 | 8.110.00 |
| icf(O) | 1.130.01 | 1.010.01 | 1.010.01 | 1.170.01 | 1.280.01 | 1.540.02 | 1.010.01 |
| O/H | 8.54 | 8.760.02 | 7.98 | 8.250.03 | 8.080.02 | 8.78 | 8.220.01 |
| Ne2+/H | 8.08 | 8.220.02 | 7.55 | 7.690.03 | 7.590.02 | 8.03 | 7.790.03 |
| icf(Ne) | 1.130.01 | 1.13 | 1.080.01 | 1.170.01 | 1.290.01 | 1.540.02 | 1.12 |
| Ne/H | 8.13 | 8.270.03 | 7.58 | 7.760.03 | 7.700.02 | 8.22 | 7.840.03 |
| Ar2+/H | 6.040.05 | 6.480.01 | – | 5.890.04 | 5.680.02 | 6.42 | 6.00 |
| Ar3+/H | 6.140.06 | 5.970.03 | 5.340.13 | 5.710.04 | 5.600.01 | 6.48 | 5.53 |
| icf(Ar) | 1.000.00 | 1.130.02 | 1.000.00 | 1.120.05 | 1.000.00 | 1.01 | 1.00 |
| Ar/H | 6.390.05 | 6.64 | 5.340.13 | 6.160.04 | 5.970.02 | 6.81 | 6.130.03 |
| S+/H | 4.990.06 | 6.06 | 5.35 | 4.94 | 5.410.02 | 5.81 | 5.78 |
| S2+/H | – | – | – | – | – | – | – |
| icf(S) | 27.10 | 22.70 | 12.04 | 40.70 | 13.93 | 34.80 | 9.65 |
| S/H | 6.42 | 7.420.03 | 6.430.07 | 6.56 | 6.550.03 | 7.350.05 | 6.78 |
| RL abundances | |||||||
| He+/H | 11.070.01 | 11.140.01 | 11.220.01 | 11.12 | 10.85 | 10.94 | 11.170.01 |
| He2+/H | 10.430.02 | 9.40 | 9.620.01 | 10.610.01 | 10.550.00 | 10.900.00 | 9.540.03 |
| He/H | 11.16 | 11.150.01 | 11.230.01 | 11.240.02 | 11.030.01 | 11.220.01 | 11.180.01 |
| C2+/H | 9.230.05 | 9.270.04 | 9.890.02 | 9.850.03 | 8.710.04 | 9.350.04 | 9.750.04 |
| C3+/H | 8.61 | 8.21 | 8.43 | – | – | – | – |
| icf(C) | 1.100.05 | 1.100.03 | 1.150.01 | 1.440.01 | 1.540.01 | 1.850.02 | 1.190.00 |
| C/H | 9.360.05 | 9.350.04 | 9.960.02 | 10.010.03 | 8.890.04 | 9.620.04 | 9.83 |
| N2+/H | 9.90 | – | 10.53 | – | – | – | – |
| N3+/H | 8.470.02 | 8.310.03 | 8.03 | 8.79 | 8.430.01 | 8.810.02 | – |
| icf(N) | 1.000.00 | 1.000.00 | 1.000.00 | 1.000.00 | 1.000.00 | 1.000.00 | 1.000.00 |
| N/H | 9.95 | 8.310.03 | 10.53 | 8.79 | 8.430.01 | 8.810.02 | – |
| O2+/H | 10.110.03 | 9.420.04 | 9.850.03 | 9.960.03 | 9.280.06 | 9.830.05 | 9.90 |
| icf(O) | 1.23 | 1.110.01 | 1.220.02 | 1.250.02 | 1.500.02 | 1.620.02 | 1.280.04 |
| O/H | 10.20 | 9.47 | 9.940.03 | 10.060.03 | 9.460.06 | 10.040.04 | 10.00 |
| Ne2+/H | – | – | – | – | 9.28 | – | – |
| icf(Ne) | 1.23 | 1.110.01 | 1.220.02 | 1.250.02 | 1.500.02 | 1.620.02 | 1.280.04 |
| Ne/H | – | – | – | – | 9.45 | – | – |
4.2 Nebulae with extreme abundance discrepancies
FORS2 H images of our seven newly observed nebulae are shown in Figure 1. We discuss the analysis of the individual objects below.
4.2.1 Fg 1
Fg 1 (PN G290.5+07.9) was shown by Boffin et al. (2012b) to host a double-degenerate central binary system with an orbital period of 1.20 d, while the nebula is held as an archetype of the influence of a central binary star with an expanding equatorial ring and bipolar, rotating episodic jet ejections (Lopez et al., 1993; Palmer et al., 1996).
The value of c(H) calculated from H/H is higher than the values obtained from H/H and H/H; the latter two ratios are in excellent agreement with each other. As H was observed using a different grating to the other three lines, we adopt c(H)=0.520.18 from the three blue lines, and scale the red spectrum by a factor of 0.85 such that the H line flux gives the same extinction.
All density diagnostics are in good agreement, indicating an electron density of around 500 cm-3. The temperature from the [O iii] (4959+5007)/4363 line ratio is 11 000300 K. The Balmer jump is detected but with a large uncertainty due to being close to the edge of our spectral coverage; it yields an upper limit to the temperature of about 6 000 K. He i line ratios are consistent with much lower temperatures of 1kK.
The extremely strong recombination line emission in this object and its high excitation – I(He2+ 4686) 0.35I(H) – means that recombination contributes significantly to the flux of the temperature-sensitive [O iii] 4363 line. Neglecting this effect, the abundance discrepancy is calculated to be a factor of 80. Using Equation 3 from Liu (2006), and taking the value of O/H+H derived from recombination lines, we find that the recombination contribution is 40% of the total flux of the line. Subtracting this, the electron temperature is revised to 9430290 K, yielding an abundance discrepancy factor for O2+ of 46.
The abundance discrepancy for N/H may also be extremely high; the abundance measured for N/H from recombination lines exceeds that for collisionally excited lines by a factor of nearly 150. However, the value of N/H for recombination lines is determined from a single line of N ii and thus could be subject to systematic effects such as line blending, imperfect cosmic ray removal and hot pixels.
4.2.2 Hen 2-283
Hen 2-283 (PN G355.7-03.0) is a canonical bipolar nebula shown to host a 1.13 d period central binary star showing photometric variability due to the irradiation of a main-sequence companion (Miszalski et al., 2009a; Miszalski et al., 2009b).
No scaling is applied to the red spectra in this object as c(H) values from all Balmer lines are consistent, giving a mean c(H) of 1.480.04. Diagnostics of electron density yield values in excellent agreement with each other: cm-3 from [S ii], cm-3 from [O ii], and cm-3 from [Ar iv].
We could not measure a Balmer jump temperature in this object. He i lines, though, are well detected and indicate very low temperatures: He i 5876/4471 line ratio gives Te= K, while He i 6678/4471 gives Te= K. O ii lines give low upper limits to the temperature and the density, implying Te<700 K. In contrast to Fg 1, the recombination contribution to the 4363 line is negligible.
This object has the lowest measured adf(O/H) of our sample at 5.10.5. Recombination lines of N2+ are not detected. We note that the orbital period of its binary lies very close to the apparent threshold of 1.15 d approximately separating extreme from non-extreme adfs (Section 5.1.1). It also has a markedly higher electron density than the rest of the sample; the mean and standard deviation of their densities is 650120 cm-3, compared to 3430 cm-3 in this object. And it has the highest O/H and N/H abundances of the sample. This is discussed further below.
4.2.3 Hf 2-2
Hf 2-2 (PN G005.1-08.9) has previously been shown to present an extremely high adf (Liu et al., 2006a; McNabb et al., 2016, 70-80,) and enters our sample as a control, in order to verify our methodology and compare our results with the previous analysis. The central star of Hf 2-2 was shown to be a post-CE binary with a period of 0.40 d by (Bond, 2000), where the form of the light curve indicates variability due to an irradiated main-sequence secondary. Deep narrow-band imagery of Hf 2-2 displays a roughly circular profile consistent with an apparently double-shelled structure (Miszalski et al., 2009b). Unpublished morpho-kinematical observations confirm this multiple-shelled structure with both shells likely having a nearly pole-on elliptical morphology (Jones et al. in preparation), similar to that of the post-CE PN Abell 65 (Huckvale et al., 2013) and those predicted by the hydrodynamic models of García-Segura et al. (2018).
The extinction we derive towards Hf 2-2 is higher from H/H than from other Balmer line ratios, which yield more consistent values of c(H). We thus rescale line fluxes measured from the red spectrum by 0.95, which results in consistent values from H- line fluxes. The weighted mean extinction is then c(H)=0.330.02, slightly higher than the value of 0.20 found by Liu et al. (2006b). Their slit was aligned at 45∘ east from north, while for our observations, the slit was aligned N-S.
From the integrated spectrum of Hf 2-2, we derive Te([O iii])=9870490 K, and an adf for O2+ of 9515. This is in reasonably good agreement with the values found by Liu et al. (2006a) of 8740 K and a factor of 70, and by McNabb et al. (2016) of 9650 K and a factor of 80. A correction to our measured 4363 line may be necessary, as it may be significantly enhanced by recombination; taking O/H from the recombination line value, and using Equation 3 from Liu et al. (2000), we find that 11% of the line flux is due to recombination. Subtracting this, the measured temperature is 9410 K, and adf(O/H) is reduced somewhat to 8315.
Electron temperature estimates from several recombination line diagnostics are available in Hf 2-2, thanks to the strength of its recombination line spectrum. The hydrogen Balmer jump is well detected and gives a temperature of TBJ=840 K, in excellent agreement with the value of 890 K reported by Liu et al. (2006a). He i line ratios yield temperatures of 3050 K (5876/4471) and K (6678/4471). O ii recombination lines, meanwhile, give an electron temperature of 3100 K and an electron density of 2750 cm-3, as shown in Figure 3.
4.2.4 MPA J1759-3007
MPA J1759-3007 (PN G000.5-03.1a, hereafter MPA 1759) was classified by Miszalski et al. (2009b) as a likely bipolar nebula, while the acquisition images acquired as part of this programme show the nebula to have a roughly circular appearance (see Figure 1). The central star of MPA 1759 was shown by Miszalski et al. (2009a) to be a 0.50 d period binary where the companion is most likely a degenerate star.
c(H) values from Balmer lines - were all consistent, giving c(H)=1.460.07, and thus we applied no scaling to our red or blue spectra. Density diagnostics are all in excellent agreement with all three available giving an average of 740 cm-3, with which each individual diagnostic agrees to within its 1 uncertainty.
No Balmer jump temperature could be measured. He line ratios imply much lower temperatures than the [O iii] line ratio, albeit with large uncertainties (in the case of Te(6678/4471), large enough that the 1 uncertainty encompasses the value of Te([O iii]). O ii line ratios imply an extremely low temperature of K, and a density of cm-3, in excellent agreement with the values from CEL diagnostics.
adf(O/H) is estimated at 687. If the [O iii] 4363 line is corrected for the recombination contribution, which we estimate could be up to 40%, the temperature would be revised from K to K, and adf(O/H) to 628.
4.2.5 NGC 6326
NGC 6326 (PN G338.1-08.3) is a bright, irregular nebula whose central star is a binary system with orbital period 0.37 d (Miszalski et al., 2011b, the exact composition of which is uncertain, but the secondary is most likely a main-sequence star,).
[O iii] 5007 is saturated in the spectrum of this bright nebula, but the 4959 line is not. We thus calculate the electron temperature using the 4959 line only. We apply no scaling to our line fluxes, although there is some scatter among the values of c(H) derived from the various Balmer lines. The ratios H, H and H to H give c(H)=0.290.01, 0.530.05 and 0.380.06 respectively. The mean, weighted by the observed line fluxes, is 0.470.04.
The electron density diagnostic lines of [O ii], [S ii] and [Ar iv] are detected, giving an average density of 750 cm-3. The values of the individual diagnostics are each consistent with this average, to within their estimated 1 uncertainties.
The electron temperature from collisionally excited lines is K. The recombination contribution to 4363 could be up to 6%, which would result in a correction of 300 K to the electron temperature. He i line ratios give temperatures consistent within their uncertainties: an upper limit of 6450 K from 5876/4471, and K from 6678/4471. The O ii 4089 line may be present in our spectrum but its flux falls below the estimated 3 noise level, and we are thus not able to estimate a temperature or density from the O ii line ratios.
We estimate an adf(O/H) of 3 for this object. No recombination lines of N2+ are detected, but we detect recombination lines of Ne2+, and are also able to estimate adf(Ne/H), which we find to be even higher than adf(O/H) at 5620.
4.2.6 NGC 6337
NGC 6337 (PN G349.3-01.1) consists of a ringed waist viewed pole-on (with little or no evidence of nebular lobes extending away from this waist) and a pair of precessing jets oriented more or less in the line of sight (García-Díaz et al., 2009), while the central star has a main sequence companion in a 0.17 d orbit (Hillwig et al., 2010).
We scale our red spectra of NGC 6337 by 0.78 to obtain a consistent value of c(H) from the Balmer line ratios, obtaining c(H)=0.500.02. Density diagnostics indicate an electron density of around 500 cm-3, with [S ii], [O ii] and [Ar iv] diagnostics in excellent agreement with each other.
Before correcting for the recombination contribution to 4363, the [O iii] temperature is K. The He i line ratios give temperatures consistent with each other, of K (5876/4471) and K (6678/4471). The O ii line ratios, shown in Figure 3, give upper limits to the temperature of 3250 K and to the density of 3700 cm-3. The abundance discrepancy for O/H is 405.
The recombination contribution to 4363 could be up to 55%, taking O/H from the recombination line abundances. Correcting the line flux accordingly, the temperature would be reduced to K and adf(O/H) to 182.
4.2.7 Pe 1-9
Pe 1-9 (PN G005.0+03.0) is a multiple-shelled PNe with a slightly elongated morphology while its central star has an eclipsing main-sequence secondary with an orbital period of 0.14 d (Miszalski et al., 2009a; Miszalski et al., 2009b).
The adf for this object is very uncertain but nevertheless almost certainly extreme. The [O iii] 4363 line is not detected; it appears to be present when visually inspecting the spectrum but its estimated flux is within 3 of the noise limit. The important recombination lines, though, are statistically significantly present. Using the upper limit to the line flux reported by alfa, the electron temperature is 8700 K and adf(O/H) is then 60. To reduce the adf to less than 10, the electron temperature would need to be less than 6000 K, an implausibly low value given the observed strengths of the collisionally excited lines. Furthermore, the density estimated from [O ii] in this object exceeds that from [S ii] by a factor of 2.5: 1060 and 410 cm-3 respectively. As discussed below, this discrepancy is associated with the most extreme adfs.
4.3 Spatially resolved analyses
As can be seen in Figure 1, Hen 2-283 and MPA 1759 have small angular radii, of approximately 8 and 10 arcsec in diameter respectively, and our observations are not deep enough to permit a spatially resolved analysis. In Pe 1-9, the [O iii] line is not detected in the spatially integrated spectrum, and so we did not attempt a spatially resolved analysis for this object either. For the other four extreme-adf objects, we extracted spectra divided into spatial bins covering the visible extent of the nebula along the slit. In measuring spatially resolved abundances, we used only the V1 multiplet of O2+, as it is the brightest and most easily measured. For each of these nebulae, we show in Figures 4-7 the variation of adf(O2+), [O ii] and [S ii] electron densities, and the emission line fluxes of the [O iii] 4363 and 5007 collisionally excited lines, and the C ii 4267 and O ii 4649 recombination lines. For NGC 6326, the 5007 line is saturated and we plot instead the intensity of the 4959 line.
Generally, as has been observed previously for a number of nebulae with both extreme and non-extreme abundance discrepancies, higher values of the adf are seen closer to the central star. This is particularly clear for Hf 2-2, where it peaks at 150, and NGC 6326 with a peak of 35. Slightly different behaviour is seen in NGC 6337, which is a bipolar nebula viewed pole-on. In this case, an adf is not measured in the central gap where recombination lines are not detected, but the highest values are seen at the inner edges of the ring. Different behaviour is also seen in Fg 1, where a central peak is observed, but higher values are also seen at the outer edge of the bright central region.
A spatial comparison of the electron densities measured from [O ii] and [S ii] shows that the two diagnostics behave differently: the density estimated from [O ii] is almost always higher than that from [S ii], with a greater discrepancy seen in regions with higher adfs. In Hf 2-2, for example, the density calculated from the [S ii] line ratio is close to constant at 200200 cm-3, while from [O ii], a higher density is estimated at all positions, with the greatest discrepancy occurring in the central regions, where [S ii] gives a density of 150 cm-3 and [O ii] gives 2500 cm-3. This indicates that the [O ii] line ratio is affected by recombination of O+, while the [S ii] ratio is not affected, or far less affected, by recombination of S+. In a chemically homogeneous nebula, there would be no reason for this difference in behaviour, and this thus provides further support for the existence of chemical inhomogeneities. We observe the same discrepancy in the integrated spectra of other high-adf nebulae, and discuss this further in Section 5.
Corradi et al. (2015), Jones et al. (2016) and García-Rojas et al. (2016) have noted that in a number of objects, the spatial profile of the collisionally excited [O iii] 4363 line is very similar to that of the O ii 4649+50Å recombination line, rather than that of the other collisionally excited lines. In most cases, the recombination contribution to 4363 should be small, and in any case should trace the distribution of O3+, so its spatial similarity to the doubly ionized recombination lines is unexpected.
In Hf 2-2, this pattern is again seen, with the profile of the [O iii] 4363 line closely resembling the profiles of the C ii 4267 and O ii 4649 lines, all three dropping more rapidly with distance from the central star than the [O iii] 5007 line. However, in the other three objects the spatial profiles are less similar. In Fg 1, the flux of [O iii] 5007 is quite constant across the nebula, while the recombination lines are strongest at the centre and edges, with a minimum at 8 arcsec from the central star. The 4363 line shows a minimum at a greater radial distance of 12 arcsec. In NGC6326, the spatial profiles are quite distinct, with the recombination lines strongly centrally peaked, while [O iii] 4959 and 4363 vary more gradually. While also centrally peaked, [O iii] 4363 is only 25% lower at the edges than in the centre, whereas O ii 4649 has an intensity at the edges of about 20% of its central value. In NGC 6337, too, the spatial profiles differ, with the recombination lines having their highest intensities towards the inner edge of the ring, while the CELs peak at the outer edge of the ring.
Thus, the spatial profile of [O iii] 4363 most closely resembles that of the recombination lines in the nebulae with the highest adfs. This suggests that recombination excitation of the line must be significant. To understand how this arises, and whether recombination of O3+ really can excite the [O iii] 4363 line to such a degree that it dominates the spatial profile will require detailed three-dimensional photoionization models to be created.


4.4 Abundance discrepancy upper limits
Given that where RLs are detected, we have a 100% strike rate of elevated to extreme adfs, it is of interest to determine upper limits for the remaining objects in the sample, to see if we can rule out an adf5 for any objects in the sample.
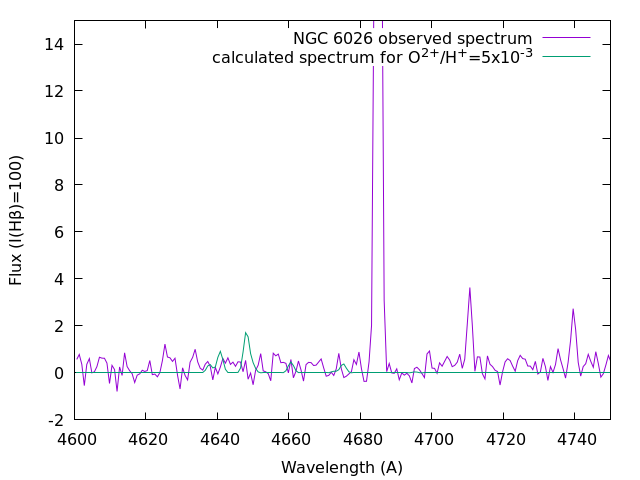
For the 20 objects where recombination lines are not detected but abundances from collisionally excited lines can be calculated, we establish upper limits for the RL abundances of O2+/H by calculating synthetic recombination line spectra, matching the observed H line flux and scaling the abundance to the point where the lines would have been detected. We show an example of this technique for one of the nebulae in Figure 8, and list the upper limits we obtained in Table 5. The limits obtained are generally not very stringent, and we cannot in any case rule out an abundance discrepancy factor greater than 5. We thus do not find in our current sample any examples of nebulae with a close binary central star but a non-extreme abundance discrepancy. Of course, deeper spectra of our recombination line non-detections could yet yield such objects; one or two are known to exist (see discussion).
The most stringent upper limits are found for M 2-19, M 3-16, MPA 1508 and NGC 2346, which are all constrained to have an abundance discrepancy factor of less than about 10. In NGC 2346, we may detect a single O ii line - 4649, the strongest line of the V1 multiplet, with a flux that would indicate an adf of 10. However, the line flux only just exceeds the estimated 3 limit, and in the absence of any other O ii line detections, we do not consider that a reliable abundance can be derived. Both M 2-19 and M 3-16 have a high extinction with c(H)1.6 for each, and the weakest lines detected in either object have fluxes of about 0.5, where H=100. The central star of NGC 2346 has an orbital period of 16 d (Mendez & Niemela 1981, Brown et al. in preparation), while that of MPA 1508 has a period of 12.5 d (Miszalski et al. 2011a), according to which we would predict a non-extreme adf for both (see discussion below). M 2-19 and M 3-16 have orbital periods of 0.670 and 0.574 d respectively (Miszalski 2009), but have the highest measured electron densities of the objects in which we do not detect recombination lines, at 1120 and 1250 cm-3 respectively. As discussed in Section 5.2.1, the most extreme adfs are generally seen in the objects with the lowest densities, a finding consistent with the moderate upper limit for these two objects.
Based on our findings from the objects with measured adfs (see below), we would predict non-extreme adfs for the objects with binary orbital periods greater than 1.15 d, elevated discrepancies for M 2-19 and M 3-16 given their higher densities, and extreme abundance discrepancies for the rest of the nebula. Deeper spectra of all these objects would thus provide important constraints on the relationships between binary orbital period, electron density and the abundance discrepancy factor.
| Object | O2+/H+ (x10-3) | adf | Orbital period (days) | Electron density (cm-3) | ||
|---|---|---|---|---|---|---|
| RLs (upper limit) | CELs (observed) | [S ii] | [O ii] | |||
| A 41 | 2.0 | 0.07 | 25 | 0.226 | 300100 | 14060 |
| A 65 | 15.0 | 0.19 | 80 | 1 | – | – |
| BMP 1801 | 20.0 | 0.02 | 800 | 0.322 | – | – |
| H 2-29 | 5.0 | 0.03 | 170 | 0.244 | 290150 | 1060 |
| HaTr 4 | 12.0 | 0.14 | 90 | 1.74 | – | – |
| Hen 2-11 | 20.0 | 0.35 | 60 | 0.609 | 230150 | – |
| Hen 2-428 | 5.0 | 0.02 | 220 | 0.176 | 580100 | 460300 |
| K 1-2 | 80.0 | 0.38 | 210 | 0.676 | – | – |
| K 6-34 | 8.0 | 0.01 | 650 | 0.39 | 700 | – |
| Lo 16 | 10.0 | 0.20 | 50 | 0.49 | 200150 | – |
| M 2-19 | 1.0 | 0.10 | 10 | 0.670 | 139070 | 1100200 |
| M 3-16 | 2.0 | 0.20 | 10 | 0.574 | 112080 | 1100200 |
| MPA 1508 | 2.0 | 0.18 | 10 | 12.50 | 820 | 600 |
| NGC 2346 | 2.0 | 0.23 | 8 | 15.99 | 26560 | 26050 |
| NGC 6026 | 5.0 | 0.07 | 70 | 0.528 | – | |
| PHR 1756 | 15.0 | 0.06 | 270 | 0.266 | – | |
| PHR 1804 | 25.0 | 0.22 | 110 | 0.626 | – | |
| PM 1-23 | 40.0 | 0.20 | 200 | 1.26 | – | |
| Sab 41 | 20.0 | 0.20 | 100 | 0.297 | 14080 | 470 |
| Sp 1 | 6.0 | 0.08 | 70 | 2.91 | – | |
5 Discussion
Figure 9 shows 202 values available in the literature for the abundance discrepancy of O2+/H+ at the time of submission of this paper, ranked and with close binary PNe highlighted in blue, and H ii regions in purple. For all objects, the median discrepancy is 2.2, and 37 nebulae have a discrepancy larger than a factor of 5.
H ii regions, as found by e.g. García-Rojas & Esteban (2007), show behaviour distinct from PNe, with no evidence of elevated or extreme abundance discrepancies. Tsamis et al. (2003) found an elevated abundance discrepancy in the LMC H ii region LMC N11B, but Toribio San Cipriano et al. (2017) found that this was due to an overestimate of the 4089 O ii line, revising its adf down to 1.58. Excluding the higher value from the statistics, H ii regions have a mean adf of 1.90.5, and a median value also of 1.9. A Shapiro-Wilk test returns a -value of 0.59, well above the value of 0.05 below which the hypothesis of a normal distribution could be questioned.
For PNe, the mean adf, strongly skewed by the tail of extreme values, is 1259. The median, 16th percentile and 84th percentile values are 2.5, 1.7 and 7.3 respectively. Fully disentangling post-CE and single star PNe from their adf alone is not possible, and thus this “mean" of objects formed by two different evolutionary channels may be unrepresentative of either. Considering only the known close binaries, the median is 18, and the mean is 2824. The association between extreme discrepancies and close binarity is clear, and indeed several of the extreme objects not highlighted are nevertheless strongly suspected to have a close binary central star (e.g. Abell 30, Abell 58, NGC 1501).


The number of objects with a measured adf and for which binarity and other properties are known allows us to make some preliminary statistical inferences. Physically, there is evidence for (at least) two mechanisms that cause adfs: one that can cause moderate adfs, as seen ubiquitously in all ionized regions where recombination lines have been detected, including planetary nebulae, H ii regions (Tsamis et al. 2003, García-Rojas & Esteban 2007) and Wolf-Rayet ejecta nebulae (Mesa-Delgado et al. 2014); and a second that causes the elevated and extreme adfs only seen in planetary nebulae. The two mechanisms show some differences in their effect on heavy element ratios (García-Rojas & Esteban 2007). To disentangle the two mechanisms, we created synthetic probability distributions, tailored to broadly reproduce the features of the planetary nebula and H ii region adf probability distributions. For H ii regions, this is straightforward; the adfs closely follow a normal distribution, with the distribution well fitted using =1.92 and =0.45. With these parameters, the lowest measured adf for an H ii region, although almost unique in being below unity (which must be due to abundance measurement uncertainties, as no known mechanism can account for adf1), is in fact only 2.5 from the mean. Meanwhile, the value of 4.16 derived for Mrk 1271 (Esteban et al. 2014) is a nearly 5 outlier, albeit with a significant uncertainty of 0.15 dex.
For planetary nebulae, we model the distribution with two components, one normally distributed and the second log-normally distributed, with the second distribution occuring only in a fraction F of all nebula. The distribution we settled upon is:
| (1) | |||||
| (2) |
where R1 and R2 are random numbers drawn from a Gaussian distribution with mean zero and variance unity. We initially took F as 0.2, to reflect the fraction of PNe known to have close binary central stars, but found that the observed distribution could be better approximated with F=0.5. Figure 10 shows 154 values generated by this compound probability distribution, ranked and compared with the 154 actual literature values for the adf in planetary nebulae.

The “normal" adf may be interpreted as the same mechanism that gives rise to adfs in H ii regions, operating in planetary nebulae. A slightly higher mean was required to fit the observed distribution of adfs at the low end of the range. A natural interpretation would be to attribute this to temperature fluctuations of the kind envisaged by Peimbert (1967), with their magnitude being greater in planetary nebulae.
The “extreme" adf distribution may then be interpreted as due to a second mechanism, operating only in nebulae with close binary central stars. Though we set F to 0.5, this does not imply that the ‘true’ close binary fraction is necessarily significantly higher than the commonly estimated fraction; adfs will of course be more easily measured in objects with elevated or extreme abundance discrepancies and thus the overall sample of objects with measured adfs will be likely to contain more close binaries than the overall planetary nebula population. As an illustration of the potential biases, this paper has increased the number of PNe with adf5 by about 20%, specifically by studying only PNe known to host close binary central stars.
This synthetic distribution is intended only to be illustrative and is clearly not a unique solution, but the fact that H ii region adfs can be well modelled with a Gaussian distribution, while those of PNe clearly cannot, supports the hypothesis that a single mechanism gives rise to H ii region adfs, while an additional mechanism needs to be invoked to account for the extremely skewed distribution of planetary nebula adfs.
We now consider the relations between nebular adf and properties of the central star and nebula.
5.1 Relationship of adfs with central star properties
5.1.1 The binary period
In this work and the study by Jones et al. (2016), we have increased the number of close binary CSPNe known to be surrounded by a high-adf nebula from 6 to 13. Two further PNe have a close binary but a low adf, for a total of 15 objects with a known binary CSPN and a measured adf. We can thus start to investigate correlations between the adf and the central star properties in these objects.
First, we consider whether there is a relationship between the period of the central binary and the abundance discrepancy. If some kind of continuous relationship existed between the two, this would imply that whatever mechanism gives rise to extreme adfs operates regardless of the binary period, but its magnitude is determined by it. Alternatively, if a threshold period dividing elevated from normal adf objects exists, it would suggest that the mechanism is triggered only for shorter period binaries.
We list in Table 6 the values of adf and binary orbital period for all objects where both are known, and plot adf against period in Figure 11. The number of points is still too small to draw firm conclusions as the distribution of periods in the sample is strongly concentrated at smaller values, but some hints of a relationship between adf and orbital period begin to emerge. All of the objects in the current sample have periods of 1.20 d or less and all have elevated or extreme abundance discrepancies. Of the eight previous objects with known chemistry and orbital period, two have a “normal" adf: NGC 5189 has an adf of 1.6 (García-Rojas et al. 2013), and a period of 4.04 d (Manick et al. 2015), and IC 4776 has adf(O2+)=1.75, and a period that is poorly constrained but thought to be around 9 d (Sowicka et al. 2017). Additionally, the Necklace nebula is a definite post-CE object; there are no published recombination line abundances but Corradi et al. (2015) report that the non-detection of recombination lines in deep spectra sets a low upper limit to its abundance discrepancy. The orbital period of the central star is 1.16 d (Corradi et al. 2011).

We therefore note that all objects with a binary period of less than 1.15 d have an extreme abundance discrepancy, while 3 of 4 objects with a binary period longer than 1.15 d do not. This finding is subject to a significant selection effect, because known binary central star periods are intrinsically strongly concentrated at periods of 1 d (due to detection biases; Jones & Boffin 2017); the absence of high adf objects with long periods may simply be due to the very small sample of longer period objects. However, the probability of the two lowest adfs coinciding with the two longest orbital periods by chance alone is only 0.95%. Additionally, after the submission of the first draft of this paper, Miszalski et al. (2018) reported the discovery of a binary central star in the nebula MyCn 18, with a period of 18.15 d; the abundance discrepancy in this nebula was measured to be 1.8 by Tsamis et al. (2004). This third example of a low-adf nebula surrounding a longer-period central star argues strongly against a coincidencental relationship.
5.1.2 Stellar abundances
Correlations between central star abundances and nebular abundance discrepancies have been proposed in the past; Ercolano et al. (2004) noted that the central star of NGC 1501 was hydrogen-deficient, in common with several other then-recently identified extreme adf objects. However, they also noted that other objects with H-rich stellar atmospheres were also associated with extreme adfs, and concluded that no clear relationship existed between the phenomena. García-Rojas et al. (2013) measured the adf in several objects with known H-deficient central stars, and did not find any elevated or extreme abundance discrepancies.
Given the evidence that extreme adfs are caused by cold hydrogen-deficient clumps embedded in hot gas of normal composition, a source for these clumps needs to be identified. Two possibilities have been discussed; first, a very late thermal pulse (VLTP), in which a single star experiences a thermal pulse after having begun its descent of the white dwarf cooling track. The second scenario is a nova-like eruption relying on a binary central star. Additional and more complex scenarios are possible: Lau et al. (2011) suggested that some combination of VLTP and nova in which the former triggered the latter could explain the properties of the hydrogen-deficient knot in Abell 58. Given the lack of observational constraints on such scenarios, we consider only these two relatively simple cases.
The two scenarios make contrasting predictions for the central star abundances. The VLTP scenario would result in a hydrogen-deficient central star, and indeed that scenario is commonly invoked specifically as a mechanism for creating such stars. Meanwhile, the nova-like scenario is as yet ill-defined. An eruption in which some hydrogen is neither burned nor ejected would be required to leave behind a hydrogen-rich post-nova object.
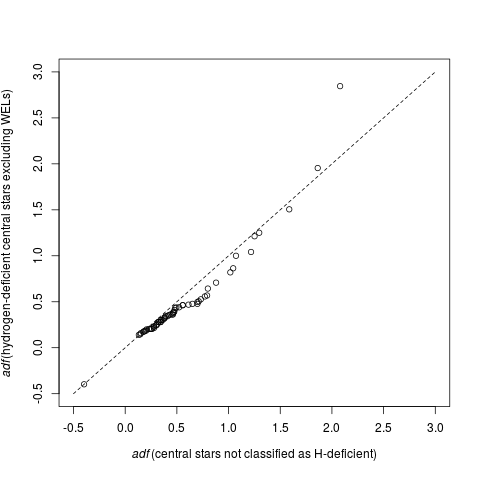
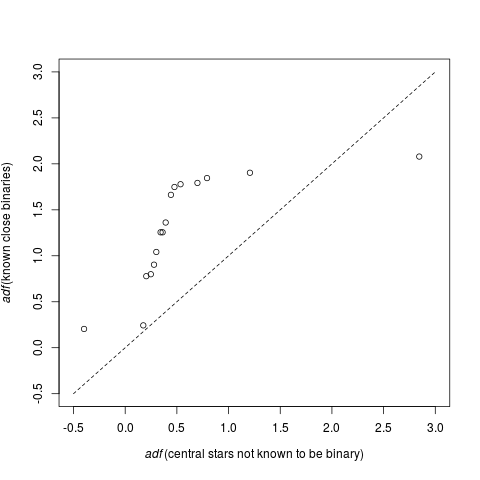
We have searched the literature for central star classifications, and find that 33 nebulae have both a measurement of the adf, and a published classification of their central star indicating that they are [WR] or PG-1159 stars (Aller & Keyes 1987, Weidmann & Gamen 2011, Akras et al. 2015, Todt et al. 2015). A further 31 are classified as wels stars; we exclude these from consideration due to the high likelihood of many of these classifications being either contamination by nebular emission or irradiation of the secondary (Miszalski et al. 2011b). The left-hand panel of Figure 12 shows a Q-Q plot comparing the quantiles of the distributions of adfs, for nebulae with H-deficient central stars and those without. In such a plot, for two different data sets, if the two sets are drawn from the same underlying probability distribution, the points will lie close to the line of . Populations drawn from differing probability distributions will diverge from the 1:1 relation. In this case, the points indeed mostly lie close to . In the right-hand panel of the figure, we show the Q-Q plot for planetary nebulae with binary central stars against those without a known binary central star. The large deviations from the line indicate that the adfs of nebulae with binary central stars come from a strongly differing distribution to those without.
Some caveats apply to the surface chemistry determinations: many literature values have been obtained from relatively poor-quality spectra at low resolution, where nebular and stellar features may be difficult to distinguish. Basurah et al. (2016) showed that for at least some stars classified as “weak emission line" objects and suspected to be hydrogen-deficient, the weak emission lines were of nebular origin. Another potential issue is that the light of the secondary star may be bright enough to affect the classification - a particularly strong possibility given that many binary central stars have been discovered through their large irradiation effects.
However, the available data on central star surface chemistries argues against a VLTP, while a nova-like outburst as the source of hydrogen-deficient material in planetary nebulae remains plausible. This is of course consistent with the strong association of close binary central stars with extreme adfs. The apparent relationship between binary period and adf may imply that binaries with periods longer than the 1.15 d threshold never experience the event which leads to the ejection of hydrogen-deficient material into the nebula; it could alternatively suggest that in the shorter period objects, the event occurs at the time of or very soon after the ejection of the nebula, while in the longer period objects it may occur later. This could potentially account for objects such as Abell 30 and Abell 78, where hydrogen-deficient material is directly observed, with kinematic observations showing that it was ejected thousands of years after the outer nebula into which it is expanding (Borkowski et al. 1995).
5.1.3 Weak emission lines
As noted by e.g. Basurah et al. (2016), nebular recombination lines may be mistaken for stellar emission lines, leading to a misclassification. The opposite may also be true; close binary stars with an irradiated secondary typically show strong stellar emission at the wavelengths of nebular recombination lines. If stellar emission contaminated the nebular spectrum, the adf could be significantly overestimated. However, we do not believe that this is likely for several reasons: we excluded bright central star emission from our integrated spectra (see Figure 1), and in any case several extreme-adf objects have central stars that show no sign of irradiation lines in our spectra. Direct excitation of the nebular lines by the central star emission could contribute to the nebular emission line fluxes, but arguing against this possibility is the evidence for significant recombination excitation of the [O ii] 3727, 3729 and [O iii] 4363 lines, which cannot be emitted by the central star. The relations between adf and nebular density discussed below would also not be expected to arise if some significant fraction of the adf could be attributed to central star rather than nebular emission.
5.2 Relationship of adfs with nebular properties
To assess the possible relationships between abundance discrepancies and other nebular properties, we have compiled data on each of the 15 PNe that have known recombination line abundances and a close binary central star. Previous authors have considered relationships between nebular parameters and abundance discrepancies (e.g. Tsamis et al. 2003, Wesson et al. 2005); however, such comparisons included two separate populations of objects, the post-CE PNe and the “normal" PNe, and thus any trends that differ between the two populations would have been incorrectly estimated. Here, we are restricting our investigations to definite post-CE PNe. In Table 6, we present nebular parameters of the sample objects, and we discuss them below.
| Object | adf | period | N/H | O/H | electron density | reference |
| (days) | (cm-3) | |||||
| A 46 | 120 | 0.47 | 6.77 | 7.93 | 1590 | Corradi et al. (2015) |
| A 63 | 8 | 0.46 | 7.46 | 8.59 | 1560 | Corradi et al. (2015) |
| Fg 1 | 46 | 1.2 | 7.84 | 8.26 | 500 | This work |
| Hen 2-283 | 5.10.5 | 1.15 | 8.56 | 8.75 | 3200 | This work |
| Hen 2-155 | 6.3 | 0.148 | 7.85 | 8.21 | 1300 | Jones et al. (2015) |
| Hen 2-161 | 11 | 1.01? | 8.06 | 8.34 | 1600 | Jones et al. (2015) |
| Hf 2-2 | 8315 | 0.4 | 7.60 | 7.92 | 700 | Liu et al. (2006b); This work |
| IC 4776 | 1.75 | 9 | 7.80 | 8.57 | 20000 | Sowicka et al. (2017) |
| MPA 1759 | 628 | 0.5 | 7.52 | 8.25 | 740 | This work |
| NGC 5189 | 1.6 | 4.04 | 8.60 | 8.77 | 1000 | García-Rojas et al. (2013) |
| NGC 6326 | 233 | 0.37 | 7.10 | 7.43 | 820 | This work |
| NGC 6337 | 182 | 0.173 | 8.31 | 8.40 | 500 | This work |
| NGC 6778 | 18 | 0.153 | 8.61 | 8.45 | 600 | Jones et al. (2016) |
| Pe 1-9 | 6010 | 0.140 | 7.85 | 7.98 | 740 | This work |
| Ou 5 | 56 | 0.36 | 7.58 | 8.40 | 560 | Corradi et al. (2015) |
5.2.1 Electron density
We have established that close binary central stars and extreme abundance discrepancies are very strongly linked, to the extent that it is surprising to find two or three objects that have close binary central stars and yet a moderate abundance discrepancy. It is of interest, then, to try to determine why these objects depart from the otherwise strong relationship. In addition to the finding that the two nebulae with the lowest adfs have the central stars with the longest periods, we find several other properties that seem distinct from the extreme objects.
First, there is a correlation with electron density. In the current sample, all the objects except Hen 2-283 have electron densities estimated (from the average of available diagnostics) at 1000 cm-3. Hen 2-283 has an electron density about five times higher than the rest of the sample, at 3200 cm-3 compared to the average for the rest of the sample of 720 cm-3. It also has the lowest adf of the sample, only just exceeding the threshold of a factor of 5 which we consider “elevated". In the full sample, the two post-CE objects with moderate discrepancies are NGC 5189 and IC 4776. These too have higher densities than the rest of the nebulae; the median density for the sample of 15 is 820 cm-3, while the densities of NGC 5189 and IC 4776 are 1000 and 10 000 respectively, the latter being by far the highest among the sample.
Considering individual diagnostics, all 15 binary+adf objects have a density estimated from both [O ii] and [S ii]; [Ar iv] and [Cl iii] densities are available for five and seven of the nebulae, respectively. Figure 13 shows ne([O ii]) against ne([S ii]) for the 15 objects, together with the 1:1 relation. This shows that these diagnostics closely agree in 8 objects, but significantly differ in 7 objects, with [O ii] giving a higher density than [S ii] in every case. This is in contrast to the findings of Wang et al. (2004), who examined density diagnostics for a sample of over 100 planetary nebulae, and found close agreement between these two diagnostics over densities ranging from 100 to 104 cm-3. While we used different atomic data for O2+ to that used by Wang et al. (2004), we have verified that this has a negligible effect by recalculating electron densities using their tabulated values of the line ratios, with the newer atomic data; no values differ by more than 5%. The difference can thus be clearly attributed to sample selection: their sample of 102 nebulae included only 2 of the 15 binary+adf nebulae and thus consisted almost entirely of objects where this effect would be small.
The objects where the density diagnostics agree all have densities estimated from [S ii] which are higher than 600 cm-3; this group has an average adf of 16.2. The objects where the diagnostics disagree have densities lower than 600 cm-3, and an average adf of 54. This is further illustrated by Figure 14, which shows the clear relation between adf and density diagnostic divergence.

We therefore conclude that low-density nebulae show the most extreme abundance discrepancy factors, and propose that in these extreme-adf nebulae, recombination of O+ significantly affects the ratio of the 3727/3729 lines. The discrepancy between [O ii] and [S ii] densities will depend on the amount of H-deficient material and its density; where the two diagnostics agree, it could be because there is not enough H-deficient material to affect the [O ii] lines, or that the material has a similar density to the ambient gas. The latter appears to be the case in MPA 1759, for example, where O ii recombination line ratios, which should arise predominantly from the H-deficient clumps, indicate a density similar to the CEL value. The fact that [O ii] is always higher when the two densities do not agree indicates that the H-deficient material is generally denser than the ambient gas.
Barlow et al. (2003) measured recombination line abundances of magnesium in a sample of planetary nebulae including several with large abundance discrepancies for O2+, finding Mg/H abundances close to solar in all cases. They noted that nucleosynthetic processes which might enhance CNONe abundances would not be expected to affect the abundances of third-row elements. Thus, if the recombination lines of oxygen are emitted in cold knots formed in a nova-like outburst, recombination of S+ would not be expected to significantly affect the [S ii] density diagnostic. The difference in abundance discrepancies between second and third row elements also rules out any mechanism for extreme abundance discrepancies that assumes a chemically homogeneous gas; temperature fluctuations (Peimbert 1967, Bautista & Ahmed 2017), quasi-neutral X-ray irradiated regions (Ercolano 2009) and -distributed electrons (Nicholls et al. 2012) could not account for this, although they could still potentially account for non-extreme adfs in H ii regions and PNe.
This finding also suggests that an [O ii] density significantly exceeding the [S ii] density may be used to infer an extreme-adf nebula and hence a close binary central star, even if recombination lines are not detected. For the objects where we obtained only upper limits to the abundance discrepancy, two have this property: H 2-29 and Sab 41 (Table 5). We thus predict that deeper spectra of these two objects in particular should confirm a particularly large adf.

Figure 15 shows adf(O2+) against electron densities from [O ii] and [S ii]. These plots are also consistent with [O ii] giving an overestimated density for high-adf nebulae; the plot for [S ii] shows a strong correlation between density and adf, with a Pearson correlation coefficient of 0.76 between the logarithmic values of each (0.84 if the outlier NGC 5189 is excluded). The plot for [O ii] shows a much weaker correlation, with r=0.38, or 0.54 if NGC 5189 is excluded. This nebula may be an outlier due to it being observed with an aperture that covered a small part of the nebula in a brighter and possibly denser region (García-Rojas et al. 2013) whereas the other values were obtained from long-slit observations covering a larger fraction of the nebula.


To investigate this correlation further, we have compiled the published electron densities for all the objects with measured adfs shown in Figure 9. Figure 16 shows the relation between adf and electron density for the four most commonly used diagnostics, [O ii], [S ii], [Cl iii] and [Ar iv]. Several things are immediately apparent from this figure. First, H ii regions and planetary nebulae occupy distinctly different regions of the diagram. Secondly, there is a clearly delineated triangular region that contains almost all objects, showing that the electron density effectively places an upper limit on the abundance discrepancy factor. The lowest adf values measured are around 1.3, while the highest, excluding a couple of outliers, have values up to adf1.2104n, indicated on the plots with a dashed line. Robertson-Tessi & Garnett (2005) previously suggested a correlation between adf and electron density, with a linear fit to a sample of 24 objects giving adf=7.76103n. And thirdly, the number of objects lying outside the triangular region is much higher for [O ii] than for the other diagnostics. This supports our conclusion that the [O ii] density is less reliable than estimates from third-row elements.
It further appears that planetary nebulae with binary central stars may occupy a region of this parameter space distinct from other planetary nebulae. Because the central star status of many PNe is not known, this relation is much less clear than the distinction between PNe and H ii regions in the plot, but tentatively we suggest that whereas H ii regions have low densities and low adfs, “normal" planetary nebulae have densities covering a large range and low adfs, while PNe with binary central stars have densities covering a large range, and adf roughly inversely proportional to the density. The two populations of planetary nebulae become indistinguishable at high densities, but based on this plot, a number of objects very likely to have close binary central stars are readily identifiable.


5.2.2 Chemical abundances
Models of nebular abundances based on single star evolution predict a strong relationship between N/O and C/O and the mass of the progenitor star. Initially O-rich, AGB stars bring more carbon formed via helium fusion to their surfaces with each successive thermal pulse due to convective overshooting, leading ultimately to C/O ratios exceeding unity for stars with initial masses between about 1.5 and 3 M⊙. Above this, hot-bottom burning (HBB) can burn carbon into nitrogen, leading to lower C/O and higher N/O ratios (Herwig 2005, Karakas & Lattanzio 2014). High N/O ratios indicate Type i planetary nebulae, which are thus believed to originate from higher mass progenitor stars (Peimbert & Torres-Peimbert 1983, Kingsburgh & Barlow 1994).
These relationships break down for post-common envelope objects; the evolution of the surface abundances is terminated when the system enters the common envelope phase, which may occur at any point on the ascent of the AGB. Thus, for post-CE nebulae, a low C/O ratio could be due to early termination of the AGB, or higher initial mass and conversion of C to N via HBB, the value of N/O depending on which is the case. The post-CE population should then, broadly speaking, show systematically lower C/O ratios but have any range of N/O ratio, compared to the overall PN population (De Marco 2009). Hen 2-11 is an example of a system with very low C/O and N/O ratios, consistent with an early termination of post-AGB evolution by the CE phase (Jones et al. 2014).
In the full sample of 15 post-CE objects, we find a correlation between abundance ratios and the magnitude of the adf: the lower the value of N/H or O/H, the higher the observed adf (see Figure 17). In the sample analysed in this work, Hen 2-283 has the highest abundance of both, and the lowest abundance discrepancy. In the full sample, the 5 objects with 12+log(O/H)8.5 have a mean adf of 7.1, while the 10 with 12+log(O/H)8.5 have a mean adf of 48.23. For N/H, the Pearson correlation coefficient is -0.66, with a -value of 0.008, indicating a very low probability of the observed correlation arising by chance; for O/H, the Pearson correlation coefficient is -0.53 with a -value of 0.043 when all 15 objects are included, and -0.79 with a -value of 0.0009 if NGC 6326 is excluded.


In terms of their space distribution, the extreme objects appear fairly similar to the whole Galactic population: 13 of the 15 objects (83%) lie within 60∘ of the Galactic centre, compared to 2629 of 3545 (74%) of all PNe in the HASH catalogue (Parker et al. 2016; Fig. 18). However, their heavy element abundances as measured from CELs are almost all sub-solar, and lower than those generally found for nebulae inside the Solar circle: Kingsburgh & Barlow (1994) found average logarithmic abundances of N and O of 8.35 and 8.68 respectively, whereas for the sample of 15 extreme-adf PNe we find 12+log(|N/H|)=8.11, and 12+log(|O/H|)=8.34. Wesson et al. (2005) found values of 8.08 and 8.54 respectively, for a sample of northern PNe predominantly outside the solar circle.

Values of N/O in the sample of 15 may be weakly anticorrelated with adf: as shown in Figure 19, lower values of N/O are associated with higher adfs. The five objects with log(N/O)0.4 have an average adf of 57.15 (though this group includes IC 4776 with its extremely low adf of 1.75), while the 10 objects with log(N/O)0.4 have an average adf of 27.0 (though this group includes Hf 2-2 and Pe 1-9, both among the extremest of the extremes). The Pearson correlation coefficient for adf against log(N/O) is 0.41, or 0.75 if the outliers Abell 63 and IC 4776 are excluded. The -values of these correlations are 0.13 and 0.003 respectively, the former implying a non-negligible probability of the apparent correlation having arisen by chance from uncorrelated data. The validity of the latter correlation would require the identification of factors clearly dividing both A 63 and IC 4776 from the other 13 objects; currently no such factors are apparent.
The large scatter about a vague anti-correlation may be consistent with the picture in which N/O in post-CE objects is a function of both the mass of the progenitor and the time of termination of the post-AGB evolution. However, important systematic uncertainties in determinations of N/O can arise from the recombination contribution to [O iii] 4363, which would result in an overestimated temperature and underestimated CEL abundances; and also the recombination contribution to [O ii] 3727/3729, which would result in an overestimate of the O+ abundance. This would then cause a moderate overestimate of O/H and a much larger overestimate of N/H. We have recalculated N/O abundances in our sample applying corrections to the line fluxes affected by recombinations, and we find that these weak correlations are only slightly affected; points on the O/H versus adf plot move in the direction of the correlation, while points on the N/O and N/H versus adf plots do not move so much as to obscure the correlation found when corrections are not applied (Fig. 20). Finally, the ionization correction factor proposed by Delgado-Inglada et al. (2014) for N/H was subsequently found to introduce some correlation with ionization degree (Delgado-Inglada et al. 2015), which is not seen with the earlier Kingsburgh & Barlow (1994) ICF. We investigated the effect of the choice of ICF on N/H for our objects and find that this may result in a difference of up to 20% in the value of N/H.


The Ne/O ratio in planetary nebulae is not expected to be affected by nucleosynthetic processes, and is observed to be approximately constant in a wide range of environments (e.g. Henry 1990). However, in our sample of 15, considerable scatter is seen, and Ne/O exceeds the solar value in 13 of the objects. The average value of Ne/O for the 15 PNe of our sample is 0.47, compared to the solar value of 0.61 (Figure 21). This may be due to the probable underestimate of O/H abundances in high adf objects discussed earlier. However, Ne abundances should also be underestimated for the same reason, and we note that large masses of neon were reported in the hydrogen-deficient knots of Abell 30 and Abell 58, comparable to the amounts seen in neon novae (Wesson et al. 2003,Wesson et al. 2008).
We also investigate the C/O ratio; however, where all other abundance ratios discussed in this section are derived from collisionally excited lines, we restrict our discussion of C/O to recombination lines only. Ultraviolet spectra are required to derive C/H from collisionally excited lines; a systematic uncertainty will then result from the inevitable combination of data covering different parts of the nebula. Recombination line ratios may also be subject to a systematic uncertainty when comparing them to CEL ratios, given that the two line types arise from physically distinct regions, but ratios of second row elements to each other appear similar whether derived from RLs or CELs. Figure 22 shows the relation between C/O from RLs and adf, with vertical lines indicating the average values from Kingsburgh & Barlow (1994) (a sample of nebulae predominantly interior to the solar circle) and Wesson et al. (2005) (predominantly exterior to the solar circle). There is no evident correlation between C/O and adf, but most values are below the average values of larger samples of PNe. For N/O, an equal number of the sample have abundance ratios above and below the average of the Kingsburgh & Barlow (1994) sample.


Empirical abundance analysis methods assume a chemically homogenous nebula, and their application to two-phase nebulae introduces systematic uncertainties. To properly assess the extent to which the abundance trends we have found in this section are affected by this will require the creation of tailored three-dimensional photoionization models.
5.2.3 Nebular morphology
As would be expected, given that we are discussing planetary nebulae with binary central stars, the vast majority of the sample with measured adfs are bipolar, with morphologies ranging from canonical bipolars (IC 4776, Ou 5, A 63, Hen 2-283) through to ring nebulae (Fg 1, Necklace, Hen 2-161) and more irregular bipolars (Hen 2-155, NGC 6778). NGC 6326 is particularly irregular, with multiple filamentary structures that make discerning the overall morphology difficult, although the imagery presented by Miszalski et al. (2011b) shows a clear extension in roughly the East-West direction consistent with an elliptical or bipolar structure viewed at an intermediate inclination. The morphology of Abell 46 is somewhat unclear but is hypothesized by Bond & Ciardullo (1990) and Pollacco & Bell (1994) to be most likely a bipolar which has undergone some interaction with the interstellar medium. The morphology of MPA J1759-3007 is similarly unclear, with the imaging of Miszalski et al. (2009a) indicating the possible presence of bipolar lobes protruding from a central overdensity - unfortunately our shallow acquisition imagery shows only the bright central regions preventing us from confirming its bipolarity. As such, only Hf 2-2 and Pe 1-9 represent the possible deviations from bipolarity present in the sample, with both showing multiple shells with a roughly circular projection. However, Miszalski et al. (2009a) concluded that they too are most likely bipolars just viewed pole-on as is the case for NGC 6337, the end-on nature of which has been confirmed spectroscopically (García-Díaz et al., 2009).
As such, given that all (or almost all) of the sample display somewhat bipolar morphologies typical of central star binarity, it is not possible to draw any more specific connection between adf value and nebular morphology.
6 Conclusions
We have carried out a survey of planetary nebulae selected for having known close binary central stars. We have presented in this paper six new discoveries of elevated or extreme abundance discrepancies; the rest of the sample yielded only weak upper limits for the abundance discrepancy. This nearly doubles the sample of objects known to have both an extreme abundance discrepancy and a close binary central star. The selection strategy of our survey alone clearly demonstrates that close binarity and extreme abundance discrepancies are closely linked. We have carried out further statistical analysis of the complete sample of objects with measured adfs, and have found that the population of nebulae with close binary central stars has a distribution of adfs very different from that of the whole population, while for nebulae with hydrogen-deficient central stars, the distribution of adfs is statistically indistinguishable from that of the whole population. This argues strongly against VLTPs as a source of hydrogen-deficient material in planetary nebulae, and in favour of nova-like eruptions.
Given that the relationship between pre- and post-CE orbital parameters is extremely uncertain (Zorotovic et al., 2010; De Marco et al., 2011), it is particularly intriguing that high adfs present an apparent cut-off in post-CE orbital period at around 1.15 d. This cut-off offers support for the hypothesis that CE phases that occur later in the AGB evolution (when the envelope is less bound and thus will require less orbital energy to unbind it) are less likely to lead to whatever process gives rise to the high adfs observed in short-period, post-CE PNe. Furthermore, we find an anticorrelation between N/O and adf55 5 It is worth noting the calculated N/O ratios are rather uncertain, as they rely on the use of ICFs (see section 5.2.2).. Again, this could be seen as support for the hypothesis that early CE phases give rise to the highest adfs as the N/O ratio is expected to rise throughout the progenitor’s AGB evolution. However, it is important to note that there is significant evidence that the PNe observed around post-CE central stars may not represent the entirety of the envelope - with many having measured masses significantly lower than would be expected (Corradi et al., 2011; Corradi et al., 2014). This is perhaps indicative that the envelope is ejected in multiple phases (Soker, 2015, known as a grazing envelope evolution), with only the most recent being observed as a PN. As such, the correlation between short periods and high adfs may be less likely due to the evolutionary phase at which the binary entered the common envelope, but rather a reflection that shorter post-CE periods are required in order for the binary to inject high-metallicity material into the nebula. This would be consistent with the idea that a nova-like process is the origin of these high adfs, with the eruption being driven by material transferred back from the companion (Jones et al., 2015, many of which have been observed to be highly inflated and near Roche-lobe-filling) - something which would occur only in the shortest period systems.
The observed anti-correlation between nebular density and adf may be a result of nebular age, if the density contrast between H-deficient clumps and the ‘normal’ nebula increases with time. This might be expected if the H-deficient material is photo-evaporating from dense neutral cores. Literature estimates of nebular age are only available for Fg 1 (5000 years; Boffin et al. 2012a) and NGC 6337 (20–24 000 years; Hillwig et al. 2010); despite their very different ages, these two nebulae have similar electron densities, and Fg 1 has a much higher adf, which is inconsistent with a simple time evolution of adf. Another possibility is that the adf and the nebular density are both determined by the nature of the CE ejection - a very poorly understood process (Ivanova et al., 2013; Ohlmann et al., 2016; Grichener et al., 2018, see e.g.). Furthermore, it is a complex interplay between ionization and shocks which leads to the formation of the nebular shell from the ejected envelope (García-Segura et al., 2018, see e.g.), and as such, it is not only the ejection process but also the post-CE evolution of the central star that causes the nebula to form. In any case, the results presented here are indicative that an earlier termination of the AGB tends to result in both a higher adf and a lower average electron density.
A possible link between the evolutionary state of the primary upon entering the CE phase and a high adf was previously highlighted by Jones et al. (2016), who pointed out that the highest known adf was observed in Abell 46, a PN where the mass of the central star star is found to lie on the limit between red giant branch (RGB) and AGB core masses. As such, the CE phase in that system must have occurred either on the RGB or on the very early AGB which, given the findings presented here, is unlikely to be coincidental.
We thus conclude that abundance discrepancy factors are a reliable way to infer the presence of a binary central star; any object with an extreme abundance discrepancy should contain one. However, in the contrary hypothesis, binarity is a necessary but not sufficient condition for extreme adfs; the CE event must also occur not too close to the end of the AGB evolution. The latter case would give rise to the post-CE nebulae that have a high electron density and a ‘normal’ adf. Given a planetary nebula with a low measured adf and high electron density but with morphology indicative of binarity, we would predict that the binary period should be much longer than 1 d. A fortuitous test of this latter prediction is possible thanks to the publication, shortly after we first submitted this paper, of the discovery of a binary in the hourglass-shaped nebula planetary nebula MyCn 18 (Miszalski et al. 2018). Based on its measured adf of 1.8, and densities of 5 000–10 000 cm-3 (depending on the diagnostic used; Tsamis et al. 2004), we would have predicted a period much longer than 1 d, and indeed, Miszalski et al. (2018) report a period of 18.15 d.
Acknowledgements
We thank the anonymous referee for their detailed and helpful review. RW was supported by European Research Grant SNDUST 694520. JGR acknowledges support from an Advanced Fellowship from the Severo Ochoa excellence program (SEV-2015-0548). This research has been supported by the Spanish Ministry of Economy and Competitiveness (MINECO) under the grant AYA2017-83383-P. This work is based on observations made with ESO Telescopes at the La Silla Paranal Observatory under programme IDs 087.D-0174(A), 088.D-0573(A), 089.D-0357(A), 090.D-0449(A), 090.D-0693(A), 091.D-0475(A), 092.D-0449(A), 093.D-0038(A), 094.D-0091(A), 096.D-0080(A), 096.D-0234(A), and 097.D-0351(A).
This research made use of NASA’s Astrophysics Data System; the SIMBAD database, operated at CDS, Strasbourg, France; APLpy, an open-source plotting package for python hosted at http://aplpy.github.io; Astropy, a community-developed core python package for Astronomy (Astropy Collaboration et al., 2013); matplotlib, a python library for publication quality graphics (Barrett et al., 2005); CHIANTI, a collaborative project involving George Mason University, the University of Michigan (USA), and the University of Cambridge (UK).
References
- Akras et al. (2015) Akras S., Boumis P., Meaburn J., Alikakos J., López J. A., Gonçalves D. R., 2015, MNRAS, 452, 2911
- Aller & Keyes (1987) Aller L. H., Keyes C. D., 1987, ApJS, 65, 405
- Appenzeller et al. (1998) Appenzeller I., et al., 1998, The Messenger, 94, 1
- Astropy Collaboration et al. (2013) Astropy Collaboration et al., 2013, A&A, 558, A33
- Barlow et al. (2003) Barlow M. J., Liu X.-W., . Péquignot D., Storey P. J., Tsamis Y. G., Morisset C., 2003, in Kwok S., Dopita M., Sutherland R., eds, IAU Symposium Vol. 209, Planetary Nebulae: Their Evolution and Role in the Universe. p. 373
- Barrett et al. (2005) Barrett P., Hunter J., Miller J. T., Hsu J.-C., Greenfield P., 2005, in Shopbell P., Britton M., Ebert R., eds, Astronomical Society of the Pacific Conference Series Vol. 347, Astronomical Data Analysis Software and Systems XIV. p. 91
- Basurah et al. (2016) Basurah H. M., Ali A., Dopita M. A., Alsulami R., Amer M. A., Alruhaili A., 2016, MNRAS, 458, 2694
- Bautista & Ahmed (2017) Bautista M. A., Ahmed E. E., 2017, preprint, (arXiv:1709.07945)
- Boffin et al. (2012a) Boffin H. M. J., Miszalski B., Rauch T., Jones D., Corradi R. L. M., Napiwotzki R., Day-Jones A. C., Köppen J., 2012a, Science, 338, 773
- Boffin et al. (2012b) Boffin H. M. J., Miszalski B., Jones D., 2012b, A&A, 545, A146
- Bond (2000) Bond H. E., 2000, in Kastner J. H., Soker N., Rappaport S., eds, Astronomical Society of the Pacific Conference Series Vol. 199, Asymmetrical Planetary Nebulae II: From Origins to Microstructures. p. 115 (arXiv:astro-ph/9909516)
- Bond & Ciardullo (1990) Bond H. E., Ciardullo R., 1990, in Cacciari C., Clementini G., eds, Astronomical Society of the Pacific Conference Series Vol. 11, Confrontation Between Stellar Pulsation and Evolution. pp 529–533
- Borkowski et al. (1995) Borkowski K. J., Harrington J. P., Tsvetanov Z. I., 1995, ApJ, 449, L143
- Corradi et al. (2011) Corradi R. L. M., et al., 2011, MNRAS, 410, 1349
- Corradi et al. (2014) Corradi R. L. M., et al., 2014, MNRAS, 441, 2799
- Corradi et al. (2015) Corradi R. L. M., García-Rojas J., Jones D., Rodríguez-Gil P., 2015, ApJ, 803, 99
- Davey et al. (2000) Davey A. R., Storey P. J., Kisielius R., 2000, A&AS, 142, 85
- De Marco (2009) De Marco O., 2009, PASP, 121, 316
- De Marco et al. (2011) De Marco O., Passy J.-C., Moe M., Herwig F., Mac Low M.-M., Paxton B., 2011, MNRAS, 411, 2277
- De Marco et al. (2013) De Marco O., Passy J.-C., Frew D. J., Moe M., Jacoby G. H., 2013, MNRAS, 428, 2118
- Delgado-Inglada et al. (2014) Delgado-Inglada G., Morisset C., Stasińska G., 2014, MNRAS, 440, 536
- Delgado-Inglada et al. (2015) Delgado-Inglada G., Rodríguez M., Peimbert M., Stasińska G., Morisset C., 2015, MNRAS, 449, 1797
- Dere et al. (1997) Dere K. P., Landi E., Mason H. E., Monsignori Fossi B. C., Young P. R., 1997, A&AS, 125, 149
- Ercolano (2009) Ercolano B., 2009, MNRAS, 397, L69
- Ercolano et al. (2004) Ercolano B., Wesson R., Zhang Y., Barlow M. J., De Marco O., Rauch T., Liu X.-W., 2004, MNRAS, 354, 558
- Escalante & Victor (1990) Escalante V., Victor G. A., 1990, ApJS, 73, 513
- Escalante et al. (2012) Escalante V., Morisset C., Georgiev L., 2012, MNRAS, 426, 2318
- Esteban et al. (2014) Esteban C., García-Rojas J., Carigi L., Peimbert M., Bresolin F., López-Sánchez A. R., Mesa-Delgado A., 2014, MNRAS, 443, 624
- Ferland (1992) Ferland G. J., 1992, ApJ, 389, L63
- García-Díaz et al. (2009) García-Díaz M. T., Clark D. M., López J. A., Steffen W., Richer M. G., 2009, ApJ, 699, 1633
- García-Rojas & Esteban (2007) García-Rojas J., Esteban C., 2007, ApJ, 670, 457
- García-Rojas et al. (2013) García-Rojas J., Peña M., Morisset C., Delgado-Inglada G., Mesa-Delgado A., Ruiz M. T., 2013, A&A, 558, A122
- García-Rojas et al. (2016) García-Rojas J., Corradi R. L. M., Monteiro H., Jones D., Rodríguez-Gil P., Cabrera-Lavers A., 2016, ApJ, 824, L27
- García-Segura et al. (2018) García-Segura G., Ricker P. M., Taam R. E., 2018, ApJ, 860, 19
- Grichener et al. (2018) Grichener A., Sabach E., Soker N., 2018, MNRAS, 478, 1818
- Henry (1990) Henry R. B. C., 1990, ApJ, 356, 229
- Herwig (2005) Herwig F., 2005, ARA&A, 43, 435
- Hillwig et al. (2010) Hillwig T. C., Bond H. E., Afşar M., De Marco O., 2010, AJ, 140, 319
- Howarth (1983) Howarth I. D., 1983, MNRAS, 203, 301
- Huckvale et al. (2013) Huckvale L., et al., 2013, MNRAS, 434, 1505
- Ivanova et al. (2013) Ivanova N., et al., 2013, A&ARv, 21, 59
- Jones & Boffin (2017) Jones D., Boffin H. M. J., 2017, Nature Astronomy, 1, 0117
- Jones et al. (2014) Jones D., Boffin H. M. J., Miszalski B., Wesson R., Corradi R. L. M., Tyndall A. A., 2014, A&A, 562, A89
- Jones et al. (2015) Jones D., Boffin H. M. J., Rodríguez-Gil P., Wesson R., Corradi R. L. M., Miszalski B., Mohamed S., 2015, A&A, 580, A19
- Jones et al. (2016) Jones D., Wesson R., García-Rojas J., Corradi R. L. M., Boffin H. M. J., 2016, MNRAS, 455, 3263
- Karakas & Lattanzio (2014) Karakas A. I., Lattanzio J. C., 2014, Publ. Astron. Soc. Australia, 31, e030
- Kingsburgh & Barlow (1994) Kingsburgh R. L., Barlow M. J., 1994, MNRAS, 271, 257
- Kisielius et al. (1998) Kisielius R., Storey P. J., Davey A. R., Neale L. T., 1998, A&AS, 133, 257
- Landi et al. (2012) Landi E., Del Zanna G., Young P. R., Dere K. P., Mason H. E., 2012, ApJ, 744, 99
- Lau et al. (2011) Lau H. H. B., De Marco O., Liu X.-W., 2011, MNRAS, 410, 1870
- Liu (2006) Liu X.-W., 2006, in Barlow M. J., Méndez R. H., eds, IAU Symposium Vol. 234, Planetary Nebulae in our Galaxy and Beyond. pp 219–226 (arXiv:astro-ph/0605082), doi:10.1017/S1743921306003000
- Liu et al. (1995) Liu X.-W., Storey P. J., Barlow M. J., Clegg R. E. S., 1995, MNRAS, 272, 369
- Liu et al. (2000) Liu X.-W., Storey P. J., Barlow M. J., Danziger I. J., Cohen M., Bryce M., 2000, MNRAS, 312, 585
- Liu et al. (2006a) Liu X.-W., Barlow M. J., Zhang Y., Bastin R. J., Storey P. J., 2006a, MNRAS, 368, 1959
- Liu et al. (2006b) Liu M. C., Leggett S. K., Golimowski D. A., Chiu K., Fan X., Geballe T. R., Schneider D. P., Brinkmann J., 2006b, ApJ, 647, 1393
- Lopez et al. (1993) Lopez J. A., Meaburn J., Palmer J. W., 1993, ApJ, 415, L135
- Manick et al. (2015) Manick R., Miszalski B., McBride V., 2015, MNRAS, 448, 1789
- McNabb et al. (2016) McNabb I. A., Fang X., Liu X.-W., 2016, MNRAS, 461, 2818
- Mendez & Niemela (1981) Mendez R. H., Niemela V. S., 1981, ApJ, 250, 240
- Mendoza & Zeippen (1982) Mendoza C., Zeippen C. J., 1982, MNRAS, 199, 1025
- Mendoza & Zeippen (1983) Mendoza C., Zeippen C. J., 1983, MNRAS, 202, 981
- Mesa-Delgado et al. (2014) Mesa-Delgado A., Esteban C., García-Rojas J., Reyes-Pérez J., Morisset C., Bresolin F., 2014, ApJ, 785, 100
- Miszalski (2009) Miszalski B., 2009, PhD thesis, Department of Physics, Macquarie University, NSW 2109, Australia
- Miszalski et al. (2009a) Miszalski B., Acker A., Moffat A. F. J., Parker Q. A., Udalski A., 2009a, A&A, 496, 813
- Miszalski et al. (2009b) Miszalski B., Acker A., Parker Q. A., Moffat A. F. J., 2009b, A&A, 505, 249
- Miszalski et al. (2011a) Miszalski B., Acker A., Parker Q. A., Boffin H. M. J., Frew D. J., Mikolajewska J., Moffat A. F. J., Napiwotzki R., 2011a, in Asymmetric Planetary Nebulae 5 Conference.
- Miszalski et al. (2011b) Miszalski B., Jones D., Rodríguez-Gil P., Boffin H. M. J., Corradi R. L. M., Santander-García M., 2011b, A&A, 531, A158
- Miszalski et al. (2018) Miszalski B., Manick R., Mikołajewska J., Van Winckel H., Iłkiewicz K., 2018, Publ. Astron. Soc. Australia, 35, e027
- Nicholls et al. (2012) Nicholls D. C., Dopita M. A., Sutherland R. S., 2012, ApJ, 752, 148
- Ohlmann et al. (2016) Ohlmann S. T., Röpke F. K., Pakmor R., Springel V., 2016, ApJ, 816, L9
- Palmer et al. (1996) Palmer J. W., Lopez J. A., Meaburn J., Lloyd H. M., 1996, A&A, 307, 225
- Parker et al. (2016) Parker Q. A., Bojičić I. S., Frew D. J., 2016, in Journal of Physics Conference Series. p. 032008 (arXiv:1603.07042), doi:10.1088/1742-6596/728/3/032008
- Peimbert (1967) Peimbert M., 1967, ApJ, 150, 825
- Peimbert & Peimbert (2013) Peimbert A., Peimbert M., 2013, ApJ, 778, 89
- Peimbert & Torres-Peimbert (1983) Peimbert M., Torres-Peimbert S., 1983, in Flower D. R., ed., IAU Symposium Vol. 103, Planetary Nebulae. pp 233–241
- Pequignot et al. (1991) Pequignot D., Petitjean P., Boisson C., 1991, A&A, 251, 680
- Pollacco & Bell (1994) Pollacco D. L., Bell S. A., 1994, MNRAS, 267, 452
- Porter et al. (2012) Porter R. L., Ferland G. J., Storey P. J., Detisch M. J., 2012, MNRAS, 425, L28
- Porter et al. (2013) Porter R. L., Ferland G. J., Storey P. J., Detisch M. J., 2013, MNRAS, 433, L89
- Pradhan (1976) Pradhan A. K., 1976, MNRAS, 177, 31
- Robertson-Tessi & Garnett (2005) Robertson-Tessi M., Garnett D. R., 2005, ApJS, 157, 371
- Sarazin et al. (2008) Sarazin M., Melnick J., Navarrete J., Lombardi G., 2008, The Messenger, 132, 11
- Sharpee et al. (2003) Sharpee B., Williams R., Baldwin J. A., van Hoof P. A. M., 2003, ApJS, 149, 157
- Shortridge et al. (2014) Shortridge K., Meyerdierks H., Currie M. J., Davenhall C., Jenness T., Clayton M., 2014, Starlink Figaro: Starlink version of the Figaro data reduction software package, Astrophysics Source Code Library (ascl:1411.022)
- Soker (2015) Soker N., 2015, ApJ, 800, 114
- Sowicka et al. (2017) Sowicka P., Jones D., Corradi R. L. M., Wesson R., García-Rojas J., Santander-García M., Boffin H. M. J., Rodríguez-Gil P., 2017, MNRAS, 471, 3529
- Storey (1994) Storey P. J., 1994, A&A, 282, 999
- Storey & Hummer (1995) Storey P. J., Hummer D. G., 1995, MNRAS, 272, 41
- Storey et al. (2017) Storey P. J., Sochi T., Bastin R., 2017, MNRAS, 470, 379
- Todt et al. (2015) Todt H., et al., 2015, in Dufour P., Bergeron P., Fontaine G., eds, Astronomical Society of the Pacific Conference Series Vol. 493, 19th European Workshop on White Dwarfs. p. 539
- Toribio San Cipriano et al. (2017) Toribio San Cipriano L., Domínguez-Guzmán G., Esteban C., García-Rojas J., Mesa-Delgado A., Bresolin F., Rodríguez M., Simón-Díaz S., 2017, MNRAS, 467, 3759
- Torres-Peimbert et al. (1990) Torres-Peimbert S., Peimbert M., Pena M., 1990, A&A, 233, 540
- Tsamis et al. (2003) Tsamis Y. G., Barlow M. J., Liu X.-W., Danziger I. J., Storey P. J., 2003, MNRAS, 338, 687
- Tsamis et al. (2004) Tsamis Y. G., Barlow M. J., Liu X.-W., Storey P. J., Danziger I. J., 2004, MNRAS, 353, 953
- Viegas & Clegg (1994) Viegas S. M., Clegg R. E. S., 1994, MNRAS, 271, 993
- Wang et al. (2004) Wang W., Liu X.-W., Zhang Y., Barlow M. J., 2004, A&A, 427, 873
- Warren-Smith et al. (2014) Warren-Smith R. F., Draper P. W., Taylor M., Allan A., 2014, CCDPACK: CCD Data Reduction Package, Astrophysics Source Code Library (ascl:1403.021)
- Weidmann & Gamen (2011) Weidmann W. A., Gamen R., 2011, A&A, 526, A6
- Wesson (2016) Wesson R., 2016, MNRAS, 456, 3774
- Wesson et al. (2003) Wesson R., Liu X.-W., Barlow M. J., 2003, MNRAS, 340, 253
- Wesson et al. (2005) Wesson R., Liu X.-W., Barlow M. J., 2005, MNRAS, 362, 424
- Wesson et al. (2008) Wesson R., Barlow M. J., Liu X.-W., Storey P. J., Ercolano B., De Marco O., 2008, MNRAS, 383, 1639
- Wesson et al. (2012) Wesson R., Stock D. J., Scicluna P., 2012, MNRAS, 422, 3516
- Wyse (1942) Wyse A. B., 1942, ApJ, 95, 356
- Zeippen (1982) Zeippen C. J., 1982, MNRAS, 198, 111
- Zorotovic et al. (2010) Zorotovic M., Schreiber M. R., Gänsicke B. T., Nebot Gómez-Morán A., 2010, A&A, 520
- van Dokkum (2001) van Dokkum P. G., 2001, PASP, 113, 1420
Appendix A Observing logs
| PN | Position | Grism | Exposure | Modified | Airmass |
|---|---|---|---|---|---|
| angle () | time (s) | Julian Date | |||
| A 41 | 20 | 1200B | 1200 | 56774.161 | 1.805 |
| A 41 | 20 | 1200R | 120 | 56774.176 | 1.605 |
| A 63 | –35 | 1200B | 1200 | 56822.300 | 1.344 |
| A 63 | –35 | 1200R | 120 | 56822.315 | 1.362 |
| A 65 | 45 | 1200B | 600 | 56827.352 | 1.100 |
| A 65 | 45 | 1200R | 60 | 56827.360 | 1.125 |
| Bl 3-15 | 0 | 1200B | 1200 | 56817.032 | 2.093 |
| Bl 3-15 | 0 | 1200R | 120 | 56817.047 | 1.831 |
| BMP 1800-3407 | 0 | 1200B | 1200 | 56772.246 | 1.220 |
| BMP 1800-3407 | 0 | 1200R | 120 | 56772.261 | 1.161 |
| BMP 1801-2947 | 0 | 1200B | 1200 | 56772.347 | 1.005 |
| BMP 1801-2907 | 0 | 1200R | 120 | 56772.362 | 1.005 |
| DS 1 | –45 | 1200B | 1250 | 57385.237 | 1.453 |
| DS 1 | –45 | 600RI | 120 | 57385.253 | 1.365 |
| Fg 1 | –14 | 1200B | 300 | 57378.327 | 1.268 |
| Fg 1 | –14 | 600RI | 120 | 57378.324 | 1.284 |
| HaTr 4 | 0 | 1200B | 1200 | 56731.319 | 1.255 |
| HaTr 4 | 0 | 1200R | 120 | 56731.334 | 1.213 |
| H 2-29 | –30 | 1200B | 1200 | 56818.172 | 1.052 |
| H 2-29 | –30 | 1200R | 120 | 56818.187 | 1.031 |
| Hen 2-11 | 25 | 1200B | 2500 | 57312.336 | 1.456 |
| Hen 2-11 | 25 | 600RI | 120 | 57312.366 | 1.274 |
| Hen 2-283 | 0 | 1200B | 1200 | 56789.303 | 1.014 |
| Hen 2-283 | 0 | 1200R | 120 | 56789.318 | 1.020 |
| Hen 2-428 | 15 | 1200B | 1200 | 56822.269 | 1.312 |
| Hen 2-428 | 15 | 1200R | 120 | 56822.290 | 1.328 |
| Hf 2-2 | 0 | 1200B | 120 | 56827.298 | 1.090 |
| Hf 2-2 | 0 | 1200R | 120 | 56827.313 | 1.135 |
| JaSt 66 | 0 | 1200B | 1200 | 56806.368 | 1.250 |
| JaSt 66 | 0 | 1200R | 120 | 56806.383 | 1.337 |
| K 1-2 | –90 | 1200B | 2500 | 57357.192 | 1.899 |
| K 1-2 | –90 | 600RI | 120 | 57357.222 | 1.522 |
| K 6-34 | –167 | 1200B | 120 | 56827.257 | 1.062 |
| K 6-34 | –167 | 1200R | 120 | 56827.272 | 1.096 |
| Lo 16 | 0 | 1200B | 1800 | 56822.215 | 1.041 |
| Lo 16 | 0 | 1200R | 300 | 56822.237 | 1.058 |
| M 2-19 | 80 | 1200B | 1200 | 56818.199 | 1.014 |
| M 2-19 | 80 | 1200B | 300 | 56818.217 | 1.005 |
| M 3-16 | 40 | 1200B | 1500 | 56845.010 | 1.402 |
| M 3-16 | 40 | 1200R | 180 | 56845.031 | 1.267 |
| MPA 1759-3007 | 0 | 1200B | 1200 | 56770.377 | 1.010 |
| MPA 1759-3007 | 0 | 1200R | 120 | 56770.392 | 1.023 |
| MPA 1508-6455 | 0 | 1200B | 1200 | 56735.355 | 1.316 |
| MPA 1508-6455 | 0 | 1200R | 120 | 56735.370 | 1.327 |
| NGC 2346 | 15 | 1200B | 2500 | 57309.278 | 1.892 |
| NGC 2346 | 15 | 600RI | 120 | 57309.309 | 1.517 |
| NGC 6026 | 25 | 1200B | 600 | 56731.252 | 1.344 |
| NGC 6026 | 25 | 1200R | 60 | 56731.260 | 1.297 |
| NGC 6326 | –45 | 1200B | 600 | 56735.383 | 1.152 |
| NGC 6326 | –45 | 1200R | 60 | 56735.391 | 1.142 |
| NGC 6337 | 0 | 1200B | 600 | 56749.300 | 1.162 |
| NGC 6337 | 0 | 1200R | 60 | 56749.309 | 1.137 |
| Pe 1-9 | 0 | 1200B | 1200 | 56806.157 | 1.165 |
| Pe 1-9 | 0 | 1200R | 120 | 56806.172 | 1.113 |
| PHR 1744-3355 | 0 | 1200B | 1200 | 56774.193 | 1.432 |
| PHR 1744-3355 | 0 | 1200R | 120 | 56774.208 | 1.332 |
| PHR 1756-3342 | 0 | 1200B | 1200 | 56770.257 | 1.185 |
| PHR 1756-3342 | 0 | 1200R | 1200 | 56770.272 | 1.133 |
| PHR 1757-2824 | 0 | 1200B | 1200 | 56770.306 | 1.045 |
| PHR 1757-2824 | 0 | 1200R | 120 | 56770.321 | 1.023 |
| PHR 1759-2915 | 0 | 1200B | 1200 | 56770.349 | 1.005 |
| PHR 1759-2915 | 0 | 1200R | 120 | 56770.364 | 1.004 |
| PHR 1801-2947 | 0 | 1200B | 1200 | 56772.370 | 1.005 |
| PHR 1801-2947 | 0 | 1200R | 120 | 56772.385 | 1.016 |
Observing log PN Position Grism Exposure Modified Airmass angle () time (s) Julian Date PHR 1804-2645 0 1200B 1200 56772.397 1.027 PHR 1804-2645 0 1200R 120 56772.412 1.051 PM 1-23 -55 1200B 2500 57297.346 1.291 PM 1-23 -55 600RI 1200 57297.376 1.153 PPA 1747-3435 0 1200B 1200 56827.230 1.035 PPA 1747-3435 0 1200R 120 56827.245 1.055 PPA 1759-2834 0 1200B 1200 56770.398 1.028 PPA 1759-2834 0 1200R 120 56770.413 1.052 Sab 41 30 1200B 1200 56792.329 1.041 Sab 41 30 1200R 120 56792.344 1.063 Sp 1 0 1200B 600 56740.371 1.126 Sp 1 0 1200R 60 56740.379 1.132
Appendix B Spatially integrated line fluxes
| Ion | Ion | Multiplet | Lower term | Upper term | g1 | g2 | |||||
|---|---|---|---|---|---|---|---|---|---|---|---|
| 3677.94 | 3676.36 | 2.663 | 0.656 | 3.038 | H i | H22 | 2p+ 2P* | 22d+ 2D | 8 | * | |
| 3723.23 | 3721.63 | 2.628 | 0.450 | 3.581 | [S iii] | F2 | 3p2 3P | 3p2 1S | 3 | 1 | |
| 3721.94 | * | * | H i | H14 | 2p+ 2P* | 14d+ 2D | 8 | * | |||
| 3727.63 | 3726.03 | 4.488 | 0.801 | 7.170 | [O ii] | F1 | 2p3 4S* | 2p3 2D* | 4 | 4 | |
| 3730.42 | 3728.82 | 5.011 | 0.740 | 6.260 | [O ii] | F1 | 2p3 4S* | 2p3 2D* | 4 | 6 | |
| 3751.76 | 3750.15 | 4.208 | 0.786 | 7.030 | H i | H12 | 2p+ 2P* | 12d+ 2D | 8 | * | |
| 3761.48 | 3759.87 | 2.186 | 0.563 | 3.055 | O iii | V2 | 3s 3P* | 3p 3D | 5 | 7 | |
| 3772.19 | 3770.63 | 4.251 | 0.566 | 3.877 | H i | H11 | 2p+ 2P* | 11d+ 2D | 8 | * | |
| 3799.47 | 3797.90 | 4.806 | 0.447 | 5.713 | H i | H10 | 2p+ 2P* | 10d+ 2D | 8 | * | |
| 3821.20 | 3819.62 | 2.334 | 0.702 | 3.363 | He i | V22 | 2p 3P* | 6d 3D | 9 | 15 | |
| .. | .. | .. | .. | .. | .. | .. | .. | .. | .. | .. | .. |
| .. | .. | .. | .. | .. | .. | .. | .. | .. | .. | .. | .. |