ASASSN-14dq: A fast-declining type II-P Supernova in a low-luminosity host galaxy
Abstract
Optical broadband (UBVRI) photometric and low-resolution spectroscopic observations of the type II-P supernova (SN) ASASSN-14dq are presented. ASASSN-14dq exploded in a low-luminosity/metallicity host galaxy UGC 11860, the signatures of which are present as weak iron lines in the photospheric phase spectra. The SN has a plateau duration of 90 d, with a plateau decline rate of 1.38 in V-band which is higher than most type II-P SNe. ASASSN-14dq is a luminous type II-P SN with a peak -band absolute magnitude of –17.70.2 mag. The light curve of ASASSN-14dq indicates it to be a fast-declining type II-P SN, making it a transitional event between the type II-P and II-L SNe. The empirical relation between the steepness parameter and mass for type II SNe was rebuilt with the help of well-sampled light curves from the literature. A mass of 0.029 M⊙ was estimated for ASASSN-14dq which is slightly lower than the expected mass for a luminous type II-P SN. Using analytical light curve modelling, a progenitor radius of cm, an ejecta mass of and a total energy of ergs was estimated for this event. The photospheric velocity evolution of ASASSN-14dq resembles a type II-P SN, but the Balmer features (H and H) show relatively slow velocity evolution. The high-velocity H feature in the plateau phase, the asymmetric H emission line profile in the nebular phase and the inferred outburst parameters indicate an interaction of the SN ejecta with the circumstellar material (CSM).
Keywords:
supernovae: general supernovae: individual: ASASSN-14dq galaxies: individual: UGC 118601 Introduction
Core collapse supernovae (CCSNe) are catastrophic events that mark the end of stellar evolution in massive stars (Heger et al., 2003, M 8 ,). CCSNe result when the thermal energy content of the star is unable to prevent self-gravitational collapse, i.e at the end of nuclear burning. CCSNe are broadly divided into two types: hydrogen-rich (II-P, II-L, IIb, IIn) and hydrogen-deficient (Ib, Ic, Ibn) (Minkowski, 1941; Filippenko, 1997). The most common sub-type of CCSNe is II-P (Li et al., 2011), which results from a star that retained most of its hydrogen envelope at the time of the explosion resulting in the presence of prominent hydrogen Balmer lines in the spectra. Light curves of these SNe are characterized by a distinctive flat spread (called the ‘plateau’phase) where the luminosity stays almost constant for an extended period of time (Barbon et al., 1979, 100 days). During the shock breakout, the hydrogen in the envelope gets ionized. As the envelope expands, the recombination wave moves inwards (in mass), staying at roughly the same radius and temperature. Recombination provides the major source of energy by allowing the stored energy to be radiated (Dessart & Hillier, 2010) once the envelope cools enough for the hydrogen to recombine. The recombination process competes with the homologously expanding (and hence cooling) ejecta, resulting in the presence of a plateau phase in a type II-P SN. We use the definition of plateau duration as the optically thick phase duration (OPTd), which spans from the time of the explosion till the start of the transition to the radioactive tail (Anderson et al., 2014).
At the end of the recombination phase i.e. when the recombination front meets the inner denser material, the SN settles onto a slowly declining radioactive phase after experiencing a significant drop in luminosity, which depends on the amount of radioactive synthesized in the explosion. Type II SNe generally follow the decay rate of in the nebular phase (Turatto et al., 1990). Based on the amount of hydrogen in the envelope, type II-P SNe show a wide variety in plateau duration, plateau luminosity and expansion velocities (Hamuy, 2003; Anderson et al., 2014; Faran et al., 2014a). These observational parameters are directly connected to the explosion parameters and can help infer the properties of the progenitor star (Sanders et al., 2015).
Hydrodynamical modelling of some well-studied type II-P SN light curves (LC) have suggested that a red supergiant (RSG) progenitor with an extended hydrogen envelope is essential for producing the plateau in the light curves (Grassberg et al., 1971; Chevalier, 1976). Modelling of such SNe has predicted progenitors with masses ranging from 15-25 (Bersten et al., 2011; Morozova et al., 2015) although, the estimates of masses of progenitors from direct imaging has been limited to 9–17 (Smartt, 2009).
Type II-P SNe have a great potential as a standard candle (next only to type Ia) for extra-galactic distance estimation owing to their well-studied theoretical models along with the extensive observational study performed on a large sample of them. The two most commonly used techniques are the standard candle method (Hamuy & Pinto, 2002, SCM) and the expanding photosphere method (Kirshner & Kwan, 1974, EPM), which was improved later by (Hamuy et al., 2001; Dessart & Hillier, 2005b). The SCM is based on an observationally determined relation between luminosity and the expansion velocity of a type II-P SN. The EPM relates the photospheric and the angular radii of a supernova in order to derive its distance. The effect of progenitor metallicity on type II SNe spectra for a standard Red Supergiant (RSG) explosion has been studied in the past (Dessart & Hillier, 2005a; Kasen & Woosley, 2009; Dessart et al., 2013). Metal lines appearing in type II SNe during the recombination phase helps constrain metallicity of the progenitor star as the region probed during its photospheric evolution retains the composition of the progenitor (Dessart et al., 2013; Dessart et al., 2014; Anderson et al., 2016, hereafter D13, D14 and A16, respectively). Type II SNe arising from progenitors with lower metallicity display fewer and weaker (low Equivalent-Width, EW) metal lines.
Although type II-P SNe were originally considered to be part of a different population than the type II-L, the distribution of type II SNe seems to form a continuous distribution according to many authors (Patat et al., 1994; Anderson et al., 2014; Sanders et al., 2015). Arcavi et al. (2012) pointed out the presence of type II-L and type II-P SNe as two contrasting populations based on their -band light curve. Faran et al. (2014a); Faran et al. (2014b) also pointed towards the differences between the two sub-types through their spectroscopic evolution. Faran et al. (2014b) highlighted the slow evolving H line velocities and the presence of weak hydrogen absorption lines in type II-L SNe in comparison with type II-P SNe, although they agreed with the continuum of photometric features seen in type II SNe. The primary characterizing difference between the two sub-types is the fast declining light curve in a type II-L SN, which is seen as a result of less amount of hydrogen (1-2 ) in the envelope (Blinnikov & Bartunov, 1993). The inference of Faran et al. (2014b) also signify a hydrogen-poor envelope in type II-L SNe and is consistent with the excessive mass-loss rate associated with the higher Zero-Age main sequence (ZAMS) mass of a type II-L SN progenitor compared to that of a type II-P progenitor (Elias-Rosa et al., 2010; Elias-Rosa et al., 2011). However, Maund et al. (2015) discovered that the previously thought progenitor of type II-L SN 2009kr (Elias-Rosa et al., 2010) is actually a small compact cluster.
Morozova et al. (2017), based on numerically investigating the broadband light curves of RSGs with CSM argued that type II-L SNe might also result from the presence of dense CSM close to the progenitor star. They also highlight the fact that the sharp density gradient between the wind and the underlying RSG model is required for high decline rate in the light curves, and that the large radius of the progenitor is not sufficient enough to reproduce that change. The presence of continuity in the wind properties of progenitor stars show agreement with the continuum of light curve properties seen in type II SNe (Anderson et al., 2014).
In order to classify type II SNe, Faran et al. (2014b), defined a parameter s, which is the magnitude decline in the -band light curve between the maximum and 50 days after the explosion. Type II-P SNe were classified as having an s 0.5. Valenti et al. (2015) also differentiated the two sub-types using the same parameter but with a higher cut-off, i.e s1.0 for type II-P SNe. Patat et al. (1994) differentiated the sub-types based on their -band decline rates and classified type II SNe with as type II-P SNe. Type II-L SNe are also, in general, more luminous (at maximum) compared to type II-P SNe on an average by 1.5 mag (Patat et al., 1994; Richardson et al., 2002; Anderson et al., 2014). Using the data from Lick Observatory Supernova Search (LOSS), Li et al. (2011) inferred an average absolute magnitude (at maximum) of –15.660.16 ( = 1.23) for type II-P SNe and –17.440.22 for type II-L SNe. Anderson et al. (2014) also computed an average peak -band magnitude of –16.74 mag ( = 1.01 mag) for type II SNe.
Due to an increased number of sky surveys, the detection of SNe (and hence type II SNe) in the recent past have increased. With the increased amount of published light curves showing a continuum of properties, the classification of type II SNe still remains an open question. Valenti et al. (2015) suggest that a clear distinction in the masses of the hydrogen envelope of type II-P and type II-L SNe will direct towards the possibility of a phase in stellar evolution that strips a star of discrete chunks of hydrogen. This motivates the observational monitoring and detailed analysis of more type II SNe in order to better understand the distinction between the two sub-types. ASASSN-14dq is interesting in the fact that it exploded in a low-luminosity host galaxy UGC 11860 unlike most type II SNe.

ASASSN-14dq was discovered in images obtained on 2014 July 08.48 UT in the dwarf galaxy UGC 11860 by the quadruple 14-cm “Brutus” telescope in Haleakala, Hawaii of the All Sky Automated Survey for SuperNovae (ASAS-SN) and was reported in the Astronomer’s Telegram (Stanek et al., 2014). ASASSN-14dq lies 9″(1.6 kpc) from the center of the host galaxy UGC 11860 (z = 0.010, luminosity distance d = 38.5 Mpc). The transient was reported to have an absolute -band magnitude of approximately on discovery. Spectroscopic data obtained (Arcavi et al., 2014) on 2014 July 9.5 UT with the FLOYDS low-resolution spectrograph mounted on the Faulkner Telescope North displayed a blue continuum having broad hydrogen P-Cygni features with an absorption minimum at 10000 . Superfit (Howell et al., 2005), a supernovae spectrum fitting code matched the above spectrum with an early spectrum of the type IIb SN 1993J at the redshift of the host galaxy, but it was too early to be sure of the precise sub-type of ASASSN-14dq.
In this paper, we present detailed photometric and spectroscopic analysis of ASASSN-14dq having a very well-sampled photometric coverage during the transitional phase, which is rarely the case because of its short duration (10 d). In Section 2, we describe the optical observations of ASASSN-14dq along with a brief outline of the data reduction procedure. In Section 3, we discuss the properties of the host galaxy, and estimate the reddening along the line-of-sight and the distance to the host galaxy. Spectroscopic analysis of ASASSN-14dq is presented in Section 5. We rebuild the empirical relation between the steepness parameter and mass for type II SNe and estimate mass for ASASSN-14dq in Section 6. We fit the bolometric light curve of ASASSN-14dq using an analytical model and extract outburst parameters in Section 7. We compare ASASSN-14dq with well-studied type II SNe from literature in Section 8. We summarize the results obtained in this paper in Section 9.
| Parameters | Value | Ref. |
| ASASSN-14dq: | ||
| RA (J2000) | 3 | |
| DEC (J2000) | 3 | |
| Galactocentric Location | 37 E, 81 N | 3 |
| Discovery Date | = 2014 July 08.48 (UTC) | 3 |
| (JD 2456846.98) | ||
| Explosion Date | = 2014 July 03.00 (UTC) | 1 |
| (JD 2456841.505.5) | ||
| Peak Magnitude | = –17.70.2 mag | 1 |
| Total reddening | = 0.06010.0006 mag | 1 |
| UGC 11860: | ||
| Alternate name | MCG +04-51-014, PGC067733 | 2 |
| Type | Sdm | 4 |
| RA (J2000) | 2 | |
| DEC (J2000) | 2 | |
| Red-shift | z = 0.0104240.000010 | 2 |
| Luminosity Class | LC IV-V | 4 |
| Luminosity Distance | D = 44.83.1 Mpc | 1 |
| Distance modulus | = 33.250.15 mag | 1 |
(1) This paper; (2) Karachentsev & Makarov (1996); (3) Stanek et al. (2014); (4) de Vaucouleurs et al. (1991).
2 Observation and Data Reduction
2.1 Photometry
Photometric monitoring of ASASSN-14dq started on 2014 July 15 (JD 2456854.3). The broadband photometric observations in Bessell bands were carried out at 34 epochs using the Himalayan Faint Object Spectrograph Camera (HFOSC), mounted on the 2-m Himalayan Chandra Telescope (HCT), situated at the Indian Astronomical Observatory (IAO), Hanle, India. The camera is equipped with a SITe CCD chip having a dimension of 2048 4096 pixels. The readout noise and gain of the camera are 4.87 and 1.22 /ADU, respectively. The central 2048 2048 pixels of the CCD cover a field-of-view (FOV) of 10′ 10′ and was used for photometric observations. Several bias and sky flat frames were obtained in addition to the object frames. Data reduction software IRAF11 1 IRAF is distributed by the National Optical Astronomy Observatory, which is operated by the Association of Universities for Research in Astronomy (AURA) under a cooperative agreement with the National Science Foundation. was used for performing routine pre-processing tasks of bias-subtraction, flat-fielding, and cosmic ray removal. During the nebular phase of the supernova, multiple object frames were obtained in the same band and were combined (after aligning) to improve the signal-to-noise ratio (SNR) in the resultant object frame.
The secondary standard stars in the SN field were calibrated using Landolt photometric standards (Landolt, 1992) PG0231+051, PG0918+029, and PG0942-029. The Landolt standards and the SN field were observed on two photometric nights 2014 November 17 and 23, to obtain transformation coefficients. Aperture photometry was performed on the stars in the standard fields and the SN field using the phot task in IRAF. The photometry was done at two different apertures - FWHM of the stellar profile and 4 times the FWHM of the stellar profile, to calculate the aperture correction.
The average atmospheric extinction coefficients for the site, in each of the Bessell , , , and bands were adopted from Stalin et al. (2008). The zero points were determined using the average colour terms for the telescope detector system. These were used to calibrate the secondary standards in the SN field. The calibrated magnitudes along with the uncertainty of the secondary standards in the SN field are mentioned in Table 8. The magnitudes of ASASSN-14dq were determined using point-spread function (PSF) photometry available with the DAOPHOT package in IRAF.
The last non-detection of ASASSN-14dq was in images taken on 2014 June 27.49 UT. Therefore, we adopt the date mid-way between the non-detection and detection of the supernova as its explosion date, JD = 2456841.50 5.5 (i.e. 2014 July 03.0 UT).
2.2 Spectroscopy
The spectroscopic monitoring of ASASSN-14dq from HCT started on 2014 July 16 (JD 2456855.4). Low-resolution spectroscopic observations were carried out on 23 epochs with the HFOSC using grisms Gr7 (3500–7800 Å) and Gr8 (5200–9250 Å). Bias subtraction and cosmic ray correction were performed on all the raw two-dimensional images. One-dimensional spectra were extracted optimally (Horne, 1986) from the original two-dimensional images using the package twodspec in IRAF. Arc lamp spectra FeAr and FeNe were used for wavelength calibration. Night sky emission lines 5577, 6300 and 6363 were used to cross-check the wavelength calibration and small shifts were applied wherever necessary. Instrumental response curves were generated using spectra of spectrophotometric standards (Feige110 and Feige 34) and were used for flux calibrating the supernova spectra. The nights on which the standards were not observed, the response curves from the adjacent nights were used. Flux calibrated spectra were scaled using magnitudes obtained through photometric observations from HCT and brought to an absolute flux scale. For the epochs with observations in both the grisms, a single flux calibrated one-dimensional spectrum was generated by combining the spectra in the two grisms with a common overlap region. The telluric lines were not removed from the spectra.
3 Host-galaxy - UGC 11860
| Technique | Filter | Magnitude | Color | Color Value | 12 + log(O/H) | Reference |
|---|---|---|---|---|---|---|
| (mag) | (mag) | (dex) | (Technique) | |||
| LZ1 | -17.500.52 | – | – | 8.200.39 | 2 | |
| LZ2 | -17.500.52 | – | – | 8.480.04 | 1 | |
| LCZ | -17.340.15 | 0.23 | 8.480.07 | 3 | ||
| LCZ | -15.740.15 | 1.25 | 8.430.07 | 3 | ||
| Mean | – | – | – | 8.400.18 |
(1) Tremonti et al. (2004); (2) Berg et al. (2012); (3) Sanders et al. (2013).
ASASSN-14dq was discovered in the host galaxy UGC 11860, also known as PGC067733 and MCG +04-51-014. The galaxy is located at a redshift of 0.010424, which was inferred using the 21-cm neutral hydrogen line measurements (Theureau et al., 1998).
3.1 Line-of-sight Extinction
To derive the explosion parameters of the supernova, reddening along the line-of-sight (LOS) of the ASASSN-14dq due to the Milky Way (MW) and the host galaxy (UGC 11860) must be estimated. Galactic reddening was obtained from IRSA22 2 NASA/IPAC Infrared Space Archive http://irsa.ipac.caltech.edu/applications/DUST/ using the dust-extinction map by Schlafly & Finkbeiner (2011), which is a re-calibration of the dust map by Schlegel et al. (1998). The re-calibration assumes Fitzpatrick (1999) extinction law and states that for a low value of reddening, the values obtained from Schlegel et al. (1998) are generally an overestimate to the Milky Way reddening. A Galactic reddening of = 0.0600.001 mag is estimated by Schlafly & Finkbeiner (2011) in the direction of ASASSN-14dq.
The value of reddening in the direction of the SN was also computed by measuring EW of the interstellar Na I D absorption feature (Poznanski et al., 2012) present in the early phase spectra of ASASSN-14dq. The EW of the Na I D absorption feature was found to be 0.20 Å in the spectrum taken on 2014 July 30. Using the relation given in Barbon et al. (1990), we obtain an = 0.05 mag, which is in good agreement with the value from the dust map. To estimate the host galaxy reddening, we looked for the narrow Na I D interstellar absorption feature at the redshift of the host galaxy in the spectrum with the highest SNR in our data-set. The Na I D feature at the redshift of the host galaxy UGC 11860 is barely distinguishable from the continuum and is consistent with the absence of Na I D feature in the spectra of ASASSN-14dq in Valenti et al. (2016). Although estimating dust extinction using Na I D is unreliable and could also be a result of the low resolution of the spectra (Poznanski et al., 2011), undetectable Na I D features are typically representative of minimal reddening from the host (Phillips et al., 2013). Hence, we infer that the host galaxy reddening is negligible compared to the Galactic reddening.
We used the “colour method” by Olivares et al. (2010) to further constrain the reddening due to the host galaxy. The technique assumes that the the intrinsic colour at the end of the plateau phase is a constant for type II-P SNe, as they should reach the same hydrogen recombination temperature during that phase. The host colour excess was found from the observed colour, which is related to the visual extinction through the relation by Olivares et al. (2010):
| (1) |
The mean observed colour at the end of the plateau phase (86.5 d) after correcting for Galactic reddening gives an = 0.330.21 mag. This corresponds to an = 0.110.07 mag, assuming = 3.1, which is in contrast with the absence of the Na I D absorption at the redshift of the host galaxy. This discrepancy can be explained from the significant differences in hydrogen recombination temperature occurring across type II-P SNe during the plateau phase depending on their H/He abundance ratio (Arnett, 1996). Hence, the observed colour excess corrected for Galactic reddening might not necessarily result in a reliable estimate of the host galaxy extinction. As a result, we infer the contribution to the total reddening to be purely Galactic in origin and use an =0.06 mag for total reddening.
3.2 Distance
Various distance estimates to the host galaxy UGC 11860 are available on the NED33 3 https://ned.ipac.caltech.edu website. Due to the absence of a redshift-independent distance estimate, we use the Hubble flow distances estimated for UGC 11860, assuming = 70 . The distance estimates to UGC 11860 in the literature are: 45.73.2 Mpc after correcting for Virgo infall only and 44.93.1 Mpc after correcting for Virgo and Great Attractor in-fall (Mould et al., 2000); 46.83.3 Mpc after correcting for Local Group velocity (Karachentsev & Makarov, 1996) and 38.22.7 Mpc from the Cosmic Microwave Background (CMB) dipole model (Fixsen et al., 1996).
To estimate the distance using the observed supernova parameters, we use the SCM technique. SCM comes from a correlation of the expansion velocities of the ejecta of type II-P SNe with the bolometric luminosity in the plateau phase (Hamuy & Pinto, 2002). For our calculations, we use the refined SCM method proposed by Nugent et al. (2006), where colour used to perform extinction correction is measured during the mid-plateau phase and not at the end of the plateau phase. The expected absolute magnitude is obtained from the following relation:
| (2) |
where = 6.690.50, = 0.53 and = 17.490.08 mag. Using mid-plateau expansion velocity, = 4910100 , mid-plateau colour of 0.630.02 and mid-plateau apparent magnitude, = 15.800.02, we obtain a distance modulus, = 33.370.17 corresponding to a distance of 47.23.6 Mpc. Henceforth, we use the mean of all available distances, i.e. 44.83.1 Mpc ( = 33.250.15 mag) as the distance estimate to the source. All the distance estimates to the host galaxy UGC 11860 are mentioned in Table 10.
3.3 Properties of the host galaxy


UGC 11860 is a characteristically asymmetric and completely bulgeless late-type spiral with an unclear spiral structure, classified as an “Sdm” in the RC3 (de Vaucouleurs et al., 1991). The photometric details of the galaxy were obtained from NED and are mentioned in Table 1. A mean surface brightness of 24.70 classifies UGC 11860 as a low-surface-brightness galaxy. UGC 11860 has an absolute -band magnitude of –17.500.52 and absolute -band magnitude of –17.250.15, which characterizes it as a low-luminosity dwarf galaxy (Arcavi et al., 2010). The galaxy’s polar axis is inclined at an angle of 75 degrees with the line-of-sight. Although the nucleus of the galaxy is not well-defined, using the centre as the region of highest surface brightness in the -band image, the SN exploded 37 East and 81 North from the centre. The isophotal diameter (at = 25 ) is 92.9 (de Vaucouleurs et al., 1991) and corresponds to 20 kpc at the distance of the galaxy, which labels it as a large late-type spiral (see Fig. 2).
As no direct metallicity measurements for UGC 11860 are available in the literature, we estimate metallicity of UGC 11860 using various luminosity-metallicity relations. Berg et al. (2012) computed oxygen abundances for low-luminosity galaxies () through a luminosity-metallicity (LZ1) relation using their absolute -band magnitudes (Eqn. 3). A luminosity-metallicity (LZ2) relation (Eqn. 4) was also obtained by Tremonti et al. (2004) for low-redshift (z0.1) star-forming galaxies using a sample of roughly 53,000 SDSS44 4 Sloan Digital Sky Survey galaxies.
| (3) | |||
| (4) |
We used the aforementioned relations to compute the oxygen abundance of the host galaxy UGC 11860. We also estimated the host oxygen abundance through the luminosity-colour-metallicity (LCZ) relation of Sanders et al. (2013) which has less intrinsic scatter compared to the LZ2 relation. This is due to the inclusion of the colour term which correlates highly with galaxy mass-to-light ratio and helps reduce the scatter in the relation occurring due to differences in star formation rate (SFR) of galaxies. UGC 11860 fits the selection criteria used by Sanders et al. (2013) for their sample i.e. the Galactic extinction corrected -band magnitude of UGC 11860 is less (brighter) than 17.77 mag. We used the magnitudes of UGC 11860 from the SDSS Data Release-14 (Abolfathi et al., 2018) to compute its oxygen abundance.
The host oxygen abundance obtained through different techniques and their mean value is mentioned in Table 2. The mean oxygen abundance obtained is 8.400.12 and is lower than the solar value of 8.690.05 (Asplund et al., 2009). Due to the existence of metallicity gradients in galaxies (Pilyugin et al., 2004), we expect our metallicity estimate to act as an upper bound for the metallicity estimate of the host environment (and/or the progenitor) as ASASSN-14dq lies at a projected distance of 1.6 kpc away from the centre of the UGC 11860. In Fig. 3, we plotted the oxygen abundance of galaxies from the SDSS DR4 (Adelman-McCarthy et al., 2006) catalog against their -band absolute magnitude. In comparison with the host galaxies of type II SNe (Prieto et al., 2008), we see that UGC 11860 is among the few hosts with a low oxygen abundance and lies significantly below the majority of the hosts, which mostly have a super-solar oxygen abundance (8.69).
4 Optical Light Curve
4.1 Apparent magnitude light curves
| Filter | Plateau slope, s1 | Plateau slope, s2 | Avg. Plateau slope | Nebular phase slope | Steepness Parameter |
|---|---|---|---|---|---|
| () | () | () | () | () | |
| 8.78 | 4.08 | 5.51 | – | – | |
| 4.64 | 2.16 | 2.99 | 0.70 | – | |
| 1.80 | 1.18 | 1.38 | 0.96 | 0.13 | |
| 0.90 | 0.88 | 0.91 | 0.91 | – | |
| 0.70 | 0.74 | 0.73 | 1.10 | – |


broadband photometric observations of ASASSN-14dq were carried out during d to d since the date of explosion (JD 24568541.50) using the HCT. Our observations were combined with observations of ASASSN-14dq by the Las Cumbres Optical Global Telescope network (Valenti et al., 2016, LCOGT,). The apparent magnitude light curves after combining the data from both the sources are plotted in Fig. 4. The initial rise to the peak is not observed in the light curves shown, as the follow-up for ASASSN-14dq started nearly 8 days after the predicted date of the explosion.
The -band light curve has the steepest decline of all in the plateau phase, with the light curve declining almost linearly and the slope of which reduces after 45 days from the date of the explosion. The -band light curve shows a relatively steeper decline in the initial part of the plateau phase, which flattens during the later stages (45–95 d). At the end of the plateau phase (95 d), light curves in all the bands (except in ) decline steeply and settle onto a slowly declining radioactive decay-powered phase (115 d). The light curves show a slow decline throughout the plateau phase which extends up to 95 days from the date of the explosion.
In order to compare the light curves of ASASSN-14dq with other well-studied type II SNe, light curve parameters need to be extracted. Some type II SNe exhibit a change in the slope of the light curve at around 20-30 days from maximum, because the photosphere starts to recede deeper than the outer few tenths of a solar mass (Dessart &
Hillier, 2010). To account for this, Anderson
et al. (2014) introduced the following parameters to characterize the light curves of type II SNe:
(i) : the decline rate of the initial, steeper part of the plateau phase.
(ii) : the decline rate of the second, shallower part of the plateau phase.
(iii) : the decline rate in the radioactive tail phase.
The parameters , and are measured in units of magnitude per 100 days. We used Weighted Least-Square (WLS) optimization to fit different phases in the light curve with a straight line and extracted the decline rates in individual bands. The data points were weighted inversely with their respective error bars. As can be seen from the broadband light curves, ASASSN-14dq shows a slight change in slope through its plateau (). The light curve parameters , and in bands for ASASSN-14dq are mentioned in Table 3. The location of ASASSN-14dq in the plot between the plateau decline rate () and the peak -band absolute magnitude () is shown in Fig. 5. The -band decline rate, mag suggests that ASASSN-14dq is a type II-P event (Patat et al., 1994).
For comparison of ASASSN-14dq with other type II SNe from the literature, we chose: normal type II-P SN 1999em (Leonard et al., 2002b) and SN 1999gi (Leonard et al., 2002a), luminous and slow-declining type II-P SN 2004et (Sahu et al., 2006), intermediate-luminosity type II-P SN 2012aw (Bose et al., 2013), luminous and long-plateau type II-P SN 2009bw (Inserra et al., 2012), luminous and fast-declining type II-P SN 2013ab (Bose et al., 2015a) and the luminous and fast-declining type II-P/L SN 2013ej (Bose et al., 2015b), to see where ASASSN-14dq lies amidst the class of type II SNe.
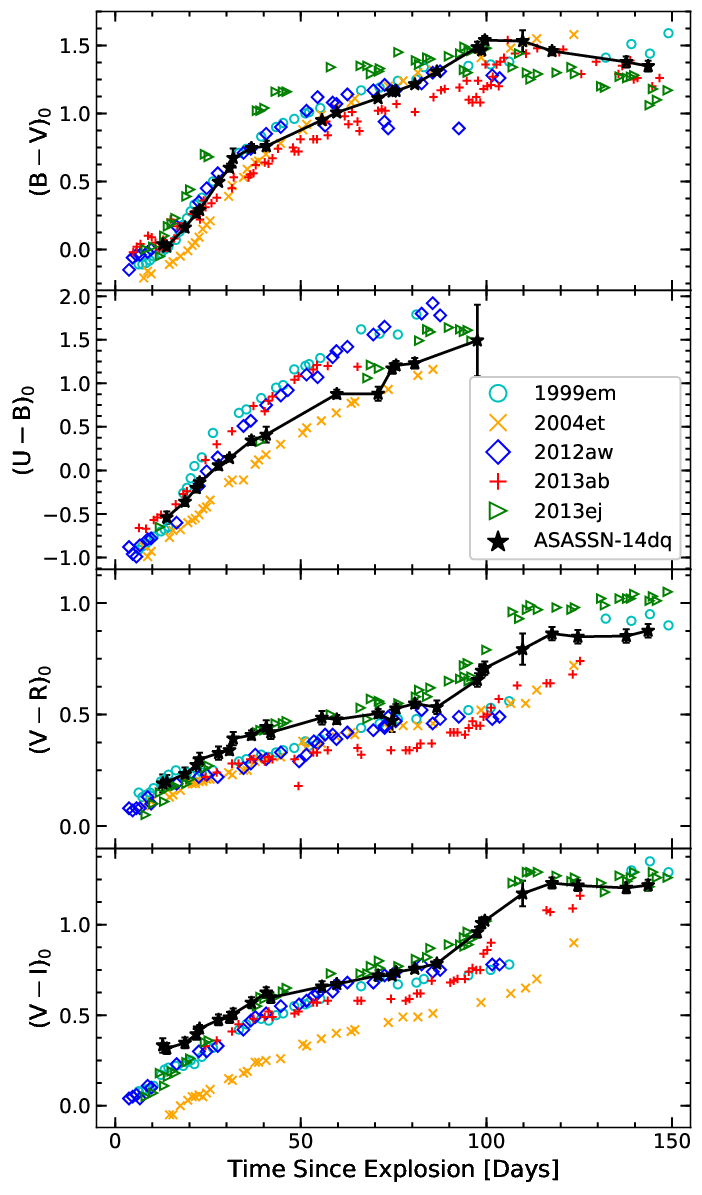
Evolution of intrinsic colours , , and of ASASSN-14dq are shown in Fig. 6. The temporal evolution of the SN envelope can be studied from these colour evolution plots. For comparison, we have plotted the colour evolution of ASASSN-14dq with other well-studied type II SNe: SN 1999em, SN 2004et, SN 2012aw, SN 2013ab and SN 2013ej. The rapid decline of and fluxes in the early plateau phase leads to a rapid increase in the and colours, whereas the other colours rise slowly. The red-ward evolution of all the colours until the end of the plateau phase signifies the cooling of the ejecta. In all, the colour evolution of ASASSN-14dq is similar to other type II SNe with no observed peculiarity.
Recently, a study on observed colours of type II SNe was carried out by de Jaeger et al. (2018). They inferred that the differences in observed colour is mostly intrinsic in origin and can be attributed to differences in progenitor radii and/or the presence/absence of CSM. They also found that fast-declining type II SNe have redder colours at later epochs (50–70 d) and attributed it to the interaction of the SN ejecta with the CSM. The colour evolution of ASASSN-14dq in comparison with other type II SNe in our study appears to follow this trend.
4.2 Absolute -band magnitude and Bolometric light curve

Absolute broadband magnitudes were obtained from apparent magnitudes after correcting for reddening and distance estimated in the Sections 3.1 and 3.2. The apparent SN magnitudes were corrected for extinction using the Fitzpatrick (1999) extinction law. The extinction coefficients in individual photometric bands were obtained using corresponding to the central wavelength of the band (for ) and an = 0.06 mag. The extinction corrected magnitudes were then converted to absolute magnitudes using a distance modulus, = 33.250.15 mag (equivalent to 44.83.1 Mpc).
-band absolute magnitude light curve of ASASSN-14dq is plotted along with our comparison sample in Fig. 7. The early phase (45 d) light curve of ASASSN-14dq is slightly steep but flattens during the late-stages (45 d) of the plateau phase. The -band light-curve of ASASSN-14dq in the nebular phase has a decline rate of 0.96 and shows similarity to SN 2013ab and the decay rate of . The plateau to nebular phase transition occurs around 95 d and has a decline of 1.5 mag with a slope of 0.1 . The peak -band magnitude of ASASSN-14dq, = –17.70.2 is much brighter than an average type II-P SNe (Li et al., 2011, which have an average peak = –15.66 mag) and is among the brightest type II-P SN observed (Li et al., 2011; Anderson et al., 2014). The mid-plateau -band absolute magnitude ( = –16.90.2 mag) and the plateau duration (90 d) of ASASSN-14dq is comparable to SN 2013ej and SN 2013ab.

Quasi-bolometric light curve for ASASSN-14dq was obtained using data obtained from HCT and data from Valenti et al. (2016). The extinction corrected SN magnitudes were converted to monochromatic fluxes with the help of the following relation from Bessell et al. (1998):
| (5) |
where is the wavelength dependent zero point magnitude based on = 0.03 mag for Vega. The zero points for Bessell’s filters were obtained from Bessell et al. (1998), and for SDSS filters from the SVO Filter Profile Service website55 5 http://svo2.cab.inta-csic.es/theory/fps/.
The quasi-bolometric flux for an epoch was then calculated by integrating over a cubic spline fit to the photometric fluxes at central wavelengths of the respective band-pass filters. The flux was then integrated over the wavelength range of 3100 to 9200 Å. The wavelength range was chosen as the edges (1% of maximum transmission) of the transmission function of the and bands. The quasi-bolometric flux of the sample used for comparison was also calculated by integrating over the same wavelength range. For the missing band-pass values on some epochs, the magnitude of the band-pass filter was obtained by interpolating the light curve using a spline. The quasi-bolometric luminosity (hereafter bolometric) was obtained after correcting the flux obtained for the distance to the host galaxy, D = Mpc (see Section 3.2).
The bolometric light curve of ASASSN-14dq is shown in Fig. 8 along with the bolometric light curves of our comparison sample. During the early parts of the plateau phase ( 45 d), the bolometric flux is dominated by the flux from the shorter wavelength bands i.e , which is reflected in the bolometric LC as the steep decline phase of the plateau. During the later stages of the plateau phase ( 45 d), the major contribution to the bolometric flux shifts towards the bands and the UV contribution becomes insignificant as the ejecta had cooled with time.
The peak bolometric luminosity of ASASSN-14dq is which classifies it as a luminous type II-P SN. The bolometric luminosity declines at the rate of 0.36 dex during the plateau phase and 0.15 dex during the radioactive decay-powered phase.
5 Spectroscopic Evolution
The spectral evolution of ASASSN-14dq over 23 epochs is displayed in Figs. 9 and 12 for the plateau and nebular phase, respectively. All the spectra were corrected for the recession velocity of the host galaxy (UGC 11860) using the value of redshift (z = 0.010424) obtained from NED. This redshift is consistent with the value obtained (z = 0.010) by Supernova Identification software (SNID66 6 https://people.lam.fr/blondin.stephane/software/snid/) (Blondin & Tonry, 2007). Identification of spectral features in ASASSN-14dq was done as in prior studies of type II-P SNe (Sahu et al., 2006; Bose et al., 2015a) and is displayed in Fig. 10.
5.1 Early phase spectra


The early phase spectra of a SN help determine the ejecta composition and the nature of the progenitor as the photosphere recedes the surface exposing the inner layers. The earliest spectrum of ASASSN-14dq obtained 14 days from the explosion is quite noisy and displays a developed emission-dominated P-Cygni profile of H. The blue-shifted minimum of the absorption feature of H gave an expansion velocity of 11500 . Fe II 5169 Å starts appearing early (22 d) in the plateau along with Ba II 4554 Å blend. Weaker lines of Fe II 4924, 5018 Å and Ca II IR triplet 8498, 8542, 8602 Å start appearing around 28 d and are traceable in the spectrum of 31 d. The emergence of lines from heavier atoms like iron, calcium, scandium, barium etc. around 22 d signify essentially the composition of the progenitor star as the photosphere traces the outer parts of the ejecta up to 80 days. As the SN evolves further through the plateau phase, H, H, Ca II IR triplet absorption features start becoming narrower and deeper due to the decreasing ejecta velocity. Weak signatures of Na I D interstellar absorption features from the MW can also be seen in the spectra having a high SNR (i.e. 28 d). Signatures of Ca II doublet 3934, 3968 Å can be seen throughout the plateau phase.
An absorption is seen blue-ward of the H component in the spectra obtained during 19–31 days (see Fig. 9). This could be due to Si II 6355, or could be a high-velocity (HV) component of H (Gutiérrez et al., 2017, see description on “Cachito” in). The feature (marked ‘A’) seen in the spectrum of 19 d is observed at 17000 w.r.t. the H rest wavelength and is significantly higher than the normal component (9500 ) of H at that epoch. The spectrum on 22 d shows an absorption blue-ward of H, marked as feature ‘B’ in Fig. 9. If this absorption is associated with H, it has a velocity similar to the absorption feature ‘A’, supporting the identity of these features to be the high-velocity (HV) components of hydrogen (Inserra et al., 2012; Gutiérrez et al., 2017, see). The P-Cygni profiles of H and H are plotted in Fig. 11 for the period over which these HV features are seen. As the feature ‘A’doesn’t follow the usual red-ward drift (slow evolution compared to the normal component) in time, it is highly unlikely to be the Si II 6355 from the SN (Faran et al., 2014a). This two-component P-Cygni profile of H can hence signify the existence of high-velocity (HV) material in the outer envelope of ASASSN-14dq in the early phases. This feature was also present in the spectra of SN 2004et (Sahu et al., 2006) and SN 1999em (Leonard et al., 2002a) and could arise from the interaction of the SN ejecta with the CSM surrounding the pre-supernova star (Chugai et al., 2007). The HV component is initially stronger than the normal component but fades away w.r.t. the normal component as the SN enters the mid-plateau (42 d) phase.
Weak signature of He I 5876 can be seen in the spectrum of 28 d. Na I D from the SN starts appearing at a similar location in the spectrum obtained on 37 d and the He I feature is no longer discernible (Gutiérrez et al., 2017). The Fe II 5535 Å and Sc II 5527 Å blend along with Sc II 5665 Å multiplet start appearing in the spectra by 28 d and are distinguishable by 42 d. As the supernova ages across the plateau, absorption features from numerous metal lines become narrower and deeper. Ba II 6142 Å and Sc II 6246 Å are seen in the spectrum taken at 45 d. The spectrum of ASASSN-14dq at 80 d still shows strong absorption features signifying that the SN has not yet entered the nebular phase. The above-mentioned features are present in the spectra until 104 d and their comparison with other SNe (top two sub-plots of Fig. 19) indicates that the plateau phase spectral features are similar (although weaker) to other type II-P events in comparison.
5.2 Nebular phase spectra


The nebular phase in a supernova is marked by the presence of strong emission features in its spectra which is attributed to its optically thin ejecta. The spectrum mostly forms deep inside the ejecta, revealing information on the nucleosynthesis that occurred during the explosion of the star. The spectra of ASASSN-14dq in the nebular phase is plotted in the Fig. 12. The spectrum of ASASSN-14dq at 120 d shows a flat continuum. Na I D, H and Ca II triplet 8498, 8542, 8662 Å show shallow absorption troughs in the early nebular phase which fades away with time. These features also become progressively emission dominated as the supernova ages. The emission profile of H in this phase shows an asymmetric feature beginning 126 d and is highlighted in Fig. 13. Forbidden lines from [O I] 6300, 6364 Å and [Ca II] 7291, 7324 Å can be seen in the spectra taken after 122 d, which strengthen as the supernova progresses in the nebular phase. The Ca II triplet becomes comparable to H in terms of line luminosity in the nebular phase (159 d), although the [O I] doublet stays quite weak in ASASSN-14dq.
5.3 Expansion Velocity

Spectral features originating from different layers in the ejecta have different characteristic velocities and hence can be used to study the geometry of the explosion. They also offer information on the energetics of the explosion. Photosphere of a type II-P SN refers to the ionized, thin spherical shell which radiates most of the continuum radiation as a “dilute blackbody” (Leonard et al., 2002a). The continuum spectrum released from the electron-scattering photosphere (defined as having an optical depth of photons equal to 2/3) is actually produced in a deeper layer at which the radiation field thermalizes at the temperature of the local gas. In Fig. 14, we plotted the line velocity evolution of spectral features H, H, H, and Fe II 4924, 5018, 5169 Å. The line velocities were calculated from the minimum of the absorption features determined by fitting a Gaussian profile to the same using IRAF in the redshift corrected spectra. The error in estimating velocity includes the error in the measurement along with the uncertainty in the wavelength scale, as mentioned in Leonard et al. (2002b).
Due to the mixing of layers in the SN ejecta caused by the shock breakout and the inward movement of the recombination front (in mass coordinate), a single spectral line cannot truly depict the true photospheric velocity throughout the course of evolution of the SN. Balmer lines present in the spectra of a SN can represent the photospheric velocity fairly accurately only when the optical depths of these lines are low. This is true for spectra taken during the very early phase ( 8 d) of a type II-P SN. As the SN fades away with time, velocities determined from the hydrogen Balmer lines become a poor representation of the photospheric velocity (Eastman & Kirshner, 1989). These features yield a velocity higher than the true photospheric velocity because most of the absorption happens in the outer (faster) layers of the SN ejecta. During the late phase, weak and unblended absorption features of metals (Fe, Sc etc.) can be used to determine the photospheric velocity (Hamuy et al., 2001). Hence, Fe II 4924, 5018, 5169 Å lines were used to determine the photospheric velocity during the plateau phase. The velocities inferred from metal lines follow a similar trend and form in deeper (slower) layers compared to the hydrogen Balmer lines which form in outer (faster) layers.
The photospheric velocity inferred for ASASSN-14dq varies from 11500 in the earliest spectra (14 d) to 1200 in the spectra obtained on 160 d. It is to be noted here that, due to the possible blending of Fe II 5169 Å with other metal lines after the end of the plateau phase ( 95 d), Fe II 5169 Å absorption feature may not reflect the photospheric velocity accurately. Also, the velocity estimated from Fe II 4924 Å feature might display consistently lower values because of its suspected blending with the Ba II 4934 Å feature (Hendry et al., 2005). However, in the case of our low-resolution spectra, we are unable to discern such differences because the velocities determined from the individual Fe II features lie within 1 error of each other.
6 Nickel Mass
CCSNe produce radioactive through the explosive nucleo-synthesis of Si (Arnett, 1980). The nebular phase light curve in type II SNe is mainly powered by the radioactive decay of . The -ray photons and positrons emitted from the above decay thermalize the ejecta and power the tail of the light curve.
6.1 Rediscovering the correlation between Nickel mass and Steepness parameter


| SN | Steepness | Reference | ) | () | Reference | |
| (Name) | () | (d) | (Data) | (From Steepness, Ref. 1) | (From Literature) | ( Mass) |
| Elmhamdi et al. (2003) sample | ||||||
| 1969L | 0.050 | 1104 | 2 | 0.0640.001 | 0.082 | 3 |
| 1970G | 0.085 | 944 | 2 | 0.0490.001 | 0.037 | 3 |
| 1987A | 0.064 | 1072 | 2 | 0.0570.001 | 0.075 | 3 |
| 1988A | 0.045 | 1344 | 2 | 0.0670.001 | 0.062 | 3 |
| 1991G | 0.086 | 1225 | 2 | 0.0480.001 | 0.022 | 3 |
| 1992H | 0.048 | 1125 | 2 | 0.0650.001 | 0.129 | 3 |
| 1997D | 0.250 | 1125 | 2 | 0.0130.001 | 0.0050.004 | 4 |
| 1999em | 0.118 | 1125 | 2 | 0.0370.001 | 0.042 | 3 |
| 1999gi | 0.115 | 1203 | 2 | 0.0380.001 | 0.018 | 3 |
| Additional sample used in this paper | ||||||
| 2002hx | 0.136 | 75.7 | 5, 27 | 0.0320.001 | 0.053 | 5 |
| 2003gd | 0.281 | 124.0 | 6 | 0.0100.001 | 0.016 | 6 |
| 2003hn | 0.191 | 97.3 | 5, 27 | 0.0210.001 | 0.035 | 5 |
| 2004dj | 0.201 | 126.2 | 7 | 0.0190.001 | 0.0230.005 | 7 |
| 2004ej | 0.211 | 114.4 | 5 | 0.0180.001 | 0.019 | 5 |
| 2004et | 0.076 | 123.1 | 8 | 0.0520.001 | 0.0560.040 | 4 |
| 2004fx | 0.165 | 104.6 | 5 | 0.0250.001 | 0.014 | 5 |
| 2005af | 0.089 | 110.8 | 5 | 0.0470.001 | 0.026 | 5 |
| 2005cs | 0.408 | 125.8 | 9 | 0.00360.0004 | 0.0060.003 | 4 |
| 2007it | 0.068 | 108.7 | 12 | 0.0560.001 | 0.072 | 12 |
| 2008gz | 0.091 | 120.1 | 24 | 0.0460.001 | 0.0500.010 | 24 |
| 2008in | 0.241 | 107.8 | 10 | 0.0140.001 | 0.0120.005 | 4 |
| 2009N | 0.234 | 109.7 | 11 | 0.0150.001 | 0.0200.004 | 4 |
| 2009ib | 0.090 | 140.2 | 13 | 0.0470.001 | 0.0460.015 | 13 |
| 2009md | 0.378 | 118.9 | 25 | 0.00460.0004 | 0.0050.001 | 4 |
| 2012A | 0.188 | 107.4 | 18 | 0.0210.001 | 0.0110.001 | 14 |
| 2012aw | 0.044 | 130.0 | 18 | 0.0680.001 | 0.0560.013 | 15 |
| 2012ec | 0.169 | 106.8 | 16 | 0.0250.001 | 0.0400.015 | 16 |
| 2013K | 0.234 | 128.2 | 22 | 0.0150.001 | 0.0120.010 | 22 |
| 2013ab | 0.112 | 101.5 | 17 | 0.0390.001 | 0.0640.006 | 17 |
| 2013by | 0.174 | 87.1 | 18 | 0.0240.001 | 0.0290.005 | 18 |
| 2013ej | 0.181 | 100.5 | 19 | 0.0220.001 | 0.0180.006 | 18 |
| LSQ13dpa | 0.075 | 126.5 | 5, 27 | 0.0530.001 | 0.0710.013 | 27 |
| 2013hj | 0.096 | 106.4 | 28 | 0.0440.001 | 0.0800.008 | 28 |
| 2014G | 0.135 | 86.8 | 26 | 0.0320.001 | 0.0190.003 | 18 |
| 2014cx | 0.088 | 109.9 | 20, 27 | 0.0470.001 | 0.0560.008 | 20 |
| 2014dw | 0.162 | 91.3 | 27 | 0.0260.001 | 0.00940.0008 | 5 |
| ASASSN-14ha | 0.514 | 136.8 | 27 | 0.00150.0002 | 0.00140.0002 | 27 |
| 2016X | 0.135 | 94.9 | 21 | 0.0320.001 | 0.0340.006 | 21 |
| 2017eaw | 0.137 | 120.5 | 23 | 0.0360.001 | 0.0500.015 | 23 |
(1) This paper; (2) Elmhamdi et al. (2003); (3) Hamuy (2003); (4) Spiro et al. (2014); (5) Anderson et al. (2014) (6) Hendry et al. (2005); (7) Zhang et al. (2006); (8) Sahu et al. (2006); (9) Pastorello et al. (2009); (10) Roy et al. (2011b); (11) Takáts et al. (2014); (12) Andrews et al. (2011); (13) Takáts et al. (2015); (14) Tomasella et al. (2013); (15) Bose et al. (2013); (16) Barbarino et al. (2015); (17) Bose et al. (2015a); (18) Valenti et al. (2015); (19) Bose et al. (2015b); (20) Huang et al. (2016); (21) Huang et al. (2018); (22) Tomasella et al. (2018); (23) Tsvetkov et al. (2018); (24) Roy et al. (2011a); (25) Fraser et al. (2011); (26) Terreran et al. (2016); (27) Valenti et al. (2016); (28) Bose et al. (2016).
Elmhamdi et al. (2003), using a sample of 10 type II SNe determined that the mass anti-correlates with the maximum value of the steepness parameter, during the transition phase. We explore this correlation further as this can help probe masses for type II SNe independent of their distance and extinction. To accommodate the growing sample of type II SNe, we rebuild the empirical relation after including 30 type II SNe (Elmhamdi et al., 2003, in addition 9 SNe from) having a good photometric coverage in the transition phase of the -band light curve and known mass. In order to calculate , we follow the procedure in Elmhamdi et al. (2003). Firstly, we obtain the -band fluxes from magnitudes and fit the transition period from the plateau to the radioactive tail by a function comprising of terms representing the plateau and the radioactive-decay phase:
| (6) |
The parameters A, B, , p and q in the above function were determined for each SN by minimizing the of the fit in the sensitive interval of about 50 days around the time of inflection. The functional fit for 5 type II SNe in our sample along with the parameters and is shown in Fig. 15. The best fit for the remaining 25 type II SNe are displayed in Figs. 25, 26, 27, 28 and 29. The derived values of and for each of the 39 type II SNe used to reconstruct the relation is mentioned along with their respective mass from the literature in Table 4. The best fit to the net sample of type II SNe is shown in Fig. 16 and is described by the relation:
| (7) |
The mass estimated from the steepness relation (7) is also mentioned in Table 4. The measure of correlation between the two variables (log , ) was measured using the Pearson correlation coefficient and the Spearman correlation coefficient which yielded an r-value of –0.8806 and –0.8343, respectively. The chance probability of finding these correlation (p-value) was found to be and , respectively.
6.2 Estimating Nickel mass for ASASSN-14dq

The mass of synthesized at the time of the explosion can be independently estimated from the tail bolometric luminosity (), as described by Hamuy (2003) through the following relation:
| (8) |
where 6.1 d is the half-life of , 111.26 d is the e-folding time of decay and is the explosion time. The tail luminosity, of ASASSN-14dq determined around 175 d corresponds to a mass of .
More massive progenitors of SNe produce a more energetic explosion and SNe with greater explosion energies produce more (Hamuy, 2003). Hence, mass can also be computed by comparing the tail bolometric luminosity of the SN with that of SN 1987A, assuming that the deposition is the same for both SNe. The mass for SN 1987A was determined quite accurately by Turatto et al. (1998) to be 0.0750.005 . After comparing the tail bolometric luminosity of ASASSN-14dq around 175 d with that of SN 1987A (which is ), the value of mass was found to be .
The H luminosity of the SN during the nebular phase can also be used to estimate the mass by comparing it to the H luminosity of SN 1987A at a similar epoch assuming that mass, energy and mixing conditions do not differ strongly (Elmhamdi et al., 2003). The H luminosity of , derived from the spectrum obtained 176 days from the explosion yields a mass of . The mean mass estimated using the above methods is .
As discussed earlier in Section 6.1, mass can be estimated from the steepness parameter through Eqn. 7. The steepness parameter for ASASSN-14dq is determined in Fig. 17 and is 0.1310.010 . This yields an mass of using Eqn. 7. This value is similar to the mean value obtained above using other techniques suggesting that ASASSN-14dq obeys the correlation. The average estimated mass for ASASSN-14dq using all the above methods is .
7 Light Curve Modelling
In order to further analyze ASASSN-14dq, its outburst properties should be determined. The SN outburst is basically characterized by three parameters: the mass of the ejecta (), the radius of the star prior to the explosion (R) and the energy of the explosion (E). To determine the above parameters, Nagy et al. (2014) proposed a semi-analytic light curve model which assumes a spherically symmetric, homologously expanding SN ejecta. This model is based on the formulation of Arnett (1980), which was further refined by Arnett & Fu (1989). For our work, we used the two-component model proposed by Nagy & Vinkó (2016) (Nagy et al., 2014, an extension to), which combines a compact, dense inner core with a low-mass, extended outer envelope (a configuration originally proposed by Bersten et al., 2012, to resemble a yellow/red supergiant).
The best-fit to the model was obtained by minimizing the of the model light curve fit to the observed bolometric light curve. We tried two different values of recombination temperature and two different opacities for the outer envelope (H-rich shell, H-He shell) to see how it affects the values of the parameters obtained due to degeneracies present in the parameter space. The parameters obtained didn’t change significantly for different configurations and can be seen in Table 5. Due to the availability of parameters associated with the core in the literature of type II-P SNe, we use only those parameters for discussion. We obtained a radius of (), an ejecta mass of and a total energy of ergs. These values are quite similar to the values obtained for an RSG progenitor of SN 2013ej by Nagy & Vinkó (2016) and Bose et al. (2015b). This indicates similarity in the progenitors of ASASSN-14dq and SN 2013ej. The mass of 56Ni estimated from the two-component model using the nebular phase in the light curve is 0.026 M⊙ and is very similar to our mass estimate in Section 6.2.
| Parameter | Core (He-rich) | Shell (mixed H-He) | Shell (pure H) |
| ( = 0.2 cm2/g) | ( = 0.3 cm2/g) | ( = 0.4 cm2/g) | |
| (cm), Initial radius of the ejecta | 38 | 72 | 74 |
| (K), Recombination temperature | 5500 | – | – |
| (M⊙), Ejecta mass | 10.3 | 0.68 | 0.59 |
| (M⊙), Nickel mass | 0.026 | – | – |
| (foe), Thermal energy | 0.38 | 0.09 | 0.09 |
| (foe), Kinetic energy | 1.65 | 1.54 | 1.56 |
| (cm), Initial radius of the ejecta | 36 | 76 | 72 |
| (K), Recombination temperature | 7000 | – | – |
| (M⊙), Ejecta mass | 10.4 | 0.66 | 0.70 |
| (M⊙), Nickel mass | 0.026 | – | – |
| (foe), Thermal energy | 0.37 | 0.10 | 0.09 |
| (foe), Kinetic energy | 1.24 | 1.46 | 1.30 |

8 ASASSN-14dq among type II SNe
| SN | Explosion Epoch | Distance Modulus, | Reference | |||
|---|---|---|---|---|---|---|
| (Name) | (JD) | (mag) | (mag) | () | () | |
| 2003gd | 2452717.00 | 29.840.36 | -15.920.49 | 0.016 | 3694981 | 1 |
| 2009ib | 2455041.30 | 31.480.31 | -16.280.31 | 0.0460.015 | 3247200 | 4 |
| 2012ec | 2456143.00 | 31.190.13 | -16.540.14 | 0.0400.015 | 3700100 | 2 |
| 2013ab | 2456340.00 | 31.920.10 | -16.700.10 | 0.0640.006 | 4400400 | 3 |
| ASASSN-14ha | 2456910.50 | 29.530.50 | -14.400.50 | 0.00140.0002 | – | 5 |
| 2016X | 2457405.92 | 30.910.43 | -16.200.43 | 0.0340.006 | 4500200 | 6 |
| 2016bkv | 2457467.50 | 30.790.04 | -14.740.06 | 0.0220.001 | 1300150 | 8 |
| 2017eaw | 2457884.00 | 28.740.11a | -16.440.12 | 0.050 | – | 7 |
aThe distance to the galaxy NGC 6946 hosting the SN 2017eaw was taken from Sahu et al. (2006).
(1) Hendry
et al. (2005)
(2) Barbarino
et al. (2015);
(3) Bose
et al. (2015a);
(4) Takáts
et al. (2015);
(5) Valenti
et al. (2016);
(6) Huang
et al. (2018);
(7) Tsvetkov
et al. (2018);
(8) Hosseinzadeh
et al. (2018).



The light curves of ASASSN-14dq display a well-sampled transitional phase from the plateau to the radioactive-tail. The steepness parameter for ASASSN-14dq, 0.1310.010 (estimated earlier in Section 6.2) is similar to the value inferred for type II SNe like SN 1999em (0.118) and SN 1999gi (0.115). If we compare ASASSN-14dq with luminous type II SNe, the steepness is less than that of SN 2013ej (0.181) and SN 2013by (0.174), but is more than in the case of SN 2004et(0.076), SN 1970G (0.085) and SN 1992H (0.048). This signifies the diversity in type II SNe. In Section 6.1, we found that the correlation between the steepness parameter and mass was strengthened (low p-value) after the inclusion of more type II SNe to the original sample used in Elmhamdi et al. (2003). Also, the correlation strengthens the fact that increase in the mass in the SN ejecta favours radiative diffusion at the end of the plateau and causes a less steep transition to the radioactive-tail (Elmhamdi et al., 2003). However, we do expect deviations from this correlation due to differences in the degree of mixing. The effect of higher degree of mixing can cause decreased steepness in the transition phase because of an increase in radiative diffusion (Eastman et al., 1994, see Fig. 12 in).
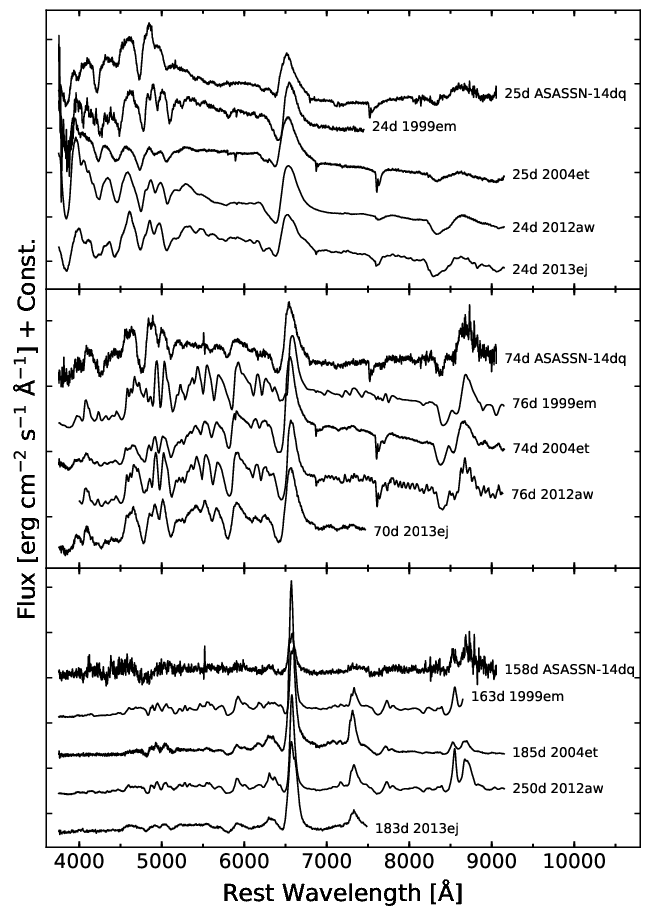
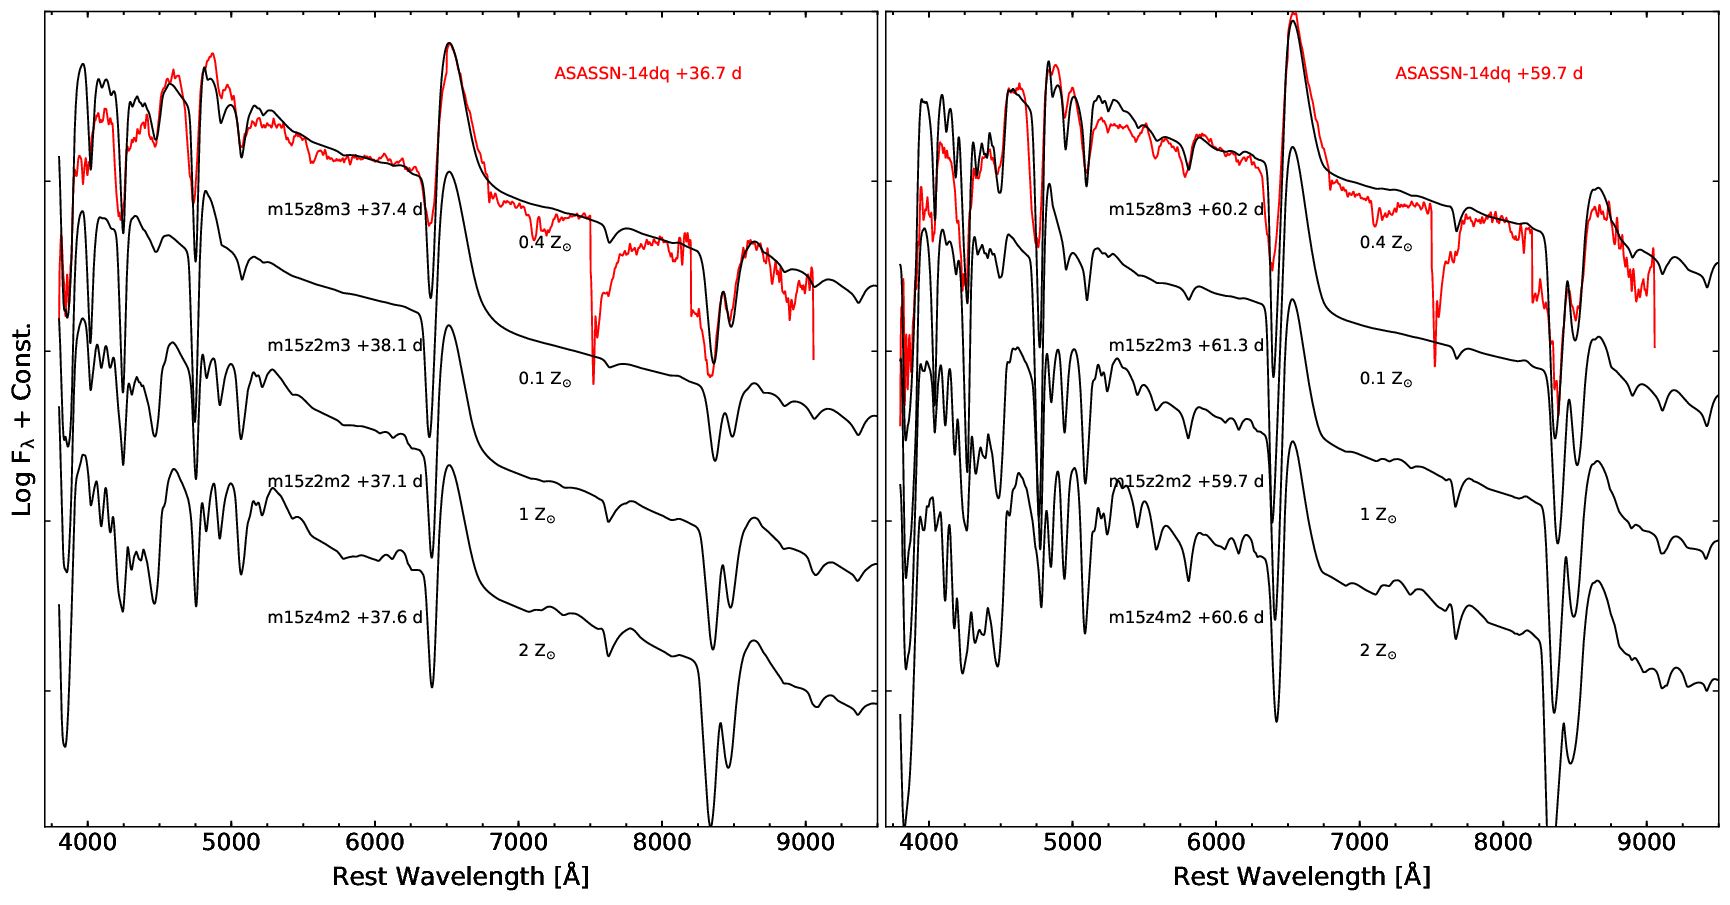
In Fig. 19, the spectra of ASASSN-14dq are compared with the normal type II-P SN 1999em (Leonard et al., 2002a), luminous type II-P SN 2004et (Sahu et al., 2006), the intermediate-luminosity type II-P SN 2012aw (Bose et al., 2013) and the luminous type II-P/L SN 2013ej (Bose et al., 2015b) at three different epochs (24 d, 74 d and 160 d). Even though the spectra of ASASSN-14dq match quite well with other type II SNe at all the three epochs, it appears relatively featureless and displays weaker metal lines in comparison. This might be due to the low (sub-solar) oxygen abundance of the host galaxy estimated in Section 3.3. To further investigate the possibility of low host metallicity, we compare the spectra of ASASSN-14dq with the models of D13 generated from the explosion of a 15 main-sequence star with MESA77 7 http://mesa.sourceforge.net/ (Paxton et al., 2011; Paxton et al., 2013) at 0.1, 0.4, 1 and 2 metallicities. In the photospheric phase, D14 found that the observed intermediate-mass elements along with the Fe-group elements reflect the original composition of the progenitor star and are weakly affected by nuclear burning in the core.
In Fig. 21, the spectra of ASASSN-14dq (at two epochs) is compared with the models of D13. The spectra shows resemblance to the model spectra with 0.4 metallicity (m15z8m3) in terms of pseudo-Equivalent Width (pEW) of the metal lines (Ca II, Fe II etc.). It is important to note here that the models of D13 are not tailored for the progenitor of ASASSN-14dq. The Balmer absorption is weaker in the spectra of ASASSN-14dq than in the models of D13 and hints towards a slower evolution of ASASSN-14dq. This might result from the residual thermal energy of an earlier interaction of the outer ejecta with the CSM (Polshaw et al., 2016). Although type II-P SNe typically show deeper P-Cygni absorption profiles (Schlegel, 1996; Gutiérrez et al., 2014), the absorption troughs of the H P-Cygni profile in the spectra of ASASSN-14dq are shallower and are comparable with the type II-P/L SN 2013ej. This indicates a hydrogen-poor envelope above the photosphere leading to a prominent emission feature but less significant absorption feature and could possibly be a result of low metallicity of the host (Gutiérrez et al., 2018). Type II SNe in large late-type spirals are on an average brighter (an average peak magnitude of –16.280.35, = 1.52 mag) than those in the smaller ones (Li et al., 2011). This is also the case with ASASSN-14dq, which is brighter than an average type II-P SN. However, Gutiérrez et al. (2018) do not find any differences in the absolute magnitude of type II SNe in different galaxies.
In Fig. 20, the velocity evolution of ASASSN-14dq inferred from two different absorption features (H, Fe II 5169 Å) is compared with other well-studied type II SNe. The rate of decline of H line velocity is similar to other type II SNe in the early phase but is consistently slower after the mid-plateau phase (45 d). The power law () fit to the H and the H velocity evolution returned exponents 0.18 and 0.32, respectively, which are lesser compared to the values (0.41 for H and 0.53 for H) obtained by Faran et al. (2014a) for type II-P SNe. This suggests a hydrogen-poor envelope in ASASSN-14dq and a possible interaction of the ejecta with the CSM. The evolution of line velocities inferred from the Fe II triplet for ASASSN-14dq matches very well with the other type II SNe throughout the plateau phase and was confirmed by the power law fit to the evolution of Fe II line feature, which declined with an exponent of 0.59 (compared to 0.58 in Faran et al., 2014a, for type II-P SNe). The less scatter seen among the velocities inferred from Fe II absorption feature is consistent with the inference of Dessart & Hillier (2005a), which emphasized only 5-10 % errors on photospheric velocity determination from Fe II absorption features, whereas the scatter in the H line velocities increases as the SN ages across the plateau phase. Faran et al. (2014b) have shown that type II-P SNe display fast evolving (fast-declining) H velocity evolution due to their thick hydrogen envelope and drop by a factor of 3 from the peak to the mid-plateau phase compared to type II-L SNe that drop 50 %. ASASSN-14dq shows a relatively slow evolution (as seen in Fig. 14), although it is not as slow as a type II-L SN.
To compare the observed parameters of ASASSN-14dq with type II SNe, we derive a sample from Hamuy (2003), Spiro et al. (2014) and Valenti et al. (2015) along with 8 additional events mentioned in Table 6. In Fig. 22, the mid-plateau -band absolute magnitude () is plotted with the mid-plateau photospheric velocity () for our sample of type II SNe. We find that ASASSN-14dq lies within the 3 confidence interval of the fit. In Figs. 23 and 24, mass synthesized in the explosion is plotted against and of our sample, respectively. ASASSN-14dq lies outside the 3 confidence interval of both the fits associated with the mass, indicating that ASASSN-14dq has a lower yield of for a type II SN. SN 1986I, SN 1969L and 1999cr have similar mid-plateau magnitude but have significantly (3-4 times) higher mass synthesized in the explosion. SN 2003hn is the only type II SN that comes close to ASASSN-14dq in terms of mass synthesized for a similar plateau brightness apart from the transitional type II-P/L SN 2013ej which is slightly fainter (0.3 mag) in the plateau phase when compared to ASASSN-14dq.
Following the classification of Faran et al. (2014b), where type II-P SNe decline with a rate of s, ASASSN-14dq (with an s0.80) would be classified as a type II-L SN. However, if we use the classification criteria used by Valenti et al. (2015) for a type II-P SN as having s1.0, ASASSN-14dq will be classified as a type II-P SN. Nonetheless, the presence of a drop in magnitude at the end of the hydrogen recombination phase is usually considered the defining feature of a type II-P SN (Valenti et al., 2015) and can be seen in ASASSN-14dq.
In a large sample study of type II SNe, Anderson et al. (2014) and Sanders et al. (2015) found no clear photometric gap that distinguishes the type II-P SNe from the type II-L SNe. The plateau durations of type II-P SNe are typically 100 d but get shorter for more luminous type II SNe (Poznanski, 2013) and display high-velocity H absorption in the spectra suggesting an interaction with the CSM. The high decline rate of ASASSN-14dq during the plateau phase, inferred earlier in Section 4, matches with the short plateau of ASASSN-14dq and is consistent with the correlation between the plateau length and the plateau decline rate for type II-P SNe inferred by Anderson et al. (2014). Type II SNe which decline rapidly at early epochs also generally decline rapidly during the plateau and in the radioactive phase (Anderson et al., 2014). The same has been observed for ASASSN-14dq. The late phase light curve in type II SNe is powered by the radioactive decay of to , which in the case of complete -ray trapping and trapping has a characteristic decline rate of 0.98 . In the nebular phase, ASASSN-14dq shows a decline rate () comparable to the decay rate of and hence indicates complete -ray trapping.
The low mass inferred for ASASSN-14dq is in contrast with the brighter maximum luminosity, indicating an alternate source of energy, such as the interaction of the ejecta with the CSM. The observed asymmetry in the nebular H emission also indicates a possible CSM interaction. Asymmetric line profiles have also been observed in other type II-P SNe such as SN 1999em (Leonard et al., 2002b), SN 2004dj (Chugai et al., 2005) and in SN 2013ej (Bose et al., 2015b). Chugai et al. (2005) suggest that the asymmetry is due to an asymmetric ejection of caused by the interaction of the ejecta with a geometrically asymmetric CSM. An asymmetric bipolar ejecta is not an exception for type II-P SNe and can result from a bipolar explosion in CCSNe due to a mildly rotating RSG core (Chugai et al., 2005). The fast decline rate of ASASSN-14dq during the plateau phase may also arise from asymmetric CSM interaction as inferred for PTF11iqb (Smith et al., 2015).
The photometric and spectroscopic parameters of ASASSN-14dq suggests that it is a luminous, fast declining type II-P SN. Anderson et al. (2014) showed that progenitors of fast-declining type II SNe retain a smaller amount of hydrogen in the envelope than the ones with slow decline rates. Type II SNe with faster decline rates display faster release of energy and brighter maximum luminosity due to low ionization and ejecta expansion (Patat et al., 1994).
9 Summary
We have presented 34 epochs of broadband () optical photometry along with 23 epochs of low-resolution spectroscopic observations of ASASSN-14dq during the first 195 days of its evolution. The apparent magnitude light curves and the spectra of ASASSN-14dq suggest that it is a type II-P SN exhibiting a plateau which lasts about 90 days. The peak -band absolute magnitude (i.e 17.70.2) and the peak bolometric luminosity (i.e ) of ASASSN-14dq classifies it as a luminous, fast-declining type II-P SN. We inferred negligible reddening for ASASSN-14dq from the dwarf host galaxy UGC 11860. We adopted a total minimal reddening of = 0.06 mag for ASASSN-14dq owing completely to the ISM in the Milky Way.
We inferred a distance of 44.83.1 Mpc to ASASSN-14dq. We also estimated an oxygen abundance of 12 + log(O/H) = 8.400.18 of the host galaxy UGC 11860. A sub-solar oxygen abundance of the host galaxy (and hence the progenitor) was reflected in our relatively featureless (and low pEW) spectra of ASASSN-14dq. The spectra also matched closely with the D13 model spectra of sub-solar metallicity (0.4 ). This inference supports the correlation between progenitor metallicity with the metal line pEW in the photospheric phase of the type II SNe.
We rebuilt the empirical relation between the steepness parameter and the mass synthesized in the explosion (Elmhamdi et al., 2003) using well-sampled -band light curves of type II SNe from the literature. The larger sample in our study (including low-luminosity type II SNe) strengthened the correlation between the two parameters and indicated towards a slightly shallower fit (Eqn. 7) than that of Elmhamdi et al. (2003). The decline rate of ASASSN-14dq in the late stages of the plateau phase (s2 = 1.18 ) is close to the mean decline rate (1.27 ) inferred for all of type II SNe in the sample of Anderson et al. (2014). The mass synthesized during the explosion is estimated to be 0.0290.005 and is slightly (50%) lower for a luminous type II SN. We obtained the explosion parameters of ASASSN-14dq through analytical modelling of its bolometric light curve. We obtained an explosion energy, , mass of the ejecta, . and a radius, .
In the spectroscopic evolution of ASASSN-14dq, prominent P-Cygni profiles of H, H, Fe II 5169, 5018, 4924 Å, He I 5876 Å, Ca II 8498, 9042, 8662 etc. were observed as in a type II-P SN. The H P-Cygni profile in the early phase spectra of ASASSN-14dq displays a shallower absorption feature compared to other type II-P SNe, indicating a hydrogen-poor envelope. An HV component is seen in the early phase spectra with a velocity of 17000 in the spectrum of 19 d, which completely disappears after 42 d. The velocity evolution of Fe II feature is quite similar to that of a type II-P SN, although the velocities inferred from Balmer absorption features decline slowly for a type II-P SN. The asymmetry in the H profile, the low mass inferred, the bright plateau luminosity and the fast decline during the plateau phase points towards the interaction of the ejecta with an asymmetric CSM. All the above inferences indicate a hydrogen-poor envelope in the progenitor of ASASSN-14dq, which may have lost most of its hydrogen during pre-supernova evolution. This makes it a transitional event between the type II-P and II-L SNe.
Acknowledgements
We thank the anonymous referee for thorough reading of the manuscript and for his/her helpful suggestions which helped in improving the content and readability of the manuscript. We thank Subhash Bose who provided us with the photospheric velocity data for SN 2013ej and SN 2013ab. We thank Chayan Mondal and Mousumi Das of the Indian Institute of Astrophysics for their helpful suggestions on morphology and metallicity of galaxies. We thank the staff at IAO, Hanle and CREST, Hoskote who helped with the observations from the 2m HCT. The facilities at IAO and CREST are operated by the Indian Institute of Astrophysics, Bengaluru. We also thank all the observers who helped us with the follow-up observations of the SN by providing a part of their observing time. Brajesh Kumar also acknowledges the Science and Engineering Research Board (SERB) under the Department of Science & Technology, Govt. of India, for financial assistance in the form of National Post-Doctoral Fellowship (Ref. no. PDF/2016/001563). This work made use of the NASA Astrophysics Data System and the NASA/IPAC Extragalactic Database (NED) which is operated by the Jet Propulsion Laboratory, California Institute of Technology.
This work also made use of the data from the Pan-STARRS1 Survey (PS1). The PS1 public science archive have been made possible through contributions by the Institute for Astronomy, the University of Hawaii, the Pan-STARRS Project Office, the Max-Planck Society and its participating institutes, the Max Planck Institute for Astronomy, Heidelberg and the Max Planck Institute for Extraterrestrial Physics, Garching, The Johns Hopkins University, Durham University, the University of Edinburgh, the Queen’s University Belfast, the Harvard-Smithsonian Center for Astrophysics, the Las Cumbres Observatory Global Telescope Network Incorporated, the National Central University of Taiwan, the Space Telescope Science Institute, the National Aeronautics and Space Administration under Grant No. NNX08AR22G issued through the Planetary Science Division of the NASA Science Mission Directorate, the National Science Foundation Grant No. AST-1238877, the University of Maryland, Eotvos Lorand University (ELTE), the Los Alamos National Laboratory, and the Gordon and Betty Moore Foundation.
References
- Abolfathi et al. (2018) Abolfathi B., et al., 2018, ApJS, 235, 42
- Adelman-McCarthy et al. (2006) Adelman-McCarthy J. K., et al., 2006, ApJS, 162, 38
- Anderson et al. (2014) Anderson J. P., et al., 2014, ApJ, 786, 67
- Anderson et al. (2016) Anderson J. P., et al., 2016, A&A, 589, A110
- Andrews et al. (2011) Andrews J. E., et al., 2011, ApJ, 731, 47
- Arcavi et al. (2010) Arcavi I., et al., 2010, ApJ, 721, 777
- Arcavi et al. (2012) Arcavi I., et al., 2012, ApJ, 756, L30
- Arcavi et al. (2014) Arcavi I., Valenti S., Howell D. A., Sand D., 2014, The Astronomer’s Telegram, 6304
- Arnett (1980) Arnett W. D., 1980, ApJ, 237, 541
- Arnett (1996) Arnett D., 1996, Supernovae and Nucleosynthesis: An Investigation of the History of Matter from the Big Bang to the Present
- Arnett & Fu (1989) Arnett W. D., Fu A., 1989, ApJ, 340, 396
- Asplund et al. (2009) Asplund M., Grevesse N., Sauval A. J., Scott P., 2009, ARA&A, 47, 481
- Barbarino et al. (2015) Barbarino C., et al., 2015, MNRAS, 448, 2312
- Barbon et al. (1979) Barbon R., Ciatti F., Rosino L., 1979, A&A, 72, 287
- Barbon et al. (1990) Barbon R., Benetti S., Rosino L., Cappellaro E., Turatto M., 1990, A&A, 237, 79
- Berg et al. (2012) Berg D. A., et al., 2012, ApJ, 754, 98
- Bersten et al. (2011) Bersten M. C., Benvenuto O., Hamuy M., 2011, ApJ, 729, 61
- Bersten et al. (2012) Bersten M. C., et al., 2012, ApJ, 757, 31
- Bessell et al. (1998) Bessell M. S., Castelli F., Plez B., 1998, A&A, 333, 231
- Blinnikov & Bartunov (1993) Blinnikov S. I., Bartunov O. S., 1993, A&A, 273, 106
- Blondin & Tonry (2007) Blondin S., Tonry J. L., 2007, ApJ, 666, 1024
- Bose & Kumar (2014) Bose S., Kumar B., 2014, ApJ, 782, 98
- Bose et al. (2013) Bose S., et al., 2013, MNRAS, 433, 1871
- Bose et al. (2015a) Bose S., et al., 2015a, MNRAS, 450, 2373
- Bose et al. (2015b) Bose S., et al., 2015b, ApJ, 806, 160
- Bose et al. (2016) Bose S., Kumar B., Misra K., Matsumoto K., Kumar B., Singh M., Fukushima D., Kawabata M., 2016, MNRAS, 455, 2712
- Chevalier (1976) Chevalier R. A., 1976, ApJ, 207, 872
- Chugai et al. (2005) Chugai N. N., Fabrika S. N., Sholukhova O. N., Goranskij V. P., Abolmasov P. K., Vlasyuk V. V., 2005, Astronomy Letters, 31, 792
- Chugai et al. (2007) Chugai N. N., Chevalier R. A., Utrobin V. P., 2007, ApJ, 662, 1136
- Dessart & Hillier (2005a) Dessart L., Hillier D. J., 2005a, A&A, 437, 667
- Dessart & Hillier (2005b) Dessart L., Hillier D. J., 2005b, A&A, 439, 671
- Dessart & Hillier (2010) Dessart L., Hillier D. J., 2010, MNRAS, 405, 2141
- Dessart et al. (2013) Dessart L., Hillier D. J., Waldman R., Livne E., 2013, MNRAS, 433, 1745
- Dessart et al. (2014) Dessart L., et al., 2014, MNRAS, 440, 1856
- Eastman & Kirshner (1989) Eastman R. G., Kirshner R. P., 1989, ApJ, 347, 771
- Eastman et al. (1994) Eastman R. G., Woosley S. E., Weaver T. A., Pinto P. A., 1994, ApJ, 430, 300
- Elias-Rosa et al. (2010) Elias-Rosa N., et al., 2010, ApJ, 714, L254
- Elias-Rosa et al. (2011) Elias-Rosa N., et al., 2011, ApJ, 742, 6
- Elmhamdi et al. (2003) Elmhamdi A., Chugai N. N., Danziger I. J., 2003, A&A, 404, 1077
- Faran et al. (2014a) Faran T., et al., 2014a, MNRAS, 442, 844
- Faran et al. (2014b) Faran T., et al., 2014b, MNRAS, 445, 554
- Filippenko (1997) Filippenko A. V., 1997, ARA&A, 35, 309
- Fitzpatrick (1999) Fitzpatrick E. L., 1999, PASP, 111, 63
- Fixsen et al. (1996) Fixsen D. J., Cheng E. S., Gales J. M., Mather J. C., Shafer R. A., Wright E. L., 1996, ApJ, 473, 576
- Fraser et al. (2011) Fraser M., et al., 2011, MNRAS, 417, 1417
- Grassberg et al. (1971) Grassberg E. K., Imshennik V. S., Nadyozhin D. K., 1971, Ap&SS, 10, 28
- Gutiérrez et al. (2014) Gutiérrez C. P., et al., 2014, ApJ, 786, L15
- Gutiérrez et al. (2017) Gutiérrez C. P., et al., 2017, ApJ, 850, 89
- Gutiérrez et al. (2018) Gutiérrez C. P., et al., 2018, MNRAS,
- Hamuy (2003) Hamuy M., 2003, ApJ, 582, 905
- Hamuy & Pinto (2002) Hamuy M., Pinto P. A., 2002, ApJ, 566, L63
- Hamuy et al. (2001) Hamuy M., et al., 2001, ApJ, 558, 615
- Heger et al. (2003) Heger A., Fryer C. L., Woosley S. E., Langer N., Hartmann D. H., 2003, ApJ, 591, 288
- Hendry et al. (2005) Hendry M. A., et al., 2005, MNRAS, 359, 906
- Horne (1986) Horne K., 1986, PASP, 98, 609
- Hosseinzadeh et al. (2018) Hosseinzadeh G., et al., 2018, preprint, (arXiv:1801.00015)
- Howell et al. (2005) Howell D. A., et al., 2005, ApJ, 634, 1190
- Huang et al. (2016) Huang F., et al., 2016, ApJ, 832, 139
- Huang et al. (2018) Huang F., et al., 2018, MNRAS, 475, 3959
- Inserra et al. (2012) Inserra C., et al., 2012, MNRAS, 422, 1122
- Karachentsev & Makarov (1996) Karachentsev I. D., Makarov D. A., 1996, AJ, 111, 794
- Kasen & Woosley (2009) Kasen D., Woosley S. E., 2009, ApJ, 703, 2205
- Kirshner & Kwan (1974) Kirshner R. P., Kwan J., 1974, ApJ, 193, 27
- Landolt (1992) Landolt A. U., 1992, AJ, 104, 340
- Leonard et al. (2002a) Leonard D. C., et al., 2002a, PASP, 114, 35
- Leonard et al. (2002b) Leonard D. C., et al., 2002b, AJ, 124, 2490
- Li et al. (2011) Li W., et al., 2011, MNRAS, 412, 1441
- Maund et al. (2015) Maund J. R., Fraser M., Reilly E., Ergon M., Mattila S., 2015, MNRAS, 447, 3207
- Minkowski (1941) Minkowski R., 1941, PASP, 53, 224
- Morozova et al. (2015) Morozova V., Piro A. L., Renzo M., Ott C. D., Clausen D., Couch S. M., Ellis J., Roberts L. F., 2015, ApJ, 814, 63
- Morozova et al. (2017) Morozova V., Piro A. L., Valenti S., 2017, ApJ, 838, 28
- Mould et al. (2000) Mould J. R., et al., 2000, ApJ, 529, 786
- Nagy & Vinkó (2016) Nagy A. P., Vinkó J., 2016, A&A, 589, A53
- Nagy et al. (2014) Nagy A. P., Ordasi A., Vinkó J., Wheeler J. C., 2014, A&A, 571, A77
- Nugent et al. (2006) Nugent P., et al., 2006, ApJ, 645, 841
- Olivares et al. (2010) Olivares F., et al., 2010, The Astrophysical Journal, 715, 833
- Pastorello et al. (2009) Pastorello A., et al., 2009, MNRAS, 394, 2266
- Patat et al. (1994) Patat F., Barbon R., Cappellaro E., Turatto M., 1994, A&A, 282, 731
- Paxton et al. (2011) Paxton B., Bildsten L., Dotter A., Herwig F., Lesaffre P., Timmes F., 2011, ApJS, 192, 3
- Paxton et al. (2013) Paxton B., et al., 2013, ApJS, 208, 4
- Phillips et al. (2013) Phillips M. M., et al., 2013, ApJ, 779, 38
- Pilyugin et al. (2004) Pilyugin L. S., Vílchez J. M., Contini T., 2004, A&A, 425, 849
- Polshaw et al. (2016) Polshaw J., et al., 2016, A&A, 588
- Poznanski (2013) Poznanski D., 2013, MNRAS, 436, 3224
- Poznanski et al. (2011) Poznanski D., Ganeshalingam M., Silverman J. M., Filippenko A. V., 2011, MNRAS, 415, L81
- Poznanski et al. (2012) Poznanski D., Prochaska J. X., Bloom J. S., 2012, MNRAS, 426, 1465
- Prieto et al. (2008) Prieto J. L., Stanek K. Z., Beacom J. F., 2008, ApJ, 673, 999
- Richardson et al. (2002) Richardson D., Branch D., Casebeer D., Millard J., Thomas R. C., Baron E., 2002, AJ, 123, 745
- Roy et al. (2011a) Roy R., et al., 2011a, MNRAS, 414, 167
- Roy et al. (2011b) Roy R., et al., 2011b, ApJ, 736, 76
- Sahu et al. (2006) Sahu D. K., Anupama G. C., Srividya S., Muneer S., 2006, MNRAS, 372, 1315
- Sanders et al. (2013) Sanders N. E., Levesque E. M., Soderberg A. M., 2013, ApJ, 775, 125
- Sanders et al. (2015) Sanders N. E., et al., 2015, ApJ, 799, 208
- Schlafly & Finkbeiner (2011) Schlafly E. F., Finkbeiner D. P., 2011, ApJ, 737, 103
- Schlegel (1996) Schlegel E. M., 1996, AJ, 111, 1660
- Schlegel et al. (1998) Schlegel D. J., Finkbeiner D. P., Davis M., 1998, ApJ, 500, 525
- Smartt (2009) Smartt S. J., 2009, ARA&A, 47, 63
- Smith et al. (2015) Smith N., et al., 2015, MNRAS, 449, 1876
- Spiro et al. (2014) Spiro S., et al., 2014, MNRAS, 439, 2873
- Stalin et al. (2008) Stalin C. S., Hegde M., Sahu D. K., Parihar P. S., Anupama G. C., Bhatt B. C., Prabhu T. P., 2008, Bulletin of the Astronomical Society of India, 36, 111
- Stanek et al. (2014) Stanek K. Z., et al., 2014, The Astronomer’s Telegram, 6301
- Takáts et al. (2014) Takáts K., et al., 2014, MNRAS, 438, 368
- Takáts et al. (2015) Takáts K., et al., 2015, MNRAS, 450, 3137
- Terreran et al. (2016) Terreran G., et al., 2016, MNRAS, 462, 137
- Theureau et al. (1998) Theureau G., Bottinelli L., Coudreau-Durand N., Gouguenheim L., Hallet N., Loulergue M., Paturel G., Teerikorpi P., 1998, A&AS, 130, 333
- Tomasella et al. (2013) Tomasella L., et al., 2013, MNRAS, 434, 1636
- Tomasella et al. (2018) Tomasella L., et al., 2018, MNRAS, 475, 1937
- Tremonti et al. (2004) Tremonti C. A., et al., 2004, ApJ, 613, 898
- Tsvetkov et al. (2018) Tsvetkov D. Y., et al., 2018, preprint, (arXiv:1801.00340)
- Turatto et al. (1990) Turatto M., Cappellaro E., Barbon R., della Valle M., Ortolani S., Rosino L., 1990, AJ, 100, 771
- Turatto et al. (1998) Turatto M., et al., 1998, ApJ, 498, L129
- Valenti et al. (2015) Valenti S., et al., 2015, MNRAS, 448, 2608
- Valenti et al. (2016) Valenti S., et al., 2016, MNRAS, 459, 3939
- Zhang et al. (2006) Zhang T., Wang X., Li W., Zhou X., Ma J., Jiang Z., Chen J., 2006, AJ, 131, 2245
- de Jaeger et al. (2018) de Jaeger T., et al., 2018, MNRAS, 476, 4592
- de Vaucouleurs et al. (1991) de Vaucouleurs G., de Vaucouleurs A., Corwin Jr. H. G., Buta R. J., Paturel G., Fouqué P., 1991, Third Reference Catalogue of Bright Galaxies. Volume I: Explanations and references. Volume II: Data for galaxies between 0h and 12h. Volume III: Data for galaxies between 12h and 24h.
Appendix A Tables
| Date | JD | Phase∗ | Range |
| (yyyy-mm-dd) | (2456700+) | (d) | (Å) |
| 2014-07-16 | 155.38 | +13.88 | 5200–9250 |
| 2014-07-21 | 160.31 | +18.81 | 3500–7800 |
| 2014-07-24 | 163.35 | +21.85 | 3500–7800 |
| 2014-07-30 | 169.35 | +27.85 | 3500–7800; 5200–9250 |
| 2014-08-02 | 172.29 | +30.79 | 3500–7800; 5200–9250 |
| 2014-08-08 | 178.21 | +36.71 | 3500–7800; 5200–9250 |
| 2014-08-13 | 183.42 | +41.92 | 3500–7800; 5200–9250 |
| 2014-08-31 | 201.20 | +59.70 | 3500–7800; 5200–9250 |
| 2014-09-11 | 212.32 | +70.82 | 3500–7800; 5200–9250 |
| 2014-09-12 | 213.31 | +71.81 | 3500–7800; 5200–9250 |
| 2014-09-15 | 216.10 | +74.60 | 3500–7800 |
| 2014-09-16 | 217.16 | +75.66 | 3500–7800; 5200–9250 |
| 2014-09-21 | 222.20 | +80.70 | 3500–7800; 5200–9250 |
| 2014-10-08 | 239.06 | +97.56 | 3500–7800 |
| 2014-10-09 | 240.23 | +98.73 | 3500–7800; 5200–9250 |
| 2014-10-20 | 251.26 | +109.76 | 3500–7800 |
| 2014-11-01 | 263.02 | +121.52 | 3500–7800; 5200–9250 |
| 2014-11-05 | 267.13 | +125.63 | 3500–7800; 5200–9250 |
| 2014-11-17 | 279.18 | +137.68 | 3500–7800; 5200–9250 |
| 2014-12-01 | 293.09 | +151.59 | 3500–7800; 5200–9250 |
| 2014-12-08 | 300.08 | +158.58 | 3500–7800; 5200–9250 |
| 2014-12-26 | 318.04 | +176.54 | 3500–7800; 5200–9250 |
| 2015-01-03 | 326.04 | +184.54 | 3500–7800 |
| ∗Time since explosion epoch (JD 2456841.50). | |||
| ID | U | B | V | R | I |
|---|---|---|---|---|---|
| (mag) | (mag) | (mag) | (mag) | (mag) | |
| 1 | 16.120.03 | 16.080.01 | 15.460.01 | 15.080.01 | 14.710.01 |
| 2 | 17.110.03 | 16.460.01 | 15.560.01 | 15.070.01 | 14.600.01 |
| 3 | 17.370.03 | 17.270.01 | 16.600.01 | 16.200.02 | 15.790.02 |
| 4 | 16.720.03 | 16.070.01 | 15.130.01 | 14.620.01 | 14.150.01 |
| 5 | 16.410.03 | 16.350.01 | 15.710.01 | 15.310.01 | 14.910.01 |
| 6 | 19.370.04 | 18.040.01 | 16.560.01 | 15.590.01 | 14.650.02 |
| 7 | 15.210.03 | 14.650.01 | 13.770.01 | 13.360.01 | 12.930.01 |
| 8 | 14.340.03 | 14.390.01 | 13.860.01 | 13.560.01 | 13.210.01 |
| 9 | 15.620.03 | 15.340.01 | 14.550.01 | 14.100.01 | 13.640.01 |
| 10 | 15.090.03 | 14.860.01 | 14.150.01 | 13.740.01 | 13.340.01 |
| 11 | 16.570.03 | 16.450.01 | 15.780.01 | 15.390.01 | 15.010.01 |
| 12 | 15.600.03 | 15.750.01 | 15.380.01 | 15.090.01 | 14.800.01 |
| 13 | 18.430.03 | 17.060.01 | 15.730.01 | 14.910.01 | 14.190.01 |
| 14 | 16.150.03 | 16.030.01 | 15.350.01 | 14.970.01 | 14.560.01 |
| Date | JD | Phase∗ | |||||
| (yyyy-mm-dd) | (2456700+) | (d) | (mag) | (mag) | (mag) | (mag) | (mag) |
| 2014-07-15 | 154.31 | +12.81 | — | 16.050.03 | 15.940.03 | 15.720.03 | 15.520.03 |
| 2014-07-16 | 155.38 | +13.88 | 15.540.06 | 16.040.02 | 15.960.02 | 15.730.02 | 15.550.03 |
| 2014-07-21 | 160.31 | +18.81 | 15.930.05 | 16.240.02 | 16.020.02 | 15.750.03 | 15.580.02 |
| 2014-07-24 | 163.35 | +21.85 | 16.260.05 | 16.420.02 | 16.090.02 | 15.780.02 | 15.610.02 |
| 2014-07-25 | 164.24 | +22.74 | 16.350.05 | 16.450.02 | 16.090.02 | 15.770.02 | 15.580.02 |
| 2014-07-30 | 169.35 | +27.85 | 16.850.04 | 16.750.02 | 16.180.02 | 15.830.02 | 15.620.02 |
| 2014-08-02 | 172.29 | +30.79 | 17.120.04 | 16.940.02 | 16.270.02 | 15.900.02 | 15.700.02 |
| 2014-08-03 | 173.30 | +31.80 | — | 17.000.07 | 16.260.01 | 15.840.02 | 15.670.02 |
| 2014-08-08 | 178.21 | +36.71 | 17.550.05 | 17.170.02 | 16.350.01 | 15.910.02 | 15.700.02 |
| 2014-08-09 | 179.12 | +37.62 | — | — | — | — | 15.710.02 |
| 2014-08-12 | 182.21 | +40.71 | 17.720.09 | 17.270.03 | 16.450.02 | 15.970.02 | 15.730.02 |
| 2014-08-13 | 183.42 | +41.92 | — | — | 16.420.02 | 15.970.02 | 15.740.02 |
| 2014-08-27 | 197.19 | +55.69 | — | 17.630.02 | 16.610.02 | 16.100.02 | 15.870.02 |
| 2014-08-31 | 201.20 | +59.70 | 18.610.04 | 17.700.02 | 16.620.01 | 16.110.02 | 15.860.02 |
| 2014-09-11 | 212.32 | +70.82 | 18.840.08 | 17.920.02 | 16.740.01 | 16.210.02 | 15.940.02 |
| 2014-09-15 | 216.10 | +74.60 | 19.230.05 | 18.020.02 | 16.790.02 | 16.290.04 | 15.980.02 |
| 2014-09-16 | 217.16 | +75.66 | 19.300.05 | 18.050.02 | 16.820.01 | 16.260.02 | 15.990.02 |
| 2014-09-21 | 222.20 | +80.70 | 19.440.06 | 18.170.02 | 16.890.01 | 16.310.02 | 16.050.02 |
| 2014-09-27 | 228.15 | +86.65 | — | 18.390.02 | 17.020.02 | 16.450.03 | 16.140.02 |
| 2014-10-08 | 239.06 | +97.56 | 20.610.41 | 19.080.03 | 17.520.02 | 16.840.02 | 16.480.02 |
| 2014-10-09 | 240.23 | +98.73 | — | 19.190.04 | 17.660.02 | 16.930.02 | 16.560.02 |
| 2014-10-10 | 241.07 | +99.57 | — | 19.320.02 | 17.710.02 | 16.970.02 | 16.600.02 |
| 2014-10-20 | 251.26 | +109.76 | — | 20.260.05 | 18.660.07 | 17.830.03 | 17.400.03 |
| 2014-10-28 | 259.17 | +117.67 | — | 20.410.03 | 18.890.02 | 18.000.02 | 17.570.02 |
| 2014-11-04 | 266.13 | +124.63 | — | — | 18.990.02 | 18.110.02 | 17.690.02 |
| 2014-11-17 | 279.18 | +137.68 | — | 20.570.03 | 19.130.02 | 18.250.02 | 17.840.03 |
| 2014-11-23 | 285.06 | +143.56 | — | 20.670.04 | 19.250.02 | 18.350.02 | 17.950.02 |
| 2014-12-01 | 293.09 | +151.59 | — | — | 19.250.03 | 18.350.02 | — |
| 2014-12-04 | 296.11 | +154.61 | — | — | 19.330.03 | 18.430.02 | 18.000.02 |
| 2014-12-08 | 300.08 | +158.58 | — | — | 19.260.02 | 18.430.02 | 18.070.02 |
| 2014-12-19 | 311.04 | +169.54 | — | — | 19.200.02 | 18.460.03 | 18.070.02 |
| 2014-12-26 | 318.04 | +176.54 | — | — | 19.520.02 | 18.590.02 | 18.260.03 |
| 2015-01-03 | 326.04 | +184.54 | — | — | 19.690.03 | 18.760.03 | 18.400.03 |
| 2015-01-25 | 348.07 | +206.57 | — | — | 19.800.04 | 18.780.03 | 18.580.04 |
| ∗Time since explosion epoch (JD 2456841.50). | |||||||
| Distance Method | Distance | Distance Modulus | Reference |
|---|---|---|---|
| (Mpc) | (mag) | ||
| Galactocentric | 45.73.2 | 33.300.15 | 2 |
| Local Group | 46.83.3 | 33.350.15 | 2 |
| CMB Dipole Model | 38.22.7 | 32.910.15 | 2 |
| Virgo Infall only | 45.73.2 | 33.300.15 | 2 |
| Virgo + Great Attractor Infall only | 44.93.1 | 33.260.15 | 2 |
| Virgo + Great Attractor + Shapley Supercluster | 44.93.1 | 33.260.15 | 2 |
| Standard Candle Method | 47.23.6 | 33.370.17 | 1 |
| Mean Distance | 44.83.0 | 33.250.15 |
(1) This paper; (2) NASA/IPAC Extragalactic Database (NED).
Appendix B Figures


