Modeling the Baryon Cycle in Low Mass Galaxy Encounters:
the Case of NGC 4490 & NGC 4485
Abstract
Discoveries of low mass galaxy pairs and groups are increasing. Studies indicate that dwarf galaxy pairs are gas rich in the field and exhibit elevated star formation rates, suggestive of interactions. Lacking are dynamical models of observed dwarf galaxy pairs to disentangle the physical processes regulating their baryon cycles. We present new optical data and the first detailed theoretical model of an observed tidal encounter between two isolated low mass galaxies, NGC 4490 & NGC 4485. This system is an isolated analog of the Magellanic Clouds and is surrounded by a 50 kpc extended HI envelope. We use hybrid -body and test-particle simulations along with a visualization interface (Identikit) to simultaneously reproduce the observed present-day morphology and kinematics. Our results demonstrate how repeated encounters between two dwarf galaxies can “park” baryons at very large distances, without the aid of environmental effects. Our best match to the data is an 8:1 mass ratio encounter where a one-armed spiral is induced in the NGC 4490-analog, which we postulate explains the nature of diffuse starlight presented in the new optical data. We predict that the pair will fully merge in 370 Myr, but that the extended tidal features will continue to evolve and return to the merged remnant over 5 Gyr. This pre-processing of baryons will affect the efficiency of gas stripping if such dwarf pairs are accreted by a massive host. In contrast, in isolated environments this study demonstrates how dwarf-dwarf interactions can create a long-lived supply of gas to the merger remnant.
Keywords:
Key words: galaxies: dwarf - galaxies: evolution - galaxies: interactions - galaxies: kinematics and dynamics. Methods: numericalI Introduction
The impact of mergers on the structure and gas content of massive galaxies has been studied extensively both theoretically (e.g. Toomre & Toomre 85, Barnes 5, Springel & White 77, Dubinski et al. 32, Barnes 9) and observationally (e.g. Arp 1, Sanders et al. 74, Engel et al. 35, Bussmann et al. 22 ). However, the merger sequence and any consequent morphological transformation of low mass galaxies (M M⊙) through tidal processes is not well constrained. There is reason to believe that the merger sequence of dwarf galaxies could differ substantially from that of massive galaxies. Dwarfs in the field have higher gas fractions (Geha et al. 41, Bradford et al. 21), higher dark matter to baryon ratios (e.g. Tolstoy et al. 84) and dwarf mergers are more numerous per unit volume than massive galaxy mergers (Fakhouri et al. 36).
In this work we present the first detailed model of an observed isolated low mass galaxy pair, NGC 4490/4485. We use this model to study in detail the role of tidal encounters with companions in the morphological evolution of low mass galaxies. Detailed dynamically matched models to real systems are needed to age-date the systems, constrain the initial encounter parameters and to understand the timescales involved in the gas cycling due to the interactions. While generic dwarf-dwarf mergers have been modeled in the literature (e.g. Bekki 12, Kim et al. 51), only one observed dwarf-dwarf interaction has been modeled in detail, namely the Large and Small Magellanic Clouds (LMC and SMC) (e.g. Gardiner & Noguchi 40, Bekki & Chiba 14, Connors et al. 27, Besla et al. 16, Besla et al. 17, Diaz & Bekki 30,Guglielmo et al. 43, Pardy et al. 66). Without additional models of isolated, interacting dwarf systems, we cannot assess whether the LMC/SMC scenario is typical of dwarf interactions.
Observational studies of dwarf pairs and groups are growing (Tully et al. 86, Stierwalt et al. 80) providing insight to the role of dwarf-dwarf interactions in the evolution of low mass galaxies. The TiNy Titans Survey (TNT: Stierwalt et al. 79) showed that dwarf galaxy pairs in the field ( 1.5 Mpc from a massive galaxy) appear just as gas rich as their non-paired counterparts, despite exhibiting elevated star formation rates relative to unpaired field dwarfs. Recent work by Privon et al. [72] suggests that dwarf interactions trigger large-scale interstellar medium (ISM) compression, rather than nuclear starbursts often associated with massive mergers. The high gas fractions of dwarfs in the field indicate that dwarfs (with M ) do not fully exhaust their gas through tidal interactions or internal processes (star formation, feedback etc., e.g. Bradford et al. 21) even with their shallower potential wells (e.g. Lelli et al. 55). However, the TNT and Bradford et al. [21] works are based on single dish neutral hydrogen observations (HI). Without resolved imaging it is unclear if the gas is still located within the galaxies or is spatially extended.
This motivated the Local Volume TiNy Titans Survey (LV-TNT: Pearson et al. 70), where we investigated resolved synthesis HI maps and surface density profiles for 10 dwarf galaxy pairs located within 25 Mpc of the Milky Way (MW). We found that tidal interactions between low mass galaxies can “park” gas at large distances and that the gas is only prevented from being re-accreted to the dwarfs if the pairs are in the vicinity of a massive galaxy, as in the case for the Magellanic System. The gas at large distances is not actively participating in the formation of stars, which helps explain why the single dish TNT survey found that dwarf pairs with elevated SFRs could still have high gas fractions. The low mass galaxy pair NGC 4490/4485 is an example of one of the LV-TNT pairs with gas at large distances and will be the focus of this paper. This system is an isolated analog of the Magellanic Clouds that is surrounded by a massive, spatially extended HI complex ( kpc in extent Clemens et al. 24).
In particular, we present a detailed -body simulation that simultaneously reproduces the observed present-day morphology and kinematics of NGC 4490/4485 using Identikit (Barnes & Hibbard 11). Identikit is a hybrid -body and test-particle simulation, which enables a rapid exploration of the parameter space of galaxy mergers. The goal of this study is to utilize Identikit to test whether interactions between NGC 4490/4485 can naturally explain the origin of the observed extended gas complex surrounding the galaxy pair or whether other mechanisms, such as outflows, are necessary (e.g. as suggested by Clemens et al. 24). Additionally, we aim to investigate the timescales involved in cycling gas in an isolated dwarf galaxy interaction and consider the affect of the interaction on the dwarfs involved.

If dwarf-dwarf tidal interactions are shown to be capable of “parking” gas at large distances, there will be important implications to our understanding of the baryon cycle of low mass galaxies. Specifically, hierarchical processes can enable a long-lived gas supply channel for future star formation. Additionally, if the gas remains extended for a long period of time following the interaction, this could greatly affect the efficiency at which gas is stripped from these systems if they fall into a gas rich environment, such as a galaxy cluster or the CGM of a massive galaxy. We follow up the best dynamical match with self-consistent -body simulations that test the match. We do not include hydrodynamics in this study, as we present here a first step towards addressing the plausibility that tidal interactions between a low mass galaxy encounter can generate tidal debris to large distances. Hydrodynamics should not strongly affect the large scale tidal features (Barnes & Hernquist 10).
We will utilize these simulations to explicitly define the NGC 4490/4485 system’s current dynamical state, encounter history and future fate. We further compare the resulting -body simulation to new optical data of the system from the f/8.1 Ritchey-Chretien 0.5-meter telescope of the Black Bird Observatory 2 (BBRO2) to investigate the consequences of dwarf-dwarf tidal interactions to the internal stellar morphology of the galaxies.
The paper is organized as follows: in Section II we present the dwarf pair, NGC 4490/4485. In Section III we describe our dwarf models and the matching process using Identikit (Barnes & Hibbard 11). In Section IV we show the results of our dynamical match to the NGC 4490/4485 pair. We discuss the fate of the HI envelope in Section V. In Section VI we compare our results to the Magellanic System and we discuss the implications of tidal pre-processing and the inflow of gas to the merger remnant. We conclude in Section VII.
II THE NGC 4490/4485 PAIR
The low mass galaxy pair NGC 4490/4485 (presented in Figure 1 and with optical centers marked by cyan and magenta “x”s, respectively) is a slightly more massive analog of the LMC/SMC, with a stellar mass ratio of 8:1 (Clemens et al. 24) and isolated from any massive galaxy. The NGC 4490/4485 galaxies are separated by only 7.5 kpc in projection (the projected separation of the LMC/SMC is 11 kpc). See Table 1 for a comparison of the two dwarf pairs. NGC 4490/4485 resides 7.14 Mpc from the Milky Way (Theureau et al. 83). The nearest massive galaxy (defined as M as in Geha et al. 41) is NGC 4369 which has a stellar mass of M . The projected separation between the pair and NGC 4369 is 300 kpc and the velocity separation to the pair is 400 (Pearson et al. 70). Cosmologically, dwarf galaxy pairs do not remain bound to each other for long when in proximity to a massive galaxy (González & Padilla 42). The relatively isolated environment of the NGC 4490/4485 system thus allows us to examine the evolution of a low mass galaxy pair, independent of environmental factors (see Theis & Kohle 82 and Paudel & Sengupta 68 for examples of simulated dwarf interactions matched to morphological data).
| NGC 4490/4485 | LMC/SMC | unit | |
| Average distance | 7.1411 1 Average distance to pair from Theureau et al. [83]. bAverage distance to pair from Cioni et al. [23]. cStellar mass from van der Marel et al. [88]. dStellar mass from Stanimirović et al. [78]. eHI mass within 2MASS extent: Pearson et al. [70]. fHI mass residing beyond the 2MASS extents of the galaxies: Pearson et al. [70]. gCalculated from the velocity of the gas associated with the optical centers of both galaxies: Clemens et al. [24]. hAs estimated from their Vlos: Besla et al. [17], Kallivayalil et al. [50]. | 0.055b | Mpc |
| Stellar mass | 7.2/0.82 | 2.7c/0.3d | |
| HI masse | 2.4/0.23 | 0.27/0.26 | |
| HI mass outsidef | 1.07 | 0.37 | |
| Projected separation | 7.5 | 11 | kpc |
| Velocity separation | 30g | 116h | |
| Massive host galaxy | NGC 4369 | Milky Way | |
| Av. dist. to host | 310 | 55 | kpc |
II.1 Archival HI data
The system is clearly detected in HI and an HI envelope, first discovered by Huchtmeier et al. [46], symmetrically surrounds the NGC 4490/4485 pair and extends 50 kpc in projection.
The HI data presented in this paper are originally from Clemens et al. [24] and were obtained with the VLA in C-configuration and D-configuration. The velocity of the pair’s HI ranges from to 83 centered at a systemic heliocentric radial velocity of 575 , and the data have a velocity width per channel of 20.7 . The envelope is detected to column densities of N(HI) atoms cm-2, which is close to the sensitivity limit of the data (N(HI) atoms cm-2: Clemens et al. 24). The total gas mass of the system is , where 30% of the gas ( , see Table 1) resides beyond the stellar extents of the two galaxies (defined as beyond the 2MASS extents of each disk; Pearson et al. 70). Based on the relatively isolated environment of the pair, Pearson et al. [70] found it unlikely that ram pressure is playing a significant role in the origin of the extended envelope surrounding the pair.
There is a dense bridge (N(HI) atoms cm-2) of gas connecting the pair (see Figure 1, left: inner HI contour) which suggests a tidal encounter between the galaxies (Toomre & Toomre 85). The bridge material peaks at to with respect to the systemic velocity. GALEX UV data of the system (Smith et al. 76) show that stars are forming in the NGC 4490/4485 bridge. This suggests that the high gas density in the bridge is not due to a chance projection of overlapping gas.
Interestingly, Lee et al. [54] found that NGC 4485 is likely undergoing a starburst, as its H equivalent width is EW , which exceeds the logarithmic mean by 2 limit when compared to the 300 dwarfs in the 11HUGS Dwarf Galaxy Survey (Lee et al. 54). NGC 4485’s star formation rate inferred from the far ultraviolet (FUV) non-ionizing continuum is SFR(FUV) = 0.22 yr-1 (assuming a distance of 7.14 Mpc; see Lee et al. 54 table 1). This is consistent with findings of the TNT survey that the secondary (smaller) galaxy in a dwarf galaxy pair is more likely to be starbursting, and with theoretical expectations of stronger tides acting on the secondary. When compared to the Lee et al. [54] sample, both NGC 4490 and NGC 4485 lie above the 11HUGS vs log(SFR) mean, but are within the scatter of the sample (see Pearson et al. 70).
Using HI data presented in Viallefond et al. [90], Elmegreen et al. [33] computed a rotation curve for NGC 4490 and found that it peaks at a radius of 6 kpc from the center with /sin() 80 , where is the inclination of the primary in the sky plane, which is . A peak rotational velocity of , is similar to that of the LMC (: van der Marel & Kallivayalil 89). These findings are consistent with the Clemens et al. [24] HI data (see their figure 2).
Kinematic constraints are important in breaking model degeneracies that arise when matching only the morphology of galaxy mergers (e.g. Barnes & Hibbard 11). In this work, we assume that the optical centers are approximately the dynamical centers of the two galaxies. Exploring the HI data cube, we find that the gas associated with the optical center of NGC 4485 is at with respect to the systemic velocity. The optical center of NGC 4485 is located to the left of the bridge material (see magenta x vs blue inner HI counter in Figure 1, left). Hence, the position of NGC 4485 is offset from the bridge in position and kinematics, and has lower column densities. Clemens et al. [24] found the gas associated with the optical center of NGC 4490 to be at 10 with respect to the systemic velocity. As the velocity channel widths are 20.7 , we use a velocity center between 0 and 20 with respect to the centered HI cube as our constraint for the line-of-sight velocity.
II.2 Deep optical imaging
Optical data provides further support of a tidal encounter between NGC 4490/4485 (Elmegreen et al. 33, figure 3). In Figure 1 , right, we present new optical data of the NGC 4485/4490 system obtained with the f/8.1 Ritchey-Chretien 0.5-meter telescope of the Black Bird Observatory 2 (BBRO2) in Alder Springs (California) during different dark-sky nights between April 8th-22th, 2012. A 16 mega-pixel Apogee Imaging Systems U16M CCD camera was used, with arcmin field of view and a 0.46 arcsec pixel scale. We acquired a total of 22.66 hours of imaging data in 46 half-hour sub-exposures, using a non-infrared clear luminance Astrodon E-series filter (e.g. see Figure 1 in Martínez-Delgado et al. 58). Each sub-exposure was reduced following standard procedures for dark-substraction, bias-correction and flat-fielding (Martínez-Delgado et al. 59). The surface brightness limit of this image is 29 mag arcsec-2 (see the method for obtaining the surface brightness limit in Martínez-Delgado et al. 60). We see evidence of a tidal encounter through a faint stellar extension to the left of the NGC 4490 galaxy’s main body (Figure 1, right), which interestingly was also identified in Elmegreen et al. [33] in the B band at a surface brightness of 23.5 mag arcsec-2 and in SDSS gri imaging22 2 http://ned.ipac.caltech.edu/img/2011A+A...532A..74B/gri/PGC_041333:I:gri:bbl2011.jpg (Baillard et al. 3) which has a typical surface brightness limit of 24.5 mag/arcsec2. In Elmegreen et al. [33] and SDSS the extension is detected as a narrower tail-like feature extending from the northern part of the NGC 4490 main body. We confirm the existence of this structure and our deeper data reveal this structure to be spanning larger distances ( 8 kpc) in a more plume-like feature extending from the plane of the NGC 4490 disk. There is also HI gas at the location of the plume-like feature (see Clemens et al. 24 for additional HI contour levels, where N(HI)min = 2.34 atoms cm-2).
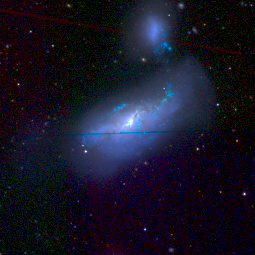
To summarize, the existence of a bridge connecting the two galaxies and a starburst in the secondary is suggestive of strong tidal interactions between the two galaxies that may have resulted in the observed extended gaseous envelope. The NGC 4490/4485 pair is therefore an excellent candidate for testing a dynamically-driven formation scenario for an extended HI envelope through a dwarf-dwarf encounter. Despite such tidal encounters, the primary NGC 4490 still possesses a disk with a well-defined rotation curve. We seek to reproduce these properties using a tidal interaction model.
III Dynamical Simulations
When modeling the mergers of galaxies, several degrees of freedom exist and searching the full parameter space of a galaxy merger can therefore be time consuming. As discussed in detail in Barnes & Hibbard [11], to model the dynamical interaction of two disk galaxies, the mass ratio (), disk orientations (, ) and (, ) following the definition in Toomre & Toomre [85], the eccentricity of the orbit () and the pericentric separation () need to be specified. Hence, seven parameters are needed to model the dynamical interaction, without accounting for the internal structure of the galaxies. An additional nine parameters are needed to compare the models to observations: the length scale (), the velocity scale (), the center of mass position on the plane of the sky (), the center of mass velocity (), the viewing angles () and the time of viewing (). Without varying the internal structure of the galaxies involved (e.g. dark matter to baryon fractions, scale lengths etc.) 16 free parameters are present.
In this work, we use Identikit (Barnes & Hibbard 11 and Zeno (Barnes 7) to explore the parameter space of the NGC 4490/4485 interaction. Our procedure is summarized as follows:
- 1.
We build a library of encounters using hybrid test-particle disks embedded in live -body dark matter halos with a fixed orbital eccentricity, and vary the mass ratios and pericentric separations of the two galaxies.
- 2.
We load the test-particle simulations and projections of the data into the Identikit visualization interface and vary the disk orientations, viewing angles, time of viewing, scaling and center of mass position of the galaxies in order to identify the best match to the HI kinematic and morphological data of the NGC 4490/4485 system.
- 3.
Based on our best match obtained with the test-particle simulations, we run a small set of -body simulations of galaxy encounters with self-gravitating disks embedded in live dark matter halos. For these we fix the eccentricity, mass ratios, disk inclinations and scalings, but allow for the time and viewing angles to be varied along with a small set of pericentric separations.
Identikit was initially tested by Barnes & Hibbard [11] on 36 artificially constructed mergers of massive galaxies. They demonstrated that, in cases where the merging system displayed prominent tidal features, the viewing directions, spin orientations and time since pericenter were well recovered, while the pericenter separation showed the largest scatter. Additionally, the velocity scalings showed a bias for dynamically cold massive galaxy disks, as the test-particles in Identikit have zero velocity dispersion.
Re-simulating the galaxy interactions with a self-gravitating disk is an important test to verify the overall morphology. The global morphology and kinematics (the focus of this paper) should not be strongly modified by self-gravity in contrast to self-gravitating features such as spiral arms (Privon et al. 71). See Barnes & Hibbard [11] for a detailed description on the Identikit methodology and visualization techniques.
In the following, we describe the details of the galaxy mass models (Section III.1), the library of Identikit test-particle simulations and the matching procedure (Section III.2) as well as the self-gravitating -body follow-up simulations (Section III.3).
III.1 Galaxy Models
Using Zeno (e.g. Barnes & Hibbard 11, Barnes 7), we set up two galaxy mass models mimicking the primary (more massive) dwarf (NGC 4490) and secondary (less massive) dwarf (NGC 4485), respectively. We construct galaxy mass models with the same parameters as presented in Barnes & Hibbard [11] but we omit the bulge, such that our galaxy models are more dwarf-like. See Barnes & Hibbard [11] Appendix B for a detailed description of the galaxy construction in Zeno. The galaxy models were set up in approximate initial dynamical equilibrium (Barnes 8). Each galaxy consists of an NFW dark matter halo (Navarro et al. 63), which tapers at large radii () following Springel & White [77]:
| (1) |
where is the halo mass within the scale radius of the halo () and and are fixed by requiring that both and are continuous at .
The disk follows an exponential radial profile (Freeman 38) and a sech2 vertical profile (van der Kruit & Searle 87):
| (2) |
where ( are cylindrical coordinates, is the disk scale radius, is the disk scale height and is the mass of the disk. For the secondary galaxy, we setup mass models with 1/4th, 1/6th and 1/8th of the mass of the primary galaxy. The scale length of the smaller galaxy is scaled accordingly to maintain constant mass surface density.
In both galaxies, 20% of the mass is made up by baryons and 80% of the mass is dark matter (see Section IV.1.4 for the affect of variations on these values). The ratio of the disk scale radius, , to dark matter halo scale radius, , is in both the primary (more massive) and secondary (less massive) galaxy model. The galaxy encounters are run in simulation units and then the scale factors are fit during the matching process. All model parameters are listed in Table 2.
We ran isolated realizations of both galaxy mass models to check their long-term stability. Initially both galaxies are unstable to bar formation due to omission of the bulge. A bar forms after 2 rotation periods at 3 disk scale lengths ( = 2, see Table 2 for the scale from simulation to physical units in our match)33 3 Note, we ran the galaxies in isolation and re-ran a simulation of the encounter using disks in which the bars had formed and settled prior to the encounter. This did not change the overall results of our preferred match. However, the specific location of induced spiral arms might be affected slightly by the bar’s phase at the time of match (see also Barnes 6, Privon et al. 71 for a discussion on bar misalignments in the Mice: NGC 4676A/B)..
III.2 Identikit test-particle simulations and matching
To explore the parameter space of the NGC 4490/4485 encounter, we build a library of dwarf encounters with various mass ratios () and initial pericentric separations ranging from in increments of 0.75 , where is the disk scale length of the primary galaxy. We limit our investigation to orbits as e 1 orbits imply a previous encounter (see Barnes & Hibbard 11). The eccentricity will evolve over the course of the encounter owing to dynamical friction.
We create two self-consistent galaxy halos (see previous section) and specify the eccentricity of the orbit and the pericentric separation. We place the galaxies’ initial positions such that their dark matter halos are not overlapping and the velocities are set based on an initial idealized point-source Keplerian orbit. The galaxies are evolved in time using a standard treecode (Barnes & Hut 4, Barnes 7) and initially follow a Keplerian orbit, however the orbit rapidly decays due to the dynamical friction from the live -body dark matter halos. The initial pericentric pass of the idealized point-source Keplerian orbit is slightly smaller (see Section IV) than the initial pericentric pass including the extended live -body dark matter halos. Throughout the paper we quote the non-idealized pericentric separations.
Both dark matter halos are populated with a spherical distribution of massive particles that has the same cumulative radial mass distribution as for the initial stellar disks. These spheres are populated with multiple disks of test particles on circular orbits. This is similar to populating each galaxy with all possible disk configurations, although the test-particles do not have mass and are therefore not self-gravitating (see Barnes & Hibbard 11 for a detailed description).
After completing a library of test-particles simulations, we load them into the Identikit visualization software along with the HI data (see Section IV.1.2) and decide which disk to display. Subsequently, we require the simulated galaxies’ positions (, ) and velocities () to agree with the observed galaxy positions and velocities. In real time, we then vary the disk orientations (, , , ), the viewing angles () and the scaling () of the system, while stepping through time (), mass ratio () and pericentric separations () until we obtain a good match to the data (see Barnes & Hibbard 11, Privon et al. 71 for a detailed description of the matching procedure).
The key features we aim to reproduce are: 1) the position of the two galaxies; 2) the tidal debris populating the symmetric envelope (north and south) morphologically and kinematically; 3) the optical centers of NGC 4490/4485 in position (see x’s in Figure 1, left) and velocity space; 4) that the orbit of the secondary passes through the dense bridge material (see Figure 1, left, inner blue contour) both in the morphological and kinematic panels of the Identikit visualization interface in order to have a plausible formation scenario for the dense bridge (e.g. ram-pressure from passing through the NGC 4490 disk: Condon et al. 26, Clemens et al. 25, Gao et al. 39). We also test matches in which the orbit does not pass through the dense bridge material in the data (see Appendix), as the bridge could in principle be purely tidal (Toomre & Toomre 85).
Using the test-particle simulations visualized in the Identikit interface, we scale the system so that it matches the observed extent on the sky. The scale lengths of the galaxies might be affected by the tidal interaction, so the scale length inferred for the progenitor galaxy does not necessarily have to be the present-day scale factor. However, once we find a good match we use the scale lengths as a sanity check such that we obtain a physical size scale mimicking these types of galaxies. In particular, we require that the scale length of the primary disk, , is at least kpc. None of our matches had scale lengths larger than that of the LMC disk scale length in the Besla et al. [17] models (1.7 kpc), hence we did not set a strict upper limit for the scale length when exploring our matches. Once we obtain a physical scaling, we search for test-particle simulation matches that approximately reproduce the physical separation of the galaxies at present day (i.e. kpc in projection). In addition to the physical size scale, we ensure that the extent of kinematic data mimics that of our primary galaxy as we match our simulation output to the HI data in the Identikit visualization interface. As a sanity check, we also compute the rotational velocity curve for our primary galaxy and check whether it is consistent with the observed HI rotational velocity curve from Elmegreen et al. [33], peaking at .
III.3 Self-consistent N-body simulations
After obtaining a dynamical match to the system using the test-particle simulations (see Section III.2, IV.1), we run a self-consistent collisionless -body simulation including self-gravity of the disks. We compare this simulation to the test-particle simulation to check whether a more realistic disk treatment changes our match to the tidal features. Using the -body follow-up with self-gravitating disks, we investigate if the match is affected by the slightly different dynamical friction that arises due to the higher local density in the self-consistent stellar disks. We do not include hydrodynamics in our simulations and the baryonic mass is therefore assumed to be a combination of stars and gas throughout this paper. These simulations will be followed up with full hydrodynamics in future studies. The goal of this study is to assess the plausibility that tides can create tidal structures similar in extent and kinematics as the observed HI envelope.
The self-gravitating -body model presented in this paper utilizes the mass models in Section III.1 and encounter parameters based on the best match using the test-particle simulations, introduced in Section IV.1. To test the sensitivity of our best-match to encounter parameters in the full -body simulation, we also run three different initial pericentric separations, , centered on the value obtained for the best match in the test-particle simulations.
We load the output of the self-gravitating encounter into the Identikit visualization software with the same viewing angles, (), and scalings (, ) as obtained for our best match in our test-particle simulations. Subsequently, to investigate potential differences between the test-particle match and the -body follow-up, we test the viewing angles, scaling of the system and pericentric separation at different points in time in the simulation to assess the quality of the match to the observational data.
IV Results
In this section we detail the best-match parameters (see Section III.2) obtained using the Identikit test-particle simulations and visualization interface and we present and analyze the -body follow-up with self-gravitating disks (Section IV.1). Additionally, we describe the formation mechanism of the extended tidal envelope (Section IV.2) and the morphological consequences of the interaction on the primary galaxy (Section IV.3). We reiterate that the goal of our study is not to reproduce every detail of the NGC 4490/4485 system, but to explore whether there is a plausible dynamical solution for which the kinematics and morphology of its baryonic distribution can be quantitatively matched through a tidal encounter between the two galaxies. This is the first time Identikit has been used to simulate a dwarf-dwarf merger.

| Identikit match scalings | simulation units (sim) | physical |
|---|---|---|
| Velocity | 1 | 82.5 km s-1 |
| Time | 1 | 118.7 Myr |
| Length | 1 | 10.02 kpc |
| Mass | 1 | 1.58 M⊙ |
| Primary Galaxy | Secondary Galaxy | |
| Simulation properties | ||
| Grav. soft. (sim)/physical | (0.00375)/0.0375 kpc | |
| Particle no. dark matter | 65536 | 32768 |
| Particle no. baryonic | 65536 | 32768 |
| Particle mass dark matter | 244,141 M⊙ | 61,035 M⊙ |
| Particle mass baryons | 61,033 M⊙ | 15,259 M⊙ |
| Dynamical properties | ||
| tstart (initial conditions) | ||
| (sim)/physical | (1)/ M⊙ | M⊙ |
| (sim)/physical | (0.25)/4 M⊙ | (0.03125)/0.5 M⊙ |
| f | 0.25 | 0.25 |
| (idealized Keplerian orbit) | (0.25)/2.5 kpc | |
| (simulation orbit) | (0.35)/3.5 kpc | |
| rdisk (sim)/physical | (1/12)/0.835 kpc | (1/33.941)/0.295 kpc |
| zdisk (sim)/physical | (0.0125)/ 0.125 kpc | (0.00442)/0.044 kpc |
| ahalo (sim)/physical | (0.25)/2.505 kpc | (0.0884)/0.886 kpc |
| bhalo (sim)/physical | (0.975)/ 9.77 kpc | (0.3448)/ 3.45 kpc |
| chalo | 3.9 | 3.9 |
| ()-disks | (58 ,115 ) | (32 ,92 ) |
| kpc | ||
| tmatch (present day) | ||
| Mdisk,baryons() | 3.76 M⊙ | 0.33 M⊙ |
| 43 | ||
| 9.3 kpc | ||
| 6.5 kpc | ||
| Viewing angles | (87, 309, 55) | |
| Galaxy inclination sky view | 70.0 | 88 |
IV.1 The dynamical match to NGC 4490/85
Our best test-particle simulation match to the data of NGC 4490/4485 has a galaxy mass ratio of , and a first pericentric separation of (3.5 kpc).
Subsequent to obtaining the best test-particle simulation match, we run three -body follow-up simulations with self-gravitating disks and pericentric separations close to the value for the best test-particle match (). When we load these into the Identikit visualization interface, we find that for the three -body follow-ups, the best agreement with the data was still for the case, with minor variation from the test-particle match by a few degrees in the viewing angles of the system. We therefore present and analyse only the -body follow-up with throughout this section. In Table 2 we present the specific scalings and galaxy properties obtained in our match. The -column describes the initial conditions with the scaling values from the best-match applied. The column describes the properties at the time of match (i.e. present day, Gyr).
For our best -body match, the two galaxies are separated by 28 kpc at the beginning of the simulation (tstart = -1.528 Gyr) and initially follow a Keplerian () orbit (see Figure 2). The idealized Keplerian orbit has an initial pericentric separation of kpc, however the first pericentric passage using the extended galaxies from the -body and test-particle simulations deviates slightly from the idealized Keplerian orbit, resulting in a pericentric approach of kpc (see Figure 2).
The first pericentric passage occurs Gyr after the start of the simulation and the orbit decays due to dynamical friction between the galaxies. The time of match ( Gyr) occurs between the second and third pericentric passage, close to apocenter, and is 1.29 Gyr after the first pericentric passage between the two galaxies. The viewing angle that affords the best match is aligned with the orbital plane. Hence from our perspective, the tidal tails are aligned along our line-of-sight (see Figure 3). In the following we discuss the orbital solution of the match (Section IV.1.1), the morphology of the match (Section IV.1.2), the kinematics of the match (Section IV.1.3) and the initial properties of the primary and secondary galaxy (Section IV.1.4) in detail.
IV.1.1 The orbit
The secondary galaxy has a prograde spin with respect to the orbital angular momentum vector enabling substantial mass loss such that the envelope is mainly produced from material from the secondary galaxy (see magenta particles in Figure 3). In Figure 2 we show the evolution of the primary and secondary galaxies’ nuclear separation (left), velocity separation (middle) and the secondary’s orbital evolution around the primary galaxy (right) for the -body simulation of the match shown in Figure 3. The color bar illustrates the time evolution with respect to present day, which is the time of the best match in the simulation ( Gyr). The physical scaling is based on the best match (see Table 2) and assuming a distance of 7.14 Mpc (Theureau et al. 83) to the system. At the time of match (red solid line), two close encounters have occurred ( kpc, kpc) and the primary galaxy’s tidal field strips material from the secondary at each close encounter.
The fact that the match (red solid line) occurs close to apocenter, where the two galaxies are farthest apart, is not surprising as this is the point in their orbit at which they spend the most time (i.e. move at the lowest velocity, see Figure 2 middle panel). In Figure 2, left, we show that the galaxies are separated by 9.3 kpc ( 6.5 kpc) at the time of match and that the relative velocity between the two nuclei is 43 km s-1 (Figure 2, middle) in good agreement with observations (see Table 1).
The time between the first and second pass is 1.1 Gyr, and following the simulation after the time of match reveals the prediction that the dwarfs coalesce Gyr after the first pericentric passage (370 Myr after the time of match: Figure 2, left, gray vertical line). Thus, due to the large mass ratio between the two galaxies and their orbital configuration capturing the two galaxies separately as an interacting pair is not a short-lived stage (see also Besla et al. 18). Similar merger timescales are also found for high mass ratio encounters for massive galaxies (see e.g. Cox et al. 69, Patton et al. 67, Jiang et al. 48).
Given the decay time of 1.7 Gyr, which is quite rapid compared to a Hubble time, our best match orbit indicates that the two galaxies likely formed very far apart and have had a long infall time as we still observe the two galaxies separately today. This provides dynamical insight to the survivability of these types of of low mass galaxy pairs and groups (e.g. Stierwalt et al. 80). Our study suggests that close pairs viewed today are likely to have begun their encounter on high eccentricity orbits to prevent rapid merging and are unlikely to have survived as bound systems for a Hubble time.

The third panel of Figure 2 shows the evolution of the secondary’s orbit around the primary in the plane of the sky. The orbit is centered on the primary galaxy, the initial position of the secondary is marked by the magenta star and the red star indicates the position of the secondary at the time of match. From our viewing perspective the secondary galaxy is initially on a high inclination orbit with respect to the disk plane of the more massive galaxy, spanning 30 kpc in the Declination direction and only 15 kpc in the Right Ascension direction.
We stress that when exploring the Identikit library, we found that the extended morphology of the envelope could generically be reproduced by this broad type of orbital configuration. However reproducing the details of the match and its kinematics required narrowing down the free parameters of the disks (see Section IV.1.3).
IV.1.2 The morphology of the preferred match
Figure 3, panel a) shows the morphology of the observed (grey scale) and simulated data (colored points) in RA-Dec. The magenta particles (secondary galaxy, NGC 4485 analog) in Figure 3, panel a) populate both the north and the south of the data morphologically. The magenta particles are partially made up of a long tidal tail stripped from the secondary on its first pericentric passage which wraps around the primary galaxy as a roughly symmetric 50 kpc envelope when viewed from our perspective. Hence, the viewing angle places the tail stripped in the first pass mostly along the line-of-sight, populating both the northern and southern envelope, which explains why the tidal tails do not look like long thin features (e.g. as the case for the Antennae galaxies: Toomre & Toomre 85). The fact that the match occurs between the second and third pericentric passage, allows for the tidal tail from the secondary galaxy’s first pericentric pass to grow and populate the full extent of the kpc HI envelope. Additional material stripped at the second pericentric passage (see material north of the magenta main body, Figure 3 panel a) also contributes to the HI envelope.
IV.1.3 The kinematics of the preferred match
Figure 3, panel b) shows line-of-sight velocity vs. position (vel-Dec) with increasing velocity from left to right. Panel c) shows the position vs velocity (RA-vel), where the velocity is increasing from bottom to top. The data and magenta particles in the tail feature in the lower right part of panel c) is marked by a white arrow in each of panels a, b, and c, although the contrast in Figure 3 does not highlight the observational data clearly in this region. This feature is the end of the tail produced in the first pericentric passage, which wraps around the system when viewed from our perspective (see Section IV.1.2). This structure populates both the north and the south of the envelope morphologically and kinematically. To reproduce this “end-of-the-tail” feature, a specific configuration was required: viewing angles , , and secondary disk orientation: , . We explored the acceptable range in the viewing angles by varying them in the -body follow-up until the simulated particles no longer provided a good match to the system. Via this approach we found that the approximate uncertainty on each viewing angle is . We carried out the same test for the disk orientation using the test-particle simulation (we cannot vary the disk inclinations in the -body follow-up, as they are modeled self-consistently) and found that the approximate uncertainty was and .
To match the morphological and kinematic gradient along the primary’s body while matching the extended tidal debris required a specific disk orientation (, ) for the primary. We explored the acceptable range in the primary disk orientation by varying , in the test-particle simulation until it no longer provided a good match to the system. Via this approach we found that the approximate uncertainty on the primary disk orientation is and .
Observational data marked by the red arrow in Figure 3, panel b are unpopulated by magenta or cyan particles. This observational feature corresponds to the higher column density bridge material at to (see Section II.1). We see the secondary move through the disk of the primary during the most recent passage, but this feature likely is not reproduced due to the lack of hydrodynamics in our simulations (see Section III.2 and Section VI.3). As pointed out by Clemens et al. [25], gravitational forces do not distinguish between gas and stars in a galaxy encounter, and that NGC 4485 could experience ram pressure stripping as it moves through the extended HI distribution. In our model, NGC 4485 passes through the gaseous disk of NGC 4490, and therefore will experience significant ram pressure stripping during this time. More gas would be thus be stripped than by tides alone. This is also the theory to explain why the Magellanic Bridge has a higher gas density than the Magellanic Stream (Besla et al. 17). Clemens et al. [25] additionally pointed out that this picture is consistent with the fact that the HI distribution of NGC 4485 is offset from its optical counterpart, and that there is evidence of a bow-shock ahead of the stripped gas. In future work, we plan to test the hypothesis that the gaseous bridge can be reproduced by including hydrodynamical effects in our simulations (see also Section VI.3).
We use the optical centers as additional constraints on the model. The secondary galaxy (magenta particles) is therefore located at and the primary galaxy is centered at (see Section II.1). We reproduce both the kinematic position of the primary and secondary in panel b and c.

IV.1.4 Initial properties of the primary and secondary
Throughout the paper we have used mass models mimicking those of massive galaxies (see Section III.1, Barnes & Hibbard 11). In Figure 4, left we show the disk rotation curve and the mass profiles of our primary and secondary galaxy models at the beginning of our simulation scaled based on the best match parameters (see Table 2). For the primary galaxy, our rotation curve peaks at , which is the same value as obtained for the observational HI rotation curve (Elmegreen et al. 33). We used the kinematic extent of the data as part of the Identikit matching procedure (see Figure 3 panel b, c), so it is encouraging that our initial conditions based on our preferred match are consistent with the observed present day rotation curve for NGC 4490. Our primary galaxy’s rotation curve peaks at slightly smaller radius than what Elmegreen et al. [33] found (6 kpc), which could be addressed with a different mass model. There is no observational rotation curve available for the secondary galaxy, and we expect hydrodynamical effects to have distorted the present day HI within NGC 4485 as it has recently passed through NGC 4490 (see discussion in VI.3). Our secondary’s simulated rotation curve peaks at in the beginning of the simulation, which is similar to that of the SMC ( at 3 kpc: Stanimirović et al. 78) if it is modeled.
Based on our match the implied total initial baryon mass of the primary and secondary in the simulation are and , respectively (see Table 2 and Figure 4, right). This initial baryonic mass is a factor of lower compared to the total baryon mass in the data (see stellar masses, HI masses and envelope HI mass in Table 1). Obtaining a better match to the NGC 4490/4485 system would require carefully altering the mass models by making the halos less concentrated and then adding mass back in baryons, which is beyond the scope of this paper. We stress that where we can compare to data (i.e. the NGC 4490 rotation curve), our simulated galaxy mass profiles are consistent with observations (see rotation curves Figure 4, and morphological and kinematic match in Figure 3).
Compared to what we would expect from abundance matching (e.g. Moster et al. 62) the halo masses for our two galaxies are quite low: and , respectively (Table 2 and total enclosed mass in Figure 4, right). The observed stellar mass ratio is 8:1, but in our simulation both the stellar mass ratio and halo mass ratios are 8:1. If the two galaxies were isolated, from abundance matching (using Eq. 2 in Moster et al. 62) we obtain a halo mass of for NGC 4490 and for NGC 4485 (see Table 1). This corresponds to a halo mass ratio of although there is a large scatter in the Moster et al. [62] abundance matching relation at small stellar masses. The dark matter halo mass at large radii is therefore not well constrained by our simulation match, and it is possible that more dark matter mass is present at larger radii than in our galaxy mass models presented here (Figure 4, right).
As a sanity check of the robustness of our retrieved encounter geometry, we explored mass models with galaxies more consistent with expectations from CDM with less baryons as compared to dark matter (3% baryons as opposed to 20%), and larger halo concentrations ( instead of ). We found that using the same viewing angles, disk angles, time of match and initial pericentric separations the match did not significantly change although this resulting match favored more massive halos (by a factor of 3.5). Hence the encounter geometry seems robust to the specific choice of mass model. In Section V.2 we discuss the consequences of our lower dark halo mass models when we explore the fate and return timescales of the envelope.
See the Appendix for a discussion of alternative matches which reproduce the character of the system, but do not provide as satisfactory matches.
IV.2 The Formation of the Extended HI Envelope

The match presented in the previous subsection demonstrates that the extended kpc HI envelope can be reproduced through a dynamically-driven dwarf-dwarf tidal encounter formation scenario. While outflows might serve to add more mass to the envelope, our results show that a mutual interaction between two dwarf galaxies can move baryons to very large distances through tides alone, without the presence of outflows, tidal stripping through the Lagrange points due to a host galaxy’s tides (e.g. a Milky Way) or ram-pressure effects. In this section we investigate the formation of the extended envelope and the mass and tail evolution of the tidal debris (see Sections IV.2.1 and IV.2.2). Throughout the rest of the paper we alternate between showing the system in the plane of the sky and in a “top-down” view (RA vs line-of-sight distance as in Figure 3, panel d). This enables us to highlight various features of the extended tidal debris.
Figure 5 illustrates the evolution of the baryonic density distribution of the NGC 4490/4485 system throughout their encounter, projected along our line-of-sight. Initially the two galaxies are separated by = 28 kpc. The first pericentric passage occurs at Gyr (between the and Gyr panels). In the first three panels we see the formation of the envelope and the subsequent panels show its predicted evolution. From our viewing perspective the debris stripped from the secondary in the first pericentric passage wraps around the primary’s disk.
The middle, left panel of Figure 5 shows the system at the time of match, where a large 50 kpc (projected) envelope surrounds the two dwarf galaxies which are separated by 9.3 kpc corresponding to a projected separation of 6.5 kpc. The surface density of material in the large envelope is a factor of lower than the densities in the main bodies, and the tidal debris in the north and south of the envelope is of similar surface density, which is consistent with the Clemens et al. [24] observations.
Figure 5 additionally shows that the debris continues to grow in size throughout the encounter and the bulk of the material does not immediately return to the system. In particular, the debris field will persist and should be observable long after the system coalesces (at 370 Myr). In the last snapshot we see that the final system will look like a companionless galaxy surrounded by a system of gaseous streams, although the exact properties of the merger remnant will depend on dissipational effects which are not included in this analysis.
IV.2.1 Evolution of the Baryonic Disk Mass Distribution
To quantify how much baryonic material is pulled out in tidal structures during this encounter, in Figure 6 we show the fraction of the baryonic particles removed from the primary and secondary by their mutual tidal forces as a function of time. The two galaxies are investigated separately, and we do not account for transfer of mass between the two galaxies in this plot. Instead, at each time step we evaluate the amount of mass beyond the listed radius (5 or 7 the scale radius) of each galaxy separately.
Initially (at Gyr), all baryons reside within 7, where is the disk scale length of each galaxy, listed in Table 2. After each pericentric passage both galaxies become more extended and/or have baryons pulled out in tidal features. Fractionally, the secondary loses much more material than the primary at each pericentric passage in the simulation (see Figure 6, magenta vs cyan points). This is due to the high mass ratio between the two galaxies and the fact that the secondary is spinning prograde with respect to its orbit around the primary (e.g. Toomre & Toomre 85, D’Onghia et al. 31, Sengupta et al. 75). While some of the secondary’s particles do end up within 7 disk scale radii of the primary ( of the secondary’s particles after both the first and second pericentric pass), the point here is to track which galaxy loses the most mass fractionally in the encounter.
The mass loss occurs at pericenter, with little evolution in the mass profile between pericenters. At the time of match (Figure 6, red vertical line) 34% of the baryons from the secondary galaxy reside outside , and only 6% of the primary’s baryons are beyond 7. Interestingly, the difference between the amount of material within 5 and 7 at a given time step is larger for the primary galaxy than for the secondary after the first pericentric pass (the blue circles vs. stars are more separated than the magenta circles vs. stars). This indicates that the primary is being morphologically affected by the secondary, despite the high mass ratio of (see Section IV.3 for a discussion of this).
Observationally, the amount of HI gas outside the stellar disks of NGC 4490/4485 is MHI(outside) (as defined in Pearson et al. 70, table 2, 3 and shown as red ellipses in their figure 1). This estimate was done defining the size of the stellar disks of NGC 4490/4485 as 4 times the -band scale length from the 2MASS catalog. This corresponds to kpc and kpc for NGC 4490/4485 respectively44 4 Note that 4 times the -band scale length from the 2MASS catalog yields extents which are similar to the extents of both galaxies: kpc (Elmegreen et al. 33) and kpc (The NASA/IPAC Extragalactic Database, NED) for NGC 4490 and NGC 4485, respectively assuming a distance to the pair of 7.14 Mpc., which is slightly larger than but comparable to 7 disk scale lengths used for our analysis in this paper (7 kpc and kpc). In our simulation at the time of match the amount of baryons beyond 7 disk scale radii of the primary and secondary galaxies correspond to and , respectively (see Table 2). Hence in our match, a total baryon mass of resides outside the galaxies at the time of match, which is similar to the observed value for MHI outside the 2MASS extents of the galaxies.
While it is encouraging that this number is the right order of magnitude, we do not distinguish between stars and gas in our baryon mass budget. In this section we are comparing to HI observations, but stars should similarly be tidally removed in the interaction. As mentioned in Section IV.1.4, varying the mass models (e.g. the disk extent, halo concentration, halo mass) could change the amount of mass lost from the baryonic disks during the encounter. In this work we have matched the simulations to HI data, and typically gas disks are more extended than stellar disks (Swaters et al. 81) which could ensure that the tidal debris would be primarily made of gas, rather than stars. This is the explanation commonly invoked to explain the lack of stars in the Magellanic Stream (Besla et al. 17).
IV.2.2 Visualizing the Tidal Tail Debris

To explore in detail how the tidally removed material evolves relative to the galaxies, in Figure 7 we investigate the “top-down” view (RA vs line-of-sight distance) of the simulation (see blue arrow in panel c for the observers line-of-sight view, which would recover the perspective plotted in Figure 5). In particular, we show the morphological evolution of the particles beyond 7 disk scale radii of the secondary dwarf (see magenta stars in Figure 6) at three different times (Figure 7, panel a through c). To ensure that the tidal features have had time to grow, the first time step is near the first apocenter (see Figure 2, left). The color scale indicates the 3D distance of each particle from the center of the secondary galaxy at each time step. In this projection, the orbit of the secondary around the primary is confined within the blue box in the first panel and is shown here for scale. The magenta star indicates the position of the secondary in each panel, and the first three panels are centered on the position of the primary dwarf.
Figure 7 shows that the tidal tail produced in the first passage grows kpc beyond the physical scale of the orbit. As expected, the tail does not stay in the plane of the orbit due to the offset between the orbital plane and the inclination of the secondary dwarf. Panel c) shows the time of match “top-down” view and the blue arrow indicates our viewing perespective of the system. At the time of match the tail initially raised at the first pericentric passage has grown to be 175 kpc in size. Interestingly, the ongoing Arp 299 galaxy merger (Hibbard & Yun 45) has one of the longest HI tails observed (180 kpc in projection) and is a factor of 10 more massive than the NGC 4490/4485 system. The true 3D length of Arp 299 might be even longer than 180 kpc due to projection effects and the sensitivity of the observations. The fact that the dwarf encounter between NGC 4490/4485 produces a tail of similar length emphasizes that low mass dwarf-dwarf encounters can have dramatic effects, similar to the tidal distortions induced by interactions between massive galaxies. When we rotate the system into the plane of the sky (Figure 7, panel d), the long tail wraps around the primary galaxy as a roughly symmetric 50 kpc envelope when viewed from the Earth (as described in Section IV.1.2).
IV.3 Consequences for the primary galaxy

In this section we investigate the effect of the repeated interactions with the secondary on the primary dwarf in our simulation. In Figure 6, we found that the primary gets more extended and that a small fraction of its baryons reside beyond 7. Additionally, we presented diffuse starlight extending towards the left of the primary’s main body in optical observations in Figure 1 (right) but we did not include this feature as one of the Identikit matching parameters. Can this structure be caused by perturbations of the primary’s stellar disk from interactions with the secondary?
In Figure 3, panel a) there is an off-centered extension of the primary disk body to the left (cyan particles). This is a common feature of each simulation where the secondary has a close encounter with the primary. Figure 3, panel d) shows the “top-down” (RA vs line-of-sight distance) view of the simulation, where a spiral feature is evident in the primary (cyan) galaxy. In order to investigate how this structure compares to the diffuse extension of NGC 4490 seen in the optical data (Figure 1, right), we explore the structure of the primary galaxy at the time of match in Figure 8. In panels a and b we plot the face-on and plane-of-the-sky density projections of the baryons in the primary dwarf.
The gray box is overlayed to highlight the location of the diffuse starlight in the optical observations (Figure 8, panel c, black arrow). The primary dwarf indeed appears to be extended in the direction of the diffuse starlight from our viewing direction (panel b), and when viewing the primary’s baryonic disk face on, we see that the extension is due to the presence of a one-armed spiral extending from the main body (panel a). The feature is moving towards us at the time of match (panel d). We postulate that the diffuse starlight in the plume-like feature seen in panel c, is extended debris from the primary. This hypothesis can be tested with future observations of the color and magnitude of the plume feature as compared to NGC 4490’s main body.
This asymmetric one-armed spiral is formed during the second pericentric passage and persists for 300 Myr (see also Lang et al. 53, Besla et al. 18) after which it is destroyed due to the third pericentric close passage ( kpc, see Figure 2).
The one-armed spiral appears to be a generic outcome of a collision (low impact parameter encounter) between a low mass perturber and a barred galaxy (see Athanassoula 2, Pardy et al. 65, Berentzen et al. 15, Bekki 13, Besla et al. 17, Besla et al. 18). The exact location of the one-armed spiral feature is sensitive to the specific bar phase at the time of encounter, hence the details of the observed one-armed spiral might differ from the simulation result presented here. Our simulation of the NGC 4490/4485 provides further evidence that these types of dynamical encounters could explain the classical morphological signpost of Magellanic Irregulars (de Vaucouleurs & Freeman 29).
At the time of match, the extension of the primary has a surface density of M⊙ kpc-2. While the exact surface density is dependent on our mass model for the primary galaxy, this value is at least a factor of 100 higher than the surface density in the envelope surrounding the pair (see Figure 5, middle left), which can explain why we have not yet found a stellar envelope associated with the 50 kpc HI envelope. Additionally, the stellar disk scale length might be smaller than the HI disk scale length (Swaters et al. 81), which could also limit the amount of stars in the envelope.
V The fate of the envelope
Throughout the paper, we have focused on the dynamical match to the system and what happens up until the time of match. In this section we discuss the future evolution of the system and the fate of the extended baryonic envelope.
V.1 Energetic and Morphological Evolution of the Envelope
Based on the morphological evolution of the system seen in Figure 5 it is clear that the large scale structure of the system persists and continues to evolve long after the time of match ( Gyr) and long after coalescence of the two dwarf galaxies ( Gyr). But will all of the envelope be re-accreted or is some unbound? And how long will it take the bound portion to re-accrete? With a dynamical match to the system, we can begin to address these otherwise observationally challenging questions.

In Figure 9 we plot the 3D velocity, , of each secondary baryonic particle in the simulation (32768 particles) as a function of their total energy, , at the time of match. The color bar shows the 3D distance of each particle from the center of the secondary dwarf. The total energy is calculated as:
| (3) |
where is the magnitude of the center of mass velocity of the primary at the time of match and is the potential energy of each particle based on their location, stored as an output for each particle in each snapshot of the simulation. If the particles have a negative total energy they are bound to the center of mass of the combined system of the primary and the secondary galaxy.
The tidal features produced in the first two pericentric passages separate as two distinct kinematic features. The part of the tail produced in the first pericentric encounter ( Gyr, see Figure 2, left) is located farthest away ( kpc), while the tidal debris stripped in the more recent second pericentric passage ( Gyr, see Figure 2, left) has only reached kpc at the time of match.
At the time of match only 5.4% of the total baryonic mass of the secondary is unbound and is removed at either the first or second pericentric passage. From Figure 6 we know that 34% of the secondary particles reside beyond 7 disk scale radii at the time of match and that the rest of the material is within the main body at small distances (see dark purple points). If we only include the particles beyond 7 disk scale radii of the secondary (7 = 2.1 kpc) at the time of match in our calculation, 18.9% of those secondary particles are unbound.
Figure 9 shows that the tail from the first pericentric passage exhibits a velocity reversal (where part of the bound tidal tail has km s-1), indicating that some material in the tidal tail from the first pericentric passage is moving away from the galaxies while some material has reached its turnaround point (km s-1) and has started to fall back.
Motivated by this velocity reversal, we investigate the future evolution of the secondary’s debris beyond 7 disk scale radii at the time of match. In Figure 10, we show 4 “top-down” (RA vs los-distance) simulation snapshots tracking the future fate of the tidally stripped material at the time of match. The unbound particles (18.9%) are marked as “+” symbols.
In Figure 10, we do not explicitly track material tidally removed from within 7 disk scale lengths in future passages, as we are only tracking the present day envelope. We expect that the later tidal tails are generally much less extended and should re-accrete more rapidly. The blue arrow indicates our viewing direction towards the system at the time of match. The color bar denotes the 3D velocity (y-axis from Figure 9). We fix the maximum value of the color bar to km s-1 such that the color bar is not dominated by the high velocity particles within the secondary’s disk (see y-axis from Figure 9). This enables us to better illustrate the velocity gradient along the tail stripped at the first pass (some material is starting to fall back, white particles: km s-1). The black bars in Figure 10 indicate where for the tail produced in the first pericentric passage. All tidal material in the tail closer to the center of mass than this limiting distance (black bars) is falling back and returning to the primary.
Panel a) of Figure 10 represents the current state of the system (the time of match). At this point in time the secondary has undergone two pericentric passages, creating two kinematically distinct tidal tails (see Figure 9). In this projection of the simulation (“top-down”), the particles stripped in the second pericentric passage, are moving mostly in the negative (positive declination)-direction. Therefore, we do not plot the velocity reversal black bars for the tail produced in the secondary pass, however we do account for these particles in our mass budget of material moving away vs returning to the system.

Panel b) represents the system 1 Gyr into the future. The debris from the second pericentric passage tail is growing in length (to more negative -values in this projection) and some of the material starts to fall back towards the center of mass. The secondary has made a third passage (see Figure 2), generating more tidal debris (towards more negative RA values). Recall that we are only tracking debris which was already beyond 7 disk scale radii at the time of match (in principle more debris from within 7 disk scale radii will also be tidally moved in this third pass). At this point in time 68.1% of the bound present day envelope is returning to the merger remnant, 13% is moving away from the remnant (some of this might be unbound in the third pass) while 18.9% of the particles which were already unbound at the time of match are still moving away (gray “+” markers).
In Panel c) it is evident that the location of the velocity reversal (black bar) has moved even farther out along the first tidally produced tail (to more negative los-distance values). This is due to the fact that the particles along the tail lose kinetic energy as time passes and start falling back towards the center of mass (see percentages).
Panel d) represents the system 5 Gyr into the future and we have overlayed an 80 kpc sphere, which roughly represents the turnaround radius for debris that has returned from the tails and has started to orbit the center of mass of the merger remnant. This limiting radius of 80 kpc sphere was determined by investigating particle motion of the returned debris at Gyr. We seek to track the motion of particles across this radius to infer the rate at which the present day tidal debris will return to the system. In this work, we are investigating a collisionless -body simulation (i.e. without hydrodynamical effects), but we would not expect the gas in the remnant to extend beyond the collisionless particles (i.e. beyond 80 kpc), as the gas should dissipate energy likely resulting in a more compact configuration than we see here. See Section VI.3 for a discussion of hydrodynamical effects.
Interestingly, after 5 Gyr (panel d) much of the debris remains in the tails produced during the various pericentric passages, demonstrating that the large scale structure may persist for several Gyr after the dwarfs coalesce, and that the baryons can be “parked” at large distances for long timescales. Moving material to large distances in a galaxy encounter is not unique to dwarf galaxy interactions. However, as dwarfs typically have larger gas to stellar fractions than more massive galaxies, a substantial fraction of potential future fuel for star formation is likely “parked” at large distances for dwarf encounters. A comparative study of gas re-accretion post dwarf mergers and massive galaxy mergers has yet to be done. It is important to note that the timescales involved will be affected by our assumed galaxy mass model (see Section V.2). For a discussion on return of tidal material in a mass ratio galaxy merger, see Hibbard & Mihos [44].
V.2 Rate of return of the envelope

It is very difficult to assess the inflow rates of baryons to galaxies observationally and only few examples exist (e.g. Zheng et al. 96). However, when simulating a dynamical encounter, we can estimate the inflow rate of baryons to the merger remnant (see also Hibbard & Mihos 44). We use the 80 kpc radius radius sphere described in Section V.1 and shown in Figure 10 panel d, to track the future evolution of all material in the present day envelope. We define the envelope to be all material beyond 7 (2.1 kpc) at the time of match. We can thus track the inflow of material from the outer HI envelope in time.
In Figure 11 we track the tidal debris that is in the envelope at the time of match. In particular, we investigate fractionally how much of this material is residing within vs outside the 80 kpc sphere as a function of time (Figure 11, panel a). Here, we distinguish between the bound (solid line) and total (bound+unbound; dashed line) debris. As the unbound material will not return to the system, it will not affect the mass inflow to the system (or rate of return).
Up until 2 Gyr after the time of match, the 80 kpc sphere loses more mass than it gains, hence the bulk of the tidal material is still moving away from the system, which is consistent with the fact that the second pericentric tail is leaving the system during this time (see Figure 10). As time progresses more material from the outer envelope returns to reside within the 80 kpc sphere. After 2.5 Gyr we see a net inflow of the outer envelope to the 80 kpc sphere, hence more material is flowing into than out of the sphere. This implies that the material within this radius (i.e. the bulk of the envelope) will return to the merged system. The total bound mass in the simulated envelope shown in Figure 11, panel a, corresponds to M⊙ and after 5 Gyr % of the envelope has yet to be re-accreted.
This behavior is more clearly seen in Figure 11, panel b, where we plot the fractional rate of return of bound material within the 80 kpc sphere. The second pericentric passage causes a net outflow of material, but after 3 Gyr there is a net inflow. Scaling the fractional values using the total mass of the observed envelope implies a net inflow rate of 0.01 yr-1 at 80 kpc (see right y-axis).
We have utilized light dark matter halos in this study. Barnes [9] showed that the ratio of the escape velocity () from a galaxy and its circular disk velocity () at the half mass radius () can greatly affect the radii to which tidal material reach after tidal removal and its re-accretion rate. If is higher the galaxies reabsorb their tails faster. Using more massive halos, as expected from abundance matching, would result in the debris reaching smaller radii before velocity reversal and that the acceleration is higher as the debris falls back due to the deeper potential well. The results presented in this section should therefore be interpreted as lower limits on the inflow rate of the outer envelope. Given that the bulk of the envelope remains within 80 kpc of the system even in our low mass halo models, we conclude that the observed envelope will provide a long lived gas supply channel to the merged remnant.
VI Discussion
In this section we compare our results to previous simulations of the Magellanic System (Section VI.1), and we discuss the implications of our work in the context of tidal pre-processing and ongoing dwarf galaxy surveys (Section VI.2). Finally, we discuss baryon cycles in dwarf galaxies in the context of gas inflows and dissipational effects (Section VI.3).
VI.1 Comparison to the LMC & SMC system
Besla et al. [17] showed that the mutual interaction between the Magellanic Clouds (MCs) can reproduce both the large-scale gaseous distribution (bridge, leading and trailing arm) of the Magellanic System along with internal properties of the clouds, irrespective of tides from the Milky Way. Our match to the NGC 4490/4485 system is similar to the LMC/SMC models prior to their infall to the Milky Way (see Besla et al. 18) as both solutions suggest that a substantial amount of baryons are moved to large distances from the secondary galaxy (i.e. NGC 4485 and the SMC) in a prograde encounter.
Additionally, the NGC 4490/4485 system might provide clues to what the LMC/SMC would have evolved into if they had not been in the vicinity of the Milky Way (see Besla et al. 18). Because the LMC/SMC are passing close by the Milky Way, the SMC might be unbound from the LMC (González & Padilla 42), which has been suggested based on proper motion measurements of the clouds (Kallivayalil et al. 49, Vieira et al. 91 Kallivayalil et al. 50, Zivick et al. 97, Niederhofer et al. 64). In the Besla et al. [18] simulation (LMC/SMC evolving without the Milky Way), the Magellanic Clouds’ present day 3D separation is 26 kpc ( 6.3 Gyr in their figure 5), and the most recent orbit has a timescale of 800 Myr. For comparison the 3D separation between NGC 4490/4485 in our best match is only 9.3 kpc at present day and the orbital timescale of the last orbit is only 330 Myr (see Figure 2, left). This is similar to what the LMC/SMC orbit would yield after one more pericentric passage close to the next apocenter (Besla et al. 18, figure 5), suggesting that the NGC 4490/4485 pair is a more evolved version of the Magellanic Clouds, had they never fallen in to the Milky Way. Both our orbit and the Besla et al. [18] orbit have high eccentricities at the time of their best match ( and , respectively), but the two orbits are not exactly analogous. Our models thus expand the range of plausible orbital parameters for dwarf-dwarf binary galaxy encounters. Both the LMC/SMC and NGC 4490/4485 solutions predict that in isolation, both systems would rapidly merge without the intervention of a massive third body. Additionally, our work demonstrates that it is indeed possible to have a large extended gases envelope form through tides alone, providing new observational and theoretical support for the scenario presented for the LMC/SMC in Besla et al. [16], Besla et al. [17], Besla et al. [18].
A recent example of a dwarf pair that also mimics the LMC/SMC system was reported by Paudel & Sengupta [68]. The pair (UGC 4703/4703B) is very gas rich, shows signs of interaction (e.g. HI bridge, SF in bridge, extended gas) and the individual galaxies reside 81 and 104 kpc from their MW-type host, respectively. This pair provides an interesting example in addition to NGC 4490/4485 for understanding the effect of a mutual dwarf-dwarf tidal interaction, prior to infall to a massive host (i.e. pre-processing). In future work, we plan to assess the statistics of orbital configurations for dwarf encounters to advanced our understanding of the dwarf-dwarf merger sequence. See also Besla et al. [19] for a theoretical comparison between the frequency of dwarf-dwarf encounters in Illustris and SDSS at low redshift.
VI.2 Tidal pre-processing
The fact that baryons can remain extended for several Gyr after coalescence of interacting dwarf galaxies is important for understanding how tidal pre-processing between dwarfs can affect gas removal from low mass galaxies (quenching) after infall to more massive/gas rich environments. Ram-pressure and tides from a nearby massive galaxy seem to be inefficient at stripping gas that is tightly bound to the dwarfs (e.g. Emerick et al. 34, Fillingham et al. 37). If the gas is much more extended, removing it from the dwarfs through e.g. tides from a host galaxy or ram-pressure stripping by a hot halo of a host galaxy will be more efficient (e.g. Emerick et al. 34, Salem et al. 73) and extended gas structures caused by dwarf-dwarf interactions could help this process (Pearson et al. 70).
This picture appears consistent with the CDM theory as Wetzel et al. [95] have shown that 30-60% of dwarf satellites are expected to have been accreted as part of a low mass group. Furthermore, Marasco et al. [57] found that quenched dwarf satellites of MW type hosts at preferentially experienced a satellite-satellite encounter prior to accretion.
From the TiNy Titans Survey, we know that dwarf galaxy pairs are just as gas rich as non-paired dwarfs if they reside far from a massive host galaxy (Stierwalt et al. 79), but that much of this gas can be located in extended tidal features (Pearson et al. 70). The work presented in this paper demonstrates that in encounters where gas is moved to large radii, gas may remain extended for several Gyr. These long timescales indicate that we should expect to find gas in large extended structures surrounding the dwarfs when surveying dwarf galaxy pairs (e.g. Stierwalt et al. 79), dwarf groups (e.g. Stierwalt et al. 80) and dwarfs with merger driven starbursts (e.g. Lelli et al. 56). Interestingly, there is a pair of dwarf galaxies (NGC 4618 & NGC 4625: Pearson et al. 70) with stellar masses of and , respectively in the vicinity of NGC 4490/4485. NGC 4618/4625 pair has a velocity separation of only 55 5 From NED redshifts: ||. with respect to the NGC 4490/4485 pair, and they are at a projected separation of 267 kpc, assuming a distance of 7.14 Mpc (as for NGC 4490/4485). The NGC 4618/4625 pair is at a larger separation than reported for the seven newly discovered dwarf groups in Stierwalt et al. [80] (their projected separations are kpc), and it is unlikely the NGC 4618/4625 pair has had a dynamical influence on the NGC 4490/4485 pair due to the large projected separation. Besla et al. [19] shows that cosmologically it should be rare to find groups of dwarfs at low redshift (0.013 z 0.0252) with stellar masses of the members larger than , although they use a more conservative search criterion of kpc and .
The COS-Dwarfs Survey (Bordoloi et al. 20) find substantial amounts of ionized gas at large distances ( 110 kpc) surrounding 43 dwarf galaxies at low redshift () and they suggest a wind-driven origin of the gas. While it remains unclear whether the tidally removed gas in our dwarf-dwarf encounter will be and/or remain ionized as a result of the interaction (see Weilbacher et al. [93] for an example and discussion of ionized gas in a massive galaxy merger), our work presents another contributing factor to gas at large distances as we find baryons orbiting the dwarf merger remnant long after coalescence (see Figure 5 and 10).
VI.3 The Baryon Cycle and Unmodeled Hydrodynamic Effects
The current star formation rate of NGC 4490 inferred from the FUV non-ionizing continuum is SFRN4490(FUV) = 1.9 yr-1 (Lee et al. 54, scaled to a distance of 7.14 Mpc here). We showed that 90% of the gas envelope is within a sphere of 80 kpc after 5 Gyr and that the material beyond the 80 kpc sphere (the outer envelope) is flowing into the region at a roughly constant rate of M⊙ yr-1 after 3 Gyr, representing a lower bound on the inflow rate. We expect all of the bound material (within and beyond the 80 kpc sphere) to accrete back on to the merger remnant at some point, potentially refueling star formation. However, to quantify the exact properties of the accretion rate of material onto the merger remnant itself, we need hydrodynamical simulations.
In this work, we have narrowed down the parameter space of the tidal interaction between the two dwarf galaxies NGC 4490 and NGC 4485. Our work is based on collisionless -body simulations and we do not expect our global match to be much affected by dissipational effects as the large scale features (e.g. the symmetric HI envelope) and orbital decay are not strongly affected by the inclusion of gas (Barnes & Hernquist 10). However, to properly study the structure of the remnant and where the accreted gas goes, hydrodynamical effects will be important to include in future simulations.
Additionally, we need hydrodynamical simulations to investigate the HI bridge connecting NGC 4490/4485 (see Figure 1, left). Based on our collisionless particle simulation presented in Figure 3, we do not see evidence of a tidal bridge at the location of the dense bridge material (see red arrow in Figure 3), which indicates that this is a hydrodynamical feature. In our match, the orbit of the secondary passes through the dense gas bridge observed in HI during the first two pericentric passages in Figure 3, panel a and in the first pericentric passage in Figure 3, panel b, c. Hence a hydrodynamical origin of the bridge seems plausible as ram-pressure effects from a collision between two gaseous disks can increase the amount of gas lost to the bridge region (see the ”Taffy bridge” for an example of this effect: Condon et al. 26, Gao et al. 39).
VII Conclusion
In this paper, we have computed the first dynamical match to an observed isolated galaxy encounter at the low mass, dwarf scale using Identikit with -body follow-up. The system NGC 4490/4485 is an analog of the Magellanic System prior to its infall to the Milky Way, surrounded by a massive HI envelope but located in isolation from any massive galaxy. Our results and conclusions are summarized as follows:
- 1.
We are able to find a kinematic and morphological match to the gas distribution of the dwarf pair NGC 4490/4485 through solely the tidal forces from the primary (NGC 4490) stripping material from the secondary (NGC 4485). The match to the pair required a solution in which the secondary dwarf galaxy’s (NGC 4485’s) spin is prograde to the orbit and has a high inclination orbit with respect to the more massive dwarf (NGC 4490).
- 2.
In this match the 50 kpc (projected) envelope consists of a large tail from NGC 4485, lost during the first pericentric encounter between the two galaxies ( 1.4 Gyr ago). Due to our viewing perspective we see the tail as an envelope wrapping around the entire system. This demonstrates that through tidal interactions between two low mass galaxies, gas can be moved to large distances and produce a massive, symmetric, neutral HI envelope, without the need for stellar feedback (see Clemens et al. 24) or perturbations from a massive host.
- 3.
We predict that NGC 4490 & 4485 will fully merge in 370 Myr, but that the gaseous envelope will remain extended well after coalescence.
- 4.
During the encounter a one-armed spiral is induced in primary dwarf (NGC 4490) which is also seen in the new optical data of the system presented in this paper. This demonstrates that a high mass ratio, small impact parameter collision between two low mass galaxies can explain the classical morphological signpost of Magellanic Irregulars (de Vaucouleurs & Freeman 29).
- 5.
The fact that the extended tidal features evolve and persist for several Gyr after coalescence, supports the idea that dwarf-dwarf interactions play an important role aiding gas removal and quenching of low mass galaxies. Subsequent ram-pressure stripping and even weak tidal forces will be much more efficient to remove gas from such extended structures formed by pre-processing.
- 6.
We studied the current dynamical state of the HI envelope around the NGC 4490/4485 system and concluded that baryons are “parked” and eventually re-accreted by the merger remnant over long timescales ( 5 Gyr). The material in the extended tidal features will return to the system, crossing an 80 kpc radius at a rate of 0.01 yr-1 within 2.5 Gyr. The bulk of the HI envelope will be re-accreted to the merged remnant, providing a long-lived supply channel of gas. If dwarfs in the field with large gas reservoirs (e.g. Meurer et al. 61, Werk et al. 94, Kreckel et al. 52) have had a previous merger, the long accretion time can help explain the limited star formation in their gaseous outskirts.
- 7.
This work provides a novel isolated analog to simulations of the LMC/SMC. We illustrate that, generically, a significant fraction of the gas can be moved to large distances in prograde dwarf-dwarf interactions, without the aid of a massive host (see also Besla et al. 17, D’Onghia et al. 31). Additionally, we find that the NGC 4490/4485 orbit appears to be an evolved version of what the LMC/SMC might have looked like had they not been accreted by the Milky Way.
- •
Number of pericentric passes
A natural starting point when searching for a match is ensuring that the positions of the galaxies end up at the correct locations in morphology and velocity space. A natural next step is to explore how many pericentric passages are needed. The match presented in the paper occurs between the second and third pericentric pass close to apocenter. When exploring other matches, we found that any scenario in which only one pericentric passage had occurred did not provide a good match, as the tail from the first passage had not grown to be large enough to populate the envelope if the sizes of the galaxies (and separations) had to match the data. This was the case even in the most prograde scenario with substantial mass loss from the galaxies.When moving to a third pericentric pass, we could reproduce the overall morphology and kinematics of the encounter, often with a slightly larger length scaling (to fit the extent of NGC 4490 HI disk), however the tidal tail from the secondary galaxy produced in the first passage grew to be much too long and extended beyond the extent of the HI envelope in the wrong direction.
- •
Wider passes
We also explored the initial separation. A closer initial pass will lead to a more dramatic mass loss (depending on the disk angles). The match presented in this paper has an idealized pericentric separation at first pass of . We explored wider pericentric separations for the encounter, but we were not able to populate the south of the HI emission kinematically (see Figure 3, panel b). In the wider passes the angle of the tail produced in the first pass became too wide and did not populate the south of the envelope with the tail “wrapping around” from the first pass. We tested that moving to a later interaction stage and a different viewing angle did not resolve this problem.The widest pass we explored was a pass with an initial pericentric separation (). Between the third and fourth pass, we could get a match similar to the one presented in this paper. However, some debris from the first pass was present and predicted emission where none was observed. Hence, we did not obtain a better match by adding another pass.
- •
Populating north and south from the secondary and primary, respectively
We explored encounters in which the north of the envelope morphologically and kinematically was solely populated by debris coming off of the secondary galaxy in the second pericentric pass, and in which the south was populated by debris from the primary galaxy kinematically and morphologically. Given the known high stellar mass ratio between the two galaxies, we were not able to populate the HI envelope symmetrically morphologically (the south was unpopulated) nor populate the kinematic features with this approach. In particular the emission located where the white arrows point to in Figure 3 was left unpopulated. The observed baryonic mass ratio of the pair is , however it is possible that the dark matter halo mass ratio is lower (see Section IV.1.4). Going to more equal mass ratios would probably violate the observed stellar mass ratio. - •
Populating the “bridge region”
As discussed in Section VI.3, the orbit of the match presented in the paper passes through the dense bridge region in Figure 3, panel b) (see red arrow) in the first pericentric pass, and the orbit passes through the bright HI emission in the panel a) (see also Figure 1, left, inner HI contour) in both the first and second pass. The fact that the secondary’s orbit passes through the primary’s disk and through the bright HI emission associated with the bridge, provides a plausible scenario for forming a gas bridge due to ram-pressure effects (e.g. Besla et al. 17).As a bridge could be a transient phenomenon, we also explored matches for which the orbit passed through the bright HI emission of panel b) in Figure 3 (red arrow) in the second pass instead of the first. Using this constraint, we could find a match for which the overall properties were similar (scaling, separations, morphology) to our presented match. However, we could not reproduce the kinematics of the tail from the first pericentric pass in this scenario (see white arrows in Figure 3, panel b/c) and the southern part of the emission was not as populated (Figure 3, panel a) as the tail from the first pass did not wrap around the system which is the case in our presented match. Hence, we discarded this match in favor of the match presented in the paper.
While there is some room for changing the exact parameters of the encounter (see Section IV.1), the match presented in the paper was the most satisfactory in terms of populating the northern and southern parts of the HI data morphologically and kinematically, reproducing the present day positions (i.e. separation) of the galaxies morphologically and kinematically, matching the observed velocity scale of the data, and having an orbit that passes through the dense bridge material in Figure 3, panel a, b, c. Hence, we have presented a plausible scenario for the encounter geometry of the NGC 4490/85 system, yet further explorations of the eccentricity of the orbit, specific mass models of the galaxies and adding dissipational effects might change the specifics of the match. However, we do not expect the overall encounter geometry, which was common between all matches discussed above, to change (prograde orbit enabling substantial mass loss from the secondary galaxy and high inclination orbit such we see the tail in projection from our viewing direction).
References
- [1] Arp, H. 1966, ApJS, 14, 1
- [2] Athanassoula, E. 1996, in Astronomical Society of the Pacific Conference Series, Vol. 91, IAU Colloq. 157: Barred Galaxies, ed. R. Buta, D. A. Crocker, & B. G. Elmegreen, 309
- [3] Baillard, A., et al. 2011, A&A, 532, A74
- [4] Barnes, J., & Hut, P. 1986, Nature, 324, 446
- [5] Barnes, J. E. 1988, ApJ, 331, 699
- [6] Barnes, J. E. 2004, MNRAS, 350, 798
- [7] Barnes, J. E. 2011, ZENO: N-body and SPH Simulation Codes, Astrophysics Source Code Library
- [8] Barnes, J. E. 2012, MNRAS, 425, 1104
- [9] Barnes, J. E. 2016, MNRAS, 455, 1957
- [10] Barnes, J. E., & Hernquist, L. 1996, ApJ, 471, 115
- [11] Barnes, J. E., & Hibbard, J. E. 2009, AJ, 137, 3071
- [12] Bekki, K. 2008, MNRAS, 388, L10
- [13] Bekki, K. 2009, MNRAS, 393, L60
- [14] Bekki, K., & Chiba, M. 2005, MNRAS, 356, 680
- [15] Berentzen, I., Athanassoula, E., Heller, C. H., & Fricke, K. J. 2003, MNRAS, 341, 343
- [16] Besla, G., Kallivayalil, N., Hernquist, L., van der Marel, R. P., Cox, T. J., & Kereš, D. 2010, ApJ, 721, L97
- [17] Besla, G., Kallivayalil, N., Hernquist, L., van der Marel, R. P., Cox, T. J., & Kereš, D. 2012, MNRAS, 421, 2109
- [18] Besla, G., Martínez-Delgado, D., van der Marel, R. P., Beletsky, Y., Seibert, M., Schlafly, E. F., Grebel, E. K., & Neyer, F. 2016, ApJ, 825, 20
- [19] Besla, G., Patton, D. R., Stierwalt, S., Rodriguez-Gomez, V., Patel, E., Kallivayalil, N. J., Johnson, K. E., Pearson, S., Privon, G. C., & Putman, M. E. 2018, MNRAS, 480, 3
- [20] Bordoloi, R., et al. 2014, ApJ, 796, 136
- [21] Bradford, J. D., Geha, M. C., & Blanton, M. R. 2015, ApJ, 809, 146
- [22] Bussmann, R. S., et al. 2012, ApJ, 744, 150
- [23] Cioni, M.-R. L., van der Marel, R. P., Loup, C., & Habing, H. J. 2000, A&A, 359, 601
- [24] Clemens, M. S., Alexander, P., & Green, D. A. 1998, MNRAS, 297, 1015
- [25] Clemens, M. S., Alexander, P., & Green, D. A. 2000, MNRAS, 312, 236
- [26] Condon, J. J., Helou, G., Sanders, D. B., & Soifer, B. T. 1993, AJ, 105, 1730
- [27] Connors, T. W., Kawata, D., & Gibson, B. K. 2006, MNRAS, 371, 108
- [28] Cox, T. J., Jonsson, P., Somerville, R. S., Primack, J. R., & Dekel, A. 2008, MNRAS, 384, 386
- [29] de Vaucouleurs, G., & Freeman, K. C. 1972, Vistas in Astronomy, 14, 163
- [30] Diaz, J., & Bekki, K. 2011, MNRAS, 413, 2015
- [31] D’Onghia, E., Vogelsberger, M., Faucher-Giguere, C.-A., & Hernquist, L. 2010, ApJ, 725, 353
- [32] Dubinski, J., Mihos, J. C., & Hernquist, L. 1999, ApJ, 526, 607
- [33] Elmegreen, D. M., Chromey, F. R., Knowles, B. D., & Wittenmyer, R. A. 1998, AJ, 115, 1433
- [34] Emerick, A., Mac Low, M.-M., Grcevich, J., & Gatto, A. 2016, ApJ, 826, 148
- [35] Engel, H., et al. 2010, ApJ, 724, 233
- [36] Fakhouri, O., Ma, C.-P., & Boylan-Kolchin, M. 2010, MNRAS, 406, 2267
- [37] Fillingham, S. P., Cooper, M. C., Pace, A. B., Boylan-Kolchin, M., Bullock, J. S., Garrison-Kimmel, S., & Wheeler, C. 2016, MNRAS, 463, 1916
- [38] Freeman, K. C. 1970, ApJ, 160, 811
- [39] Gao, Y., Zhu, M., & Seaquist, E. R. 2003, AJ, 126, 2171
- [40] Gardiner, L. T., & Noguchi, M. 1996, MNRAS, 278, 191
- [41] Geha, M., Blanton, M. R., Yan, R., & Tinker, J. L. 2012, ApJ, 757, 85
- [42] González, R. E., & Padilla, N. D. 2016, ApJ, 829, 58
- [43] Guglielmo, M., Lewis, G. F., & Bland-Hawthorn, J. 2014, MNRAS, 444, 1759
- [44] Hibbard, J. E., & Mihos, J. C. 1995, AJ, 110, 140
- [45] Hibbard, J. E., & Yun, M. S. 1999, AJ, 118, 162
- [46] Huchtmeier, W. K., Seiradakis, J. H., & Materne, J. 1980, A&A, 91, 341
- [47] Hunter, J. D. 2007, Computing in Science and Engineering, 9, 90
- [48] Jiang, C. Y., Jing, Y. P., & Han, J. 2014, ApJ, 790, 7
- [49] Kallivayalil, N., van der Marel, R. P., & Alcock, C. 2006, ApJ, 652, 1213
- [50] Kallivayalil, N., van der Marel, R. P., Besla, G., Anderson, J., & Alcock, C. 2013, ApJ, 764, 161
- [51] Kim, J.-h., Wise, J. H., & Abel, T. 2009, ApJ, 694, L123
- [52] Kreckel, K., Peebles, P. J. E., van Gorkom, J. H., van de Weygaert, R., & van der Hulst, J. M. 2011, AJ, 141, 204
- [53] Lang, M., Holley-Bockelmann, K., & Sinha, M. 2014, ApJ, 790, L33
- [54] Lee, J. C., Kennicutt, Jr., R. C., Funes, S. J. J. G., Sakai, S., & Akiyama, S. 2009, ApJ, 692, 1305
- [55] Lelli, F., Verheijen, M., & Fraternali, F. 2014, A&A, 566, A71
- [56] Lelli, F., Verheijen, M., Fraternali, F., & Sancisi, R. 2012, A&A, 537, A72
- [57] Marasco, A., Crain, R. A., Schaye, J., Bahé, Y. M., van der Hulst, T., Theuns, T., & Bower, R. G. 2016, ArXiv e-prints
- [58] Martínez-Delgado, D., D’Onghia, E., Chonis, T. S., Beaton, R. L., Teuwen, K., GaBany, R. J., Grebel, E. K., & Morales, G. 2015, AJ, 150, 116
- [59] Martínez-Delgado, D., Pohlen, M., Gabany, R. J., Majewski, S. R., Peñarrubia, J., & Palma, C. 2009, ApJ, 692, 955
- [60] Martínez-Delgado, D., et al. 2010, AJ, 140, 962
- [61] Meurer, G. R., Carignan, C., Beaulieu, S. F., & Freeman, K. C. 1996, AJ, 111, 1551
- [62] Moster, B. P., Naab, T., & White, S. D. M. 2013, MNRAS, 428, 3121
- [63] Navarro, J. F., Frenk, C. S., & White, S. D. M. 1996, ApJ, 462, 563
- [64] Niederhofer, F., et al. 2018, ArXiv e-prints
- [65] Pardy, S. A., D’Onghia, E., Athanassoula, E., Wilcots, E. M., & Sheth, K. 2016, ApJ, 827, 149
- [66] Pardy, S. A., D’Onghia, E., & Fox, A. J. 2018, ArXiv e-prints
- [67] Patton, D. R., Torrey, P., Ellison, S. L., Mendel, J. T., & Scudder, J. M. 2013, MNRAS, 433, L59
- [68] Paudel, S., & Sengupta, C. 2017, ArXiv e-prints
- [69] Cox, T. J., Jonsson, P., Somerville, R. S., Primack, J. R., & Dekel, A. 2008, MNRAS, 384, 386
- [70] Pearson, S., et al. 2016, MNRAS, 459, 1827
- [71] Privon, G. C., Barnes, J. E., Evans, A. S., Hibbard, J. E., Yun, M. S., Mazzarella, J. M., Armus, L., & Surace, J. 2013, ApJ, 771, 120
- [72] Privon, G. C., et al. 2017, ApJ, 846, 74
- [73] Salem, M., Besla, G., Bryan, G., Putman, M., van der Marel, R. P., & Tonnesen, S. 2015, ApJ, 815, 77
- [74] Sanders, D. B., Soifer, B. T., Elias, J. H., Madore, B. F., Matthews, K., Neugebauer, G., & Scoville, N. Z. 1988, ApJ, 325, 74
- [75] Sengupta, C., Scott, T. C., Paudel, S., Saikia, D. J., Dwarakanath, K. S., & Sohn, B. W. 2015, A&A, 584, A114
- [76] Smith, B. J., Giroux, M. L., Struck, C., Hancock, M., & Hurlock, S. 2010, ArXiv e-prints
- [77] Springel, V., & White, S. D. M. 1999, MNRAS, 307, 162
- [78] Stanimirović, S., Staveley-Smith, L., & Jones, P. A. 2004, ApJ, 604, 176
- [79] Stierwalt, S., Besla, G., Patton, D., Johnson, K., Kallivayalil, N., Putman, M., Privon, G., & Ross, G. 2015, ApJ, 805, 2
- [80] Stierwalt, S., Liss, S. E., Johnson, K. E., Patton, D. R., Privon, G. C., Besla, G., Kallivayalil, N., & Putman, M. 2017, Nature Astronomy, 1, 0025
- [81] Swaters, R. A., van Albada, T. S., van der Hulst, J. M., & Sancisi, R. 2002, A&A, 390, 829
- [82] Theis, C., & Kohle, S. 2001, A&A, 370, 365
- [83] Theureau, G., Hanski, M. O., Coudreau, N., Hallet, N., & Martin, J.-M. 2007, A&A, 465, 71
- [84] Tolstoy, E., Hill, V., & Tosi, M. 2009, ARA&A, 47, 371
- [85] Toomre, A., & Toomre, J. 1972, ApJ, 178, 623
- [86] Tully, R. B., et al. 2006, AJ, 132, 729
- [87] van der Kruit, P. C., & Searle, L. 1981, A&A, 95, 105
- [88] van der Marel, R. P., Alves, D. R., Hardy, E., & Suntzeff, N. B. 2002, AJ, 124, 2639
- [89] van der Marel, R. P., & Kallivayalil, N. 2014, ApJ, 781, 121
- [90] Viallefond, F., Allen, R. J., & de Boer, J. A. 1980, A&A, 82, 207
- [91] Vieira, K., et al. 2010, AJ, 140, 1934
- [92] Walt, S. v. d., Colbert, S. C., & Varoquaux, G. 2011, Computing in Science and Engg., 13, 22
- [93] Weilbacher, P. M., et al. 2017, ArXiv e-prints
- [94] Werk, J. K., Putman, M. E., Meurer, G. R., Thilker, D. A., Allen, R. J., Bland-Hawthorn, J., Kravtsov, A., & Freeman, K. 2010, ApJ, 715, 656
- [95] Wetzel, A. R., Deason, A. J., & Garrison-Kimmel, S. 2015, ApJ, 807, 49
- [96] Zheng, Y., Peek, J. E. G., Werk, J. K., & Putman, M. E. 2017, ApJ, 834, 179
- [97] Zivick, P., et al. 2018, ArXiv e-prints