A Framework for Detecting and Translating User Behavior from Smart Meter Data
Abstract
The European adoption of smart electricity meters triggers the developments of new value-added service for smart energy and optimal consumption. Recently, several algorithms and tools have been built to analyze smart meter’s data. This paper introduces an open framework and prototypes for detecting and presenting user behavior from its smart meter power consumption data. The framework aims at presenting the detected user behavior in natural language reports. In order to validate the proposed framework, an experiment has been performed and the results have been presented.
Index Terms:
Nonintrusive Appliance Load Monitoring; Machine-Learning; Smart Meters; UML.I Introduction
In a recent report, i.e., “Benchmarking smart metering deployment in the EU-27 with a focus on electricity”, the Commission has accelerated smart meter deployment in European households. A roll-out target of 80% market penetration of smart electricity meters by 2020 has been required by Member States given that a long-term cost-benefit analysis proves to be positive. Besides being essential for electricity billing, smart meters have been used as a vehicle for delivering value-added services such as providing DSO with diagnostic information about the distribution grid [1] or by permitting third-party application providers to deliver grid-related information services to residential homes [2]. Furthermore, the higher temporal resolution of consumption data, offered by smart meters, allows physical events resulting from user behavior to be detected and analyzed by using a NALM (NALM) system [3].
This paper rests on recent advancements in NALM based on smart meter data readings with high temporal resolution. A conceptual framework (shown in Figure 1) for detecting user behavior from the electricity usage fingerprints, resulting from activities in the residential home, is proposed. The key novelty of the research comes from a combination of simple ML (ML) techniques for event recognition with a subsequent analysis and translation of information into natural language. After an initial training period, the responses to the actual user behavior can be delivered in near real-time. The immediate benefit of the proposed framework stems from the fact that an observer no longer needs to be a skilled technician but instead can rely on comprehensible reports on user behavior.
A domain where the framework can be applied is elderly care, where a report in natural language will enable caretakers to take the role of the observer. By cutting away transportation overhead, this has the potential to allow caretakers to spend more time paying attention to indicators of discomfort or worse.

The paper is structured as follows; Section II gives a brief overview of the related work. Section III shows the techniques and modeling languages used in this work. Section IV presents the proposed framework and Section V demonstrates the applicability of the framework via a test case. Section VI draws the conclusion and outlines future work.
II State of the Art
While frameworks for NALM by smart meter power consumption data forms a relatively new research field, diverse algorithms and tools have been presented to implement these frameworks. In [3], authors present an infrastructure and a specialized algorithm that provide users with real-time feedback on their electricity consumption. They achieve accuracy in detecting ON/OFF switching events. In [4], Ruzzelli et al. present a smart system for recognition of electrical appliance activities in real-time. Their system provides accuracy in determining the set of appliances being used.
In the same context, the work reported in [5] defines a service-oriented architecture for the collection of electricity data from resource constrained devices in residential homes. In the same work, the REST (REST) principle is applied when designing the application layer protocols and a database cloud service, providing storage for other elements in the architecture.
Besides the simplicity stemming from only using smart meter data, research has also focused on the use of data with low time resolution. The works of [4] and [6] both rely on data collected at Hz, where the latter achieve a precision of in detecting switching events.
Regarding the representation of the analyzed smart meter data results; generation of natural language from software models is considered as a key target in this point. Burden et al. in [7], investigate the possibilities to generate natural language text from UML (UML) diagrams. They use a static diagram (i.e., class diagram) transformed into an intermediate linguistic model to demonstrate their approach. They show that the generated texts are grammatically correct. In this work, we have followed the same approach to generate natural language reports from high-level models.
III Background
This section gives a brief overview of appliances detecting algorithms, natural language,’ and interfaces that are used to exchange data between the framework elements.
III-A Load Disaggregation Algorithm
Defined as an algorithm that takes data on aggregated electricity loads from multiple appliances, as input, and outputs disaggregated loads for individual appliances [8]. Combined with a non-intrusive approach to obtain the data, it forms a method for NALM. Assuming that labels with information about appliance load is available for some of the load data, the problem of disaggregation is similar to a supervised learning problem known from ML or a problem of statistical regression [8]. Another problem, related to load disaggregation is that of detecting event states, typically “ON” or “OFF”.
III-B Model-to-Text
An Eclipse project is concerned with the generation of textual artifacts from high-level models. OMG (OMG) specifies a correlated language named MTL (MTL) to express its transformation. Acceleo [9], an Eclipse plugin tool, is a pragmatic implementation of the MTL standard. It is widely used by software engineers to generate code from high-level models.
III-C Interfaces
REST is a design style for designing application based on web services, calling for simple (client-server, stateless, self-documenting) interfaces building on HTTP (HTTP). The openness, modularity, interoperability, and security provided by REST are beneficial when designing interfaces for an open framework such as the proposed. The IP (IP) suite is a key building block for cloud services, due to its widespread use. As discussed in [5], the larger address range of IPv6 (IPv6) is necessary to assign each device an address and thereby observe the End-to-End principle.
ZigBee is implemented on the top of IEEE 802.15.4 standard and widely used in home automation applications, offering low transmission rates over a low-power wireless radio links.
IV Proposed Framework
In this section, the context of the framework is outlined and elements of the framework are defined.
The context is that of a user living in his/her home. In the home, some electrical appliances are installed and when a user makes use of an appliance it is referred to as a usage. The framework interfaces with user consumption data through a smart meter by receiving data on electrical power consumption. The framework is then responsible for establishing the user’s usages of appliances and outputs the result as natural language report. An observer will receive this natural language and thereby obtain information about the user behavior without having to be physically present.

The framework is outlined in Figure 2 with its five components; numerical labels are used to denote the data flow directions. A smart meter will be responsible for collecting consumption data of the home. By using ZigBee communication data will be transferred to a DataBase Cloud Service (label 1) and a gateway has to be deployed in the home as discussed in [5]. The DataBase Cloud Service provides a data storage for the resource-constrained smart meters. With RESTful web interface the service has potential for great scalability, like many other cloud services, while still offering constrained devices a simple interface. Besides providing a way to how to store potentially data, which is not discussed in other work on NALM, this framework describes a component which can be expected to scale well and has the benefits of consolidating storage. To make use of the collected data, it is proposed to deploy a LDA (LDA) [10] (label 2) as a cloud service. The LDA service takes measurement data from the DataBase Cloud Service as input and disaggregates the aggregated electricity consumption to produces data on appliance usage. Multiple implementations of LDAs exist as discussed in Section II and one of the key features of this framework is the capability to use various algorithms without rebuilding other components [2]. This is a benefit in both evaluation and deployment as it simplifies comparison and replacement of the LDA. As a novel idea in this context, NLP (NLP) is applied to present information derived from electricity usage data to the receiver as natural language (label 3). Depending on the specific requirements this can be audio or text (label 4). An important feature is that the NLP components can be replaced without affecting other components in the framework. Figure 3 shows a part of a developed UML class diagram of the framework architecture. The class diagram depicts the main used classes with their attributes and relationships with each other. In this way, objects of those classes can easily be instantiated and information related to each object can be tagged. Afterward, such objects will be transformed into a natural language as it explained in details in [7].

V Experimental results
This section demonstrates the applicability of the proposed framework via a test case.
V-A Electricity Traces of Appliances
In place of a real smart meter and the data to be obtained from it, this work in its current state relies on the Tracebase dataset provided by [11]. The dataset contains 1836 traces of 24-hours duration, from 159 different appliances of 43 types, with average power consumption, sampled at 1 Hz. For collecting, the authors of [11] used the smart plug product named Circle, by PlugWise [12]. While providing precise per-appliance measurements, the Circle is an intrusive device, that must be installed between power outlets and appliance power plugs.
To simulate a smart meter, two days of data from six appliances are considered — one for test and one for training. The test and training sets are constructed by summing across appliances for each time of day, resulting in two virtual days of smart meter measurements. Any correlation information between appliances, such as the PC-Desktop and Monitor-TFT tending to be ON at the same time, is lost in the described process. Loss of information is expected to make the task of the LDA harder, leading to a worse performance in the evaluation and thereby erring on the side of caution. The labeling with a usage of appliances is done manually by visually inspecting the dataset, introducing a source of error. Both errors are to be eliminated in future work by using a smart meter to measure multiple devices and by recording the true appliance usage.
V-B Storage Service
Without a deployed smart meter, there is no need for a storage service and it is not yet implemented directly in this project. However, in related research efforts, the authors have obtained experience with the development and implementation of the DBA (DBA) service of [5], and plan to use it in the near future.
V-C Load Disaggregation Algorithm
To verify that the LDA component is feasible, two prototypes have been implemented using two different supervised ML techniques, namely SVM (SVM) and Random Forest [8]. For each LDA, a classifier for a home is built on the training data, obtained as discussed in Section V-A. To evaluate, the classifier is applied to the test dataset, resulting in predictions of which appliances are in use at each time interval. Usage patterns are obtained by sliding a time window and by observing changes in which appliances are in use. A change to ON signifies the starting time of a usage and the next change to OFF for the device signifies the stopping time of the same usage.
SVM results in an overall accuracy of 94.0% and F1-score of 77.3% with worst per appliance F1-score being 38.4%. Random Forrest, on the other, hand provides an overall accuracy of 94.3% and F1-score of 78.3%, with worst per appliance F1-score of 39.2%. The difference in performance between the two methods is too small to ascribe any significance. Therefore, the results for the worst performing SVM is considered in the following.
Table I shows that the LDA is good at determining when appliances are OFF, as the TNR (TNR) is high. It is also good at determining when appliances are ON, except for the Lamp and the TV-LCD, which shows a low TPR (TPR) and thereby a low F1-score. The counts of TP (TP), FP (FP), TN (TN) and FN (FN) are available in Table II.
| Prec. | Acc. | TPR | TNR | F1 | |
|---|---|---|---|---|---|
| TV-CRT | 0.998 | 0.976 | 0.855 | 1.000 | 0.921 |
| PC-Desktop | 0.820 | 0.934 | 0.975 | 0.919 | 0.890 |
| Cooking-stove | 0.932 | 0.997 | 0.997 | 0.997 | 0.964 |
| Lamp | 0.621 | 0.887 | 0.288 | 0.974 | 0.394 |
| Monitor-TFT | 0.613 | 0.930 | 0.988 | 0.923 | 0.757 |
| TV-LCD | 0.571 | 0.934 | 0.402 | 0.976 | 0.471 |
| Overall | 0.780 | 0.943 | 0.787 | 0.967 | 0.783 |
- •
Prec.: .
- •
Acc.: .
- •
TPR.: .
- •
TNR: .
- •
F1: .
| TP | FP | TN | FN | |
|---|---|---|---|---|
| TV-CRT | 12048 | 21 | 72280 | 2049 |
| PC-Desktop | 23159 | 5099 | 57538 | 602 |
| Cooking-stove | 3107 | 226 | 83057 | 8 |
| Lamp | 3177 | 1935 | 73428 | 7858 |
| Monitor-TFT | 9336 | 5890 | 71056 | 116 |
| TV-LCD | 2541 | 1912 | 78159 | 3786 |
| Overall | 53368 | 15083 | 435518 | 14419 |
- •
TP: True Positives.
- •
FP: False Positives.
- •
TN: True Negatives.
- •
FN: False Negative.
V-D NLP
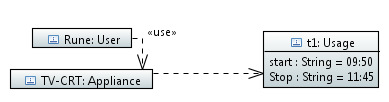
Figure 4 shows a part of the generated object diagram of the previously explained class diagram (Figure 3). The diagram is automatically built from the output of the LDA, by mapping it directly into class instances. A Python module outputting XML conforming to the format used by Eclipse MTL has been implemented specifically for this purpose. The tool generates .uml files which are visualized using Papyrus UML editor tool as shown in Figure 4.
V-E Model-to-Text
The last step in the synthesis, is to transform UML object diagram into a natural language. This step has been done by developing an Acceleo model-to-text generator to parse and convert the model into a natural language. A part of the generator is shown in Figure 5.
The automatically generated natural language report from the parsed UML object diagram (Figure 4) is:
Rune was using the TV-CRT from 09:50 to 11:45.
VI Conclusion and Future work
A framework for deducing user behavior from smart meter data has been presented. Tool-chain structure and prototypes have been described and evaluated for the key components, specifically the LDA, the Modeling and the NLP. The prototypes have been developed to validate the feasibility of the framework.
Future work includes modeling of the entire framework in details, formalizing interfaces between components and validating them. In particular, the issue of multiple users is a topic that has not been discussed in related work. Smart meters will be introduced and utilized for acquisition of real and complex electricity consumption data. The database cloud service will need to be implemented to support data acquisition, and potentials for sharing data or appliance profiles can be investigated. LDA performance might be improved through the use of other algorithms or by tuning parameters. Establishing the statistical significance will be an important part of the evaluation.
Acknowledgment
The research leading to these results has received funding from the European Union Seventh Framework Programme (FP7/2007-2013) under grant agreements no. 317761 (SmartHG) and no. 619560 (SEMIAH).
References
- [1] S. S. S. R. Depuru, L. Wang, and V. Devabhaktuni, “Smart meters for power grid: Challenges, issues, advantages and status,” Renewable and Sustainable Energy Reviews, vol. 15, no. 6, pp. 2736 – 2742, 2011.
- [2] R. Jacobsen, N. Tørring, B. Danielsen, M. Hansen, and E. Pedersen, “Towards an app platform for data concentrators,” in Innovative Smart Grid Technologies Conference (ISGT), 2014 IEEE PES, Feb 2014, pp. 1–5.
- [3] M. Weiss, A. Helfenstein, F. Mattern, and T. Staake, “Leveraging Smart Meter Data to Recognize Home Appliances,” IEEE International Conference on Pervasive Computing and Communications.
- [4] A. G. Ruzzelli, C. Nicolas, a. Schoofs, and G. M. P. O’Hare, “Real-Time Recognition and Profiling of Appliances through a Single Electricity Sensor,” 7th Annual IEEE Communications Society Conference on Sensor, Mesh and Ad Hoc Communications and Networks (SECON), pp. 1–9, 2010.
- [5] R. Jacobsen and S. Mikkelsen, “Infrastructure for Intelligent Automation Services in the Smart Grid,” Wireless Personal Communications, vol. 76, no. 2, pp. 125–147, 2014.
- [6] J. Liao, G. Elafoudi, L. Stankovic, and V. Stankovic, “Non-intrusive appliance load monitoring using low-resolution smart meter data,” in 2014 IEEE International Conference on Smart Grid Communications (SmartGridComm), pp. 535–540.
- [7] H. Burden and R. Heldal, “Natural Language Generation from Class Diagrams,” in Proceedings of the 8th International Workshop on Model-Driven Engineering, Verification and Validation, ser. MoDeVVa. ACM, 2011.
- [8] I. H. Witten and E. Frank, Data Mining: Practical machine learning tools and techniques. Morgan Kaufmann, 2005.
- [9] Object Management Group, “Acceleo,” http://www.eclipse.org/acceleo/, 2015.
- [10] M. Marceau and R. Zmeureanu, “Nonintrusive load disaggregation computer program to estimate the energy consumption of major end uses in residential buildings,” Energy Conversion and Management, vol. 41, no. 13, pp. 1389 – 1403, 2000.
- [11] A. Reinhardt, P. Baumann, D. Burgstahler, M. Hollick, H. Chonov, M. Werner, and R. Steinmetz, “On the Accuracy of Appliance Identification Based on Distributed Load Metering Data,” pp. 1–9, 2012.
- [12] PlugWise BV, NL, “Plugwise circle,” Online: https://www.plugwise.com/circle, 2015.