The gravitational mass of Proxima Centauri measured with SPHERE from a microlensing event.
Abstract
Proxima Centauri, our closest stellar neighbour, is a low-mass M5 dwarf orbiting in a triple system. An Earth-mass planet with an 11 day period has been discovered around this star. The star’s mass has been estimated only indirectly using a mass-luminosity relation, meaning that large uncertainties affect our knowledge of its properties. To refine the mass estimate, an independent method has been proposed: gravitational microlensing. By taking advantage of the close passage of Proxima Cen in front of two background stars, it is possible to measure the astrometric shift caused by the microlensing effect due to these close encounters and estimate the gravitational mass of the lens (Proxima Cen). Microlensing events occurred in 2014 and 2016 with impact parameters, the closest approach of Proxima Cen to the background star, of 16 01 and 05 01, respectively. Accurate measurements of the positions of the background stars during the last two years have been obtained with HST/WFC3, and with VLT/SPHERE from the ground. The SPHERE campaign started on March 2015, and continued for more than two years, covering 9 epochs. The parameters of Proxima Centauri’s motion on the sky, along with the pixel scale, true North, and centering of the instrument detector were readjusted for each epoch using the background stars visible in the IRDIS field of view. The experiment has been successful and the astrometric shift caused by the microlensing effect has been measured for the second event in 2016. We used this measurement to derive a mass of 0.150 (an error of 40%) M⊙ for Proxima Centauri acting as a lens. This is the first and the only currently possible measurement of the gravitational mass of Proxima Centauri.
Keywords:
Instrumentation: high contrast imaging, Methods: data analysis, Techniques: coronagraphy, high contrast, Stars: Proxima Cen, Gravitational lensing: micro1 Introduction
Proxima Centauri is the closest star to our Sun (Lurie et al. 2014, distance=1.3 pc;). It is part of a triple system together with Cen A and B (Kervella et al. 2017). Proxima is a low-mass M5Ve, flaring dwarf star. It has very fast proper motion of -3775.75 mas/yr in right ascension and 765.54 mas/yr in declination (van Leeuwen 2007). Kervella et al. (2017) recently demonstrated that Proxima is bound to Cen AB with a high degree of confidence. A mass of M⊙ has been estimated using a mass-luminosity relation (Mann et al. 2015, e.g.,). Due to this method, this value suffers from significant uncertainties. Especially for young systems, the masses estimated from astrometric binaries can be underestimated by some tens of percent (L. Rodet, private communication). The scatter on the measurements of astrometric and eclipsing binaries, which provide the error bars for the mass-luminosity derived mass, are higher for low-mass stars.
Recently, a telluric planet with a minimum mass 1.3 M⊕ and an orbital period of 11.2 days, Proxima b, has been found in the habitable zone of Proxima Cen using the radial velocity method (Anglada-Escudé et al. 2016). Moreover, Anglada et al. (2017) presented the discovery of warm dusts belts around the star. These discoveries brought even more interest to this star, and the need to determine its mass with higher accuracy.
Very recently, Sahu et al. (2017) for the first time astrometrically measured the gravitational deflection of starlight during a microlensing event to derive the mass of a star different from our Sun, the white dwarf Stein 2051 B. The fine measurement of the deflection using the Wide Field Camera 3 (WFC3) on the Hubble Space Telescope (HST), permitted a mass estimate of 0.675 0.051 ( 7.5%) M⊙.
Sahu et al. (2014) predicted two microlensing events due to the close passage of Proxima Cen in front of two background stars, which they began monitoring using HST. Based on their first HST observations, they made precise predictions of the close encounters. The first passage would occur in 2014, when Proxima passed very close to a magV=20 background star (Source 1). The second microlensing event was predicted for the year 2016, due to close passage of another background star of magV = 19.5, called by the authors Source 2. The closest approach by Proxima was expected to occur in February 2016, with an impact parameter of 05 01. The expected astrometric shift of the centroid of Source 2 on the sky due to the microlensing effect had a maximum value of 1.5 mas. Such an event was highlighted as a unique opportunity to estimate the mass of Proxima Cen. The full results of the HST program (PI: K. Sahu) will be presented in Sahu et al., in prep.
In this paper we present the astrometric monitoring of Proxima Cen and its close passage to Source 2 with the Spectro-Polarimetric High-contrast Exoplanet REsearch (Beuzit et al. 2008, SPHERE;) instrument at the Very Large Telescope. SPHERE is a powerful high contrast instrument developed for the research of exoplanets and circumstellar discs. Its performance for high precision astrometry and photometry of companions was demonstrated during commissioning (Vigan et al. 2016; Maire et al. 2016a; Zurlo et al. 2016; Bonnefoy et al. 2016, see, e.g.,). SPHERE is composed of a common path and three scientific instruments: IRDIS (Dohlen et al. 2008), a dual band imager, IFS (Claudi et al. 2008), an Integral Field Spectrograph, and ZIMPOL (Thalmann et al. 2008), a visible light polarimeter. SPHERE’s powerful adaptive optics system (Fusco et al. 2006, i.e.,), and the relatively large field of view (FoV) of IRDIS for an eXtreme Adaptive Optics (xAO) fed instrument, allowed precise astrometric observations of the faint Proxima Cen from the ground. For the analysis presented in this paper, we used the near infrared arm of SPHERE to observe Proxima Centauri and the background stars using SPHERE from March 2015 to June 2017. This paper is structured as follows: in Sec. 2 we present the observations and data reduction. In Sec. 3 we discuss the astrometric analysis, Sec. 4 presents the discussion and conclusions are given in Sec. 5.
2 Observations and data reduction
The observations of Proxima Centauri were carried out during the Guaranteed Time Observations (GTO) of SPHERE. We acquired 9 epochs spanning over 2 years. They are listed in Table 1. Most of these datasets (except the last two) were reduced and analysed by Mesa et al. (2017), where constraints on the mass of possible giant companions of Proxima b are presented. Nevertheless, we present here all of the observations for the sake of completeness. SPHERE was set in its IRDIFS mode, with the dual band imager IRDIS using the H2H3 dual-band filters (Vigan et al. 2010, H2=1.587 m and H3=1.667 m, dual band imaging (DBI) mode;) and the integral field spectrograph IFS covering the YJ band (Zurlo et al. 2014, 0.95–1.35 m; R=50;). Each dataset except the first one had a total exposure time of 1h, which allowed us to obtain deep high-contrast images of the region around Proxima Centauri within the IRDIS and IFS fields of view (FoVs). The size of the IRDIS FoV is 11′′ 11′′ while IFS has a smaller FoV of 1.7′′ 1.7′′.
Initial IRDIS data processing was performed using the official pipeline of the consortium at the Data Center/IPAG in Grenoble (Delorme et al. 2017). IRDIS data, after the application of the appropriate calibrations (dark, flat and centering), were reduced with the ad hoc IDL routines presented in Zurlo et al. (2014); Zurlo et al. (2016). The procedures apply the KLIP (Soummer et al. 2012) principal component analysis (PCA) to attenuate the speckle noise and apply the angular differential imaging (Marois et al. 2006, ADI;) technique to the IRDIS frames. For this particular analysis, we also produced median combined, derotated images cleaned with a spatial filter. We first created a datacube which contained the frames of the observation derotated according to their position angles. A median filter that removes isolated high or low values was then applied and a median-collapsed image of the cube was produced.
Following this approach, background stars are clearly visible inside the SPHERE adaptive optics outer working angle (OWA) and they do not suffer from elongation due to ADI self subtraction. The final image for one of the epochs is shown in Figure 1. This median-combined method allowed an improvement on the determination of the astrometric positions of the stars outside the speckle pattern noise region very close to Proxima Cen. IFS data were reduced applying the algorithms presented in Mesa et al. (2015). We first applied the appropriate calibrations (dark, flat, spectral positions, wavelength calibration and instrument flat) using the standard DRH data reduction (Pavlov et al. 2008). The resulting datacubes were each comprised of 39 monochromatic frames. We then applied a custom PCA procedure to these datacubes. The reduced IFS image for the same epoch as shown for IRDIS in Figure 1 is presented in Figure 2. The contrast reached for each observation is listed in Table 2 of Mesa et al. (2017).


| Date | nDIT;DIT(s) IRDIS | nDIT;DIT(s) IFS | Rot.Ang. (∘) | DIMM Seeing (′′) | Stars Identified |
|---|---|---|---|---|---|
| 2015-03-30 | 312;16 | 312;16 | 3.12 | 0.93 | 23 |
| 2016-01-18 | 740;16 | 720;32 | 25.74 | 2.20 | 27 |
| 2016-02-17 | 1110;16 | 115;32 | 13.52 | 1.86 | 32 |
| 2016-02-29 | 710;16 | 715;32 | 22.56 | 0.78 | 40 |
| 2016-03-27 | 540;16 | 525;32 | 25.69 | 2.08 | 44 |
| 2016-04-15 | 640;16 | 620;32 | 28.72 | 0.62 | 50 |
| 2016-07-20 | 540;16 | 520;32 | 21.14 | 0.40 | 38 |
| 2017-03-20 | 162;64 | 162;64 | 11.50 | 0.57 | 35 |
| 2017-06-15 | 540;16 | 520;32 | 21.26 | 1.69 | 35 |
3 IRDIFS astrometry
3.1 Measurement of the stellar positions
The total number of stars identified in in the IRDIS FoV in each epoch are listed in Table 1. To measure the position of each star, we employed three different IDL routines: mpfit2dpeak (Markwardt 2009), cntrd, and find. For each star detected in the FoV, we identified which final image, the median combined image or the KLIP-ADI image, had a higher signal-to-noise ratio (S/N) and more symmetric point spread function (PSF) shape. For stars farther than 08 from the central star we found in general that the median combined image was better because of the round shape of the PSFs. If the measurements of the three routines were consistent, the mean of the results was adopted, otherwise we excluded the routine(s) that did not converge. In most cases, all three routines gave consistent results.
On the IFS final images we measured stellar positions by inserting negative-scaled PSF images (Lagrange et al. 2010; Zurlo et al. 2014, “fake negative planet” technique;) into the final image and shifting the simulated star position until the standard deviation was minimized in a small region around the PSF itself (0.8 /D). The median of the positions obtained when varying the number of principal components was assumed as the position of the object. Source 2 was detected with IFS for the epochs 2016-01-18, 2016-02-17, and 2016-02-29. For the epoch 2016-03-27 the star is partially visible on the edge of the IFS FoV. We did not consider this measurement in our analyses.
The movement of Proxima Cen across the sky with respect to the other stars identified in the images for all epochs is presented in Figure 3. The relative displacement of Source 2 with respect to Proxima Cen as it is seen in the IRDIS detector for all epochs is shown in Figure 4. Source 2 was detected in all epochs. However, in the last observation (June 2017) it falls on the edge of the detector and is partially visible.
3.2 Accurate determination of the detector parameters and the movement Proxima of Cen
After measuring the position of each star on the detector FoV for each epoch we ran a Markov Chain Monte Carlo (MCMC) to refine the detector parameters (position of the center, i.e. Proxima position, the value of the plate scale, and True North (TN)) for each epoch and the movement of Proxima on the sky. For these parameters the initial guesses of the MCMC were the standard IRDIS astrometric calibrations (Maire et al. 2016b, see) and the Hipparcos values for Proxima Cen’s RA2000, DEC2000, , , . We estimated four detector parameters for each epoch ( and coordinates of the center, plate scale and TN) and five parameters for the movement of Proxima (RA2000, DEC2000, , , ) with this fit. This leads to 49 + 5 = 41 parameters in total.
The positions of the background stars on the sky were calculated using the nominal values for Proxima Cen’s movement and the detector parameters, assuming that Proxima was at the center of the detector. The position of Proxima was converted into sky coordinates using the Python routine novas (Barron et al. 2011), which allows the sky coordinates of a star at a given epoch to be determined with an accuracy better than 1 mas. The stellar sky coordinates we adopted were the median of the RA and DEC derived for each epoch where the star was detected. We assumed that the proper motion and the parallax of these stars were negligible, using them as a fixed grid to readjust the detector parameters and Proxima Cen’s movement. An attempt to include these parameters in the MCMC was made, but the fit did not converge. Note that since we assumed that the parallaxes of the background stars are negligible, the parallax found for Proxima is relative to the mean parallax of the background stars. To perform the MCMC analysis, we used the public Python code emcee (Foreman-Mackey et al. 2013). We ran 130,000 steps, with 150 initial walkers. The result of the MCMC analysis for the plate scale and TN of each epoch as listed in Table 2.
| Epoch | Pixel scale (mas/px) | TN (deg) |
|---|---|---|
| 2015-03-30 | 12.242 | -0.152 |
| 2016-01-18 | 12.243 | 0.094 |
| 2016-02-17 | 12.248 | 0.195 |
| 2016-02-29 | 12.247 | -0.143 |
| 2016-03-27 | 12.246 | -0.418 |
| 2016-04-15 | 12.243 | 0.066 |
| 2016-07-20 | 12.244 | 0.003 |
| 2017-03-21 | 12.246 | 0.147 |
| 2017-06-15 | 12.240 | 0.492 |
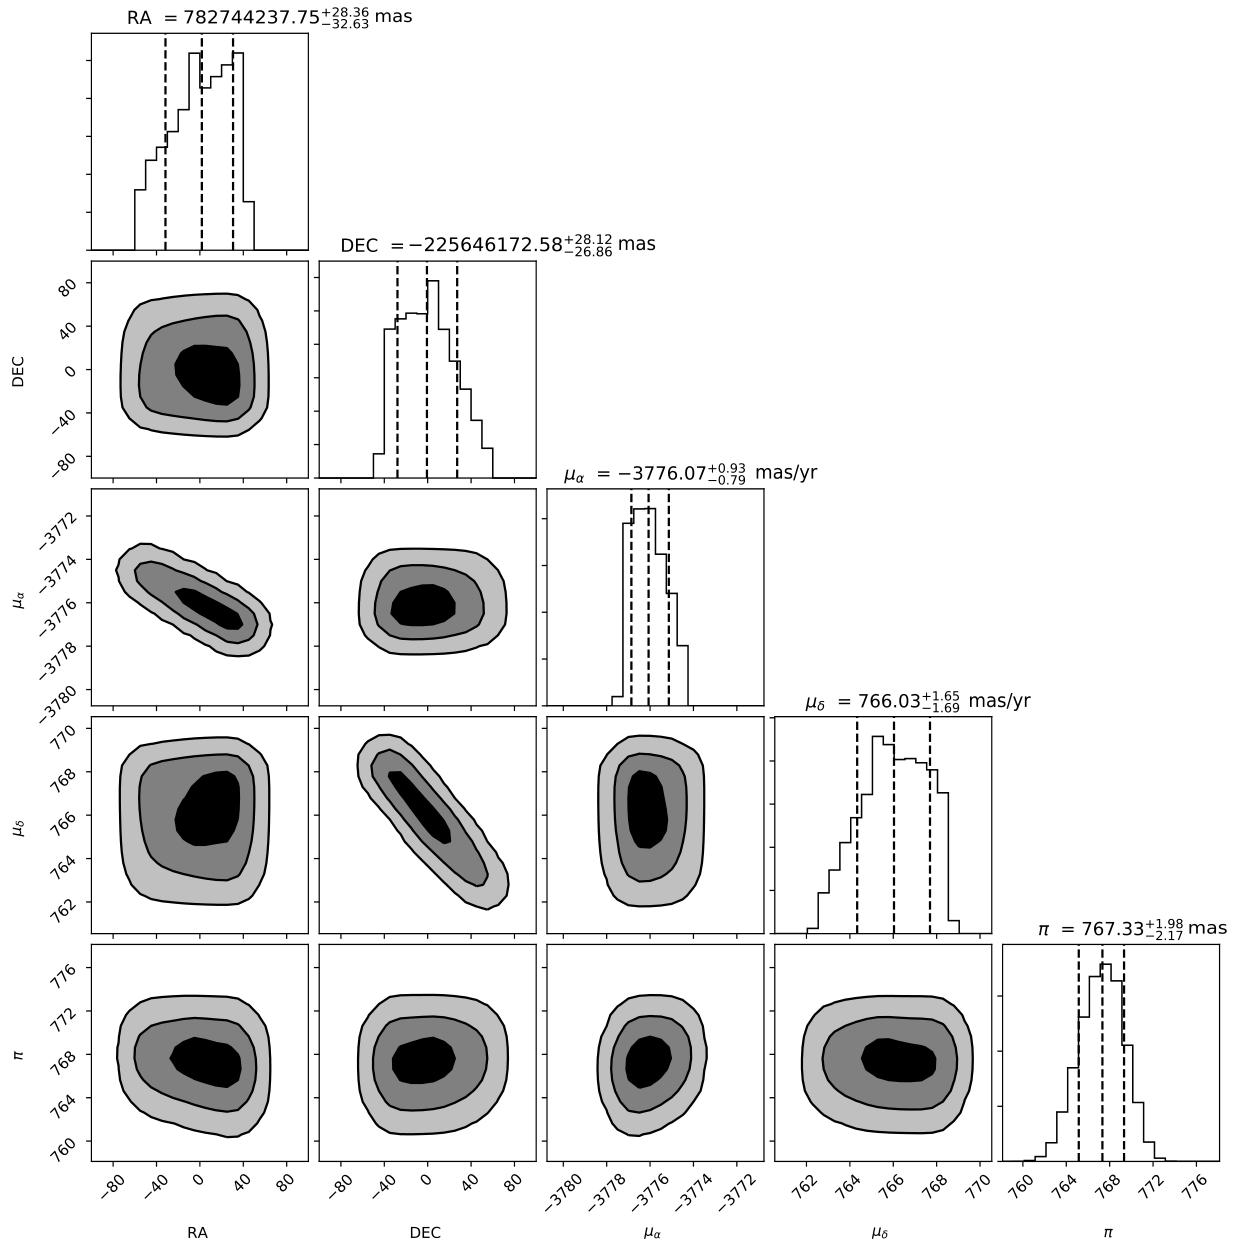
The result of the MCMC analysis for the movement of Proxima Centauri on the sky is shown in Figure 5 and listed in Table 3. The value of the parallax found is in agreement with the measurements by Benedict et al. (1999), 768.70.3 mas, and Lurie et al. (2014), 768.131.04 mas. This indicates that the correction between the parallax relative to the background stars and the absolute value is smaller than the error of the measurement.
To estimate the impact of neglecting PM and parallax of the background stars we performed another MCMC with this input: for each star we created synthetic measurements assuming as RA and Dec at the year 2016 the median value of the RA and Dec from our measurements. The parallax has been given randomly from a uniform distribution of distance between 1 and 3 kpc (we expect these distances for the background stars in the IRDIS FoV), while the PM has been calculated from a gaussian distribution of velocities with dispersion of 30 km/s, and random direction. From these synthetic data we derived again the parameters of the motion of Proxima Cen, and subsequently, the mass from the microlensing effect. The new value is M⊙ and the fit has a reduced chi-square of 0.88. This measurement is consistent with the one that neglects PM and parallax of the background stars.
| Measured relative motion | Hipparcos | |
|---|---|---|
| RA (J2000) | 14:29:42.949 | 14:29:42.949 |
| DEC (J2000) | -62:40:46.172 | -62:40:46.163 |
| -3776.07 | -3775.751.63 mas/year | |
| 766.06 | 765.542.01 mas/year | |
| 767.33 | 771.642.60 mas |
4 Results
4.1 Modelling of the microlensing event
After the determination of the accurate position of Proxima on the sky for each epoch, and the relative position of the background star Source 2, we measured the effect of the deflection of the light during the microlensing event. For that we have to consider that Source 2 itself has a proper motion (PM) and a parallax with respect to the other background stars. The parameters of the motion of the star in the sky are included as variables in the fit. In this fit we included also the WFC3/HST epoch of the 2013-03-31 to improve the baseline of the measurements of the relative positions between Proxima and Source 2. The reduction and analysis of this dataset is presented in Sahu et al., in prep. The position of the star was determined following the methods presented in Sec. 3.1.
The formula of the angular Einstein radius of a microlens is:
| (1) |
where M is the mass of the lens, and
| (2) |
where DL and D⋆ are the distances from Earth to the lens and the background source, respectively. In this case we can approximate the distance of Source 2 to be infinite, as the source is located at 0.5 kpc (see discussion below).
The angular displacement of the images of a background source (with respect to its true position) caused by the close passage of Proxima Cen can be written as:
| (3) |
with = /, where is the angular separation between the lens and the undeflected Source 2, following the formalism of Sahu et al. (2014). What we measure in our data is the separation vector along the axis defined by the lens-source, , which is shown in Fig. 6, while is calculated knowing the relative positions of Proxima and Source 2. From Eq. 3 we can then derive the angular Einstein radius , and the mass of the Proxima, .
| JD | RAmis | RAmod | O-C | Decmis | Decmod | O-C | Sepmis | Sepmod | O-C | PAmis | PAmod | O-C |
|---|---|---|---|---|---|---|---|---|---|---|---|---|
| -729.18 | -10522.31 | -10524.68 | 2.37 | 1925.77 | 1915.09 | 10.68 | 10697.08 | 10697.49 | -0.41 | 280.37 | 280.31 | 0.06 |
| 0.00 | -3001.82 | -3001.07 | -0.76 | 379.40 | 380.93 | -1.53 | 3025.70 | 3025.15 | 0.56 | 277.20 | 277.23 | -0.03 |
| 294.20 | -299.14 | -299.21 | 0.07 | -764.09 | -763.09 | -1.00 | 820.56 | 819.66 | 0.90 | 201.38 | 201.41 | -0.03 |
| 324.22 | 34.72 | 34.02 | 0.70 | -539.18 | -538.46 | -0.72 | 540.30 | 539.53 | 0.77 | 176.32 | 176.39 | -0.07 |
| 336.23 | 221.02 | 221.20 | -0.18 | -468.93 | -469.87 | 0.95 | 518.40 | 519.34 | -0.93 | 154.76 | 154.79 | -0.03 |
| 363.12 | 730.88 | 730.35 | 0.54 | -386.63 | -387.75 | 1.12 | 826.85 | 826.89 | -0.05 | 117.88 | 117.96 | -0.09 |
| 382.08 | 1140.03 | 1141.57 | -1.54 | -402.02 | -401.59 | -0.43 | 1208.84 | 1210.15 | -1.31 | 109.42 | 109.38 | 0.04 |
| 478.34 | 3026.99 | 3027.37 | -0.38 | -1247.22 | -1247.48 | 0.26 | 3273.87 | 3274.32 | -0.45 | 112.39 | 112.39 | -0.00 |
| 720.09 | 4332.93 | 4335.53 | -2.60 | -1170.17 | -1166.40 | -3.77 | 4488.16 | 4489.69 | -1.53 | 105.11 | 105.06 | 0.06 |
| 806.93 | 6222.03 | 6212.18 | 9.85 | -1593.26 | -1584.91 | -8.35 | 6422.79 | 6411.17 | 11.61 | 104.36 | 104.31 | 0.05 |
We performed a minimum -squared fit with the routine AMOEBA to determine the unknown values of the PM and parallax of the star and the deflection due to the microlensing effect, . AMOEBA is an IDL function which performs a minimum -squared fit using the downhill simplex method (Nelder & Mead 1965). The error bars assumed for each measurement of the relative position between Source 2 and Proxima Cen are chosen carefully following the methods presented in Sec. 4.2. In the fit, we also considered the effects of differential nutation, precession, and atmospheric diffraction (for SPHERE data). Even if these effects have a small contribution, they have to be taken into account when measuring the microlensing deflection.
The fit has a reduced -square of 0.87, there are 14 d.o.f., there are 20 fitted points (10 epochs and 2 coordinates), and there are 6 free parameters (5 parameters of the motion of Source 2, the angular Einstein radius). The best-fit results are listed in Table 5 and the model of the deflection of the light due to the microlensing event is shown in Figure 6. A detailed table presenting the measurements and the model is presented in Table 5.
The contrast of Source 2 with respect to Proxima Cen is J=11.00.2 mag. The apparent magnitude of the object is thus magJ=16.40.2. Given mV=19.9 (Sahu et al. 2014, from), the V-J color is equal to 3.50.3. This color is compatible with an M30.5 star (Johnson 1966) assuming no reddening. The absolute magnitude of such an object in the main sequence is MV=11.11.0 mag (Pecaut & Mamajek 2013), giving a distance modulus of 8.81.0 mag. The photometric distance of Source 2 is 0.58 kpc, or a parallax of 1.7 mas. This is slightly less than the parallax that we find with the microlensing model fit (3.250.39 mas). This value assumes a solar composition for Source 2, this may be the reason for the discrepancy between the photometric parallax and the parallax from the microlensing model.
| RA offset | -3003.92 mas |
|---|---|
| DEC offset | 385.98 mas |
| -1.65 mas/year | |
| 2.79 mas/year | |
| 3.25 mas | |
| 30.6 mas |
4.2 Error budget
To estimate the error on the IRDIS measurement of each background star we employed the formula for the position presented in Zurlo et al. (2014), which provides a measurements error that depends on the S/N ratio of the point source. The errors on the movement of Proxima Cen are automatically generated by the MCMC procedure. The more complex estimation is the value of the error bars of the astrometric position of Source 2. For that, we assumed that the error bar related to the centering, TN, and plate scale are negligible after the correction of the detector parameters and the close distance of Source 2 to the center of the image. Accurate centering for these datasets was performed with the waffles present in each of the imaging epochs. This approach provided a centering accuracy of 0.3 mas. As presented in Table 2, the errors on the plates cale and the TN direction are of the order of 0.003 mas/pixel and 0.015 deg, respectively. At the 500 mas separation between Source 2 and Proxima Cen, these contribute to the error with the negligible value of 0.1 mas.
The uncertainty is therefore only estimated from the centering and the fitting procedure, i.e. the error bar is calculated as = . Where in this case the fitting procedure is fake negative planets (FNP) method routine applied on the IFS dataset. The errors calculated using the FNP are the standard deviation of the results of the fitting procedure while varying the modes of the PCA used for the reduction. Given the high S/N ratio of the source in the IFS datasets (above 20), and the fact that the errors on the calibration are negligible, we reached sub-milliarcsecond precision. For the epochs of February, March, and April, i.e. the critical epochs, we assumed an error bar of 0.5 mas. For the IRDIS measurements, the error was estimated using the same method described for the other background stars. For the last epoch, the error bar is larger (10 mas) because Source 2 is at the edge of the IRDIS detector and the star is only partially visible.
4.3 The mass of Proxima Centauri
From the procedures described we calculated and using the equation 1 of Sec. 4.1, we obtained 0.150 M⊙ for Proxima Centauri. This is in agreement with the previous value assigned from luminosity-mass relations of M⊙ (Mann et al. 2015). We cannot further improve on this value with new SPHERE observations because Source 2 is no longer visible on the IRDIS detector when observing Proxima Cen. The precision of the astrometric position of this source is the highest ever reached with SPHERE, thanks to the exquisite quality of the data, and the calibration of the detector parameters with the large population of background stars in the FoV. Over the next few years, Proxima Cen will be followed-up to provide a better estimation of its movement on the sky. These data will be couple with observations from HST and Gaia to take advantage of future microlensing events. Unfortunately, no star as bright as Source 2 is expected to pass within 05 of Proxima Cen in the next 20 years. Therefore only fainter stars will be usable for this purpose.
The minimum mass of the planet around Proxima Cen is Msini=1.27 M⊕, assuming the host star mass of 0.1221 0.0022 M⊙ ((Anglada-Escudé et al. 2016)). If the microlensing derived mass of 0.150 M⊙ is assumed for Proxima Cen, the minimum mass of the planet is estimated to be Msini=1.56 M⊕.
4.4 Constraints on a previously identified transit-like event
Li et al. (2017) presented a candidate planetary transit around Proxima Cen. The depth of the candidate event was measured to be 0.005 mag in the I band. Given its phase, it could not be related to passage of the radial velocity detected planet (Proxima b) in front of the star. An eclipsing binary in the FWHM of the SPHERE IRDIS observations (5″) could have been the responsible for the signal detected transit like signal. However, there are no stars bright enough to mimic the transit in the IRDIS FoV. We calculate that a background eclipsing binary would need to be brighter than 13 mag in I band. Our SPHERE imaging data therefore rule out a background eclipsing binary as the source of the candidate transit and indicate that the event was produced by either another planet in the system (but see Li et al. 2017, for a discussion), some other astrophysical phenomenon (i.e. stellar activity), or noise.
5 Conclusions
Measurements of the parameters of Proxima Centauri, the closest star to our solar system, still suffer from significant uncertainties. In the past, its mass was indirectly determined using low-mass star mass-luminosity relations, which suffer from significant systematic uncertainties. Last year, an approximately Earth mass planet in the habitable zone was discovered using the radial velocity technique. In 2016, a unique opportunity to directly measure the mass of Proxima Centauri occurred: the star, as seen from Earth, approached a background source with an impact parameter of 05 and caused a microlensing event with Proxima Cen acting as the lens. In order to obtain precise astrometric measurement of the relative positions of the background source with respect to Proxima Cen and measure the deflection due to microlensing, we followed-up the star during a two-year monitoring program with SPHERE/IRDIFS. Nine epochs were obtained starting in March 2015.
We measured the deflection of the light of the background source caused by the close approach of Proxima Cen. The effect was revealed thanks to the exquisite sub-mas astrometric precision reached with SPHERE/IRDIFS. This was possible after careful recalibration of the detector parameters (true North, platescale, and centering) using the observations themselves as astrometric calibrators. The modelling of the angular Einstein radius of the microlensing effect gives a value of 0.150 M⊙ for the mass of Proxima Cen. This is the first time that the gravitational mass of the closest star to our Solar system has been measured. Future observations of Proxima Cen may improve the precision on this estimate. Gaia measurements of the proper motion and parallax of Source 2 in the future may also refine the microlensing analysis and allow a more precise recalculation of Proxima Cen’s mass.
Acknowledgements
We are grateful to the anonymous referee, after his/her revision the paper improved substantially. We are grateful to the SPHERE team and all the people at Paranal for the great effort during SPHERE GTO run. We are also grateful to Rodrigo F. Díaz for fruitful discussions. A.Z. acknowledges support from CONICYT through FONDECYT grant number 3170204. R.G., S.D. acknowledge support from the “Progetti Premiali” funding scheme of the Italian Ministry of Education, University, and Research. D.M. acknowledges support from the ESO-Government of Chile Joint Comittee program “Direct imaging and characterization of exoplanets”. We acknowledge support from the French National Research Agency (ANR) through the GUEPARD project grant ANR10-BLANC0504-01. H.A. acknowledges the financial support of the Swiss National Science Foundation through the NCCR PlanetS. SPHERE is an instrument designed and built by a consortium consisting of IPAG (Grenoble, France), MPIA (Heidelberg, Germany), LAM (Marseille, France), LESIA (Paris, France), Laboratoire Lagrange (Nice, France), INAF– Osservatorio di Padova (Italy), Observatoire de Genève (Switzerland), ETH Zurich (Switzerland), NOVA (Netherlands), ONERA (France) and ASTRON (Netherlands), in collaboration with ESO. SPHERE was funded by ESO, with additional contributions from CNRS (France), MPIA (Germany), INAF (Italy), FINES (Switzerland) and NOVA (Netherlands). SPHERE also received funding from the European Commission Sixth and Seventh Framework Programmes as part of the Optical Infrared Coordination Network for Astronomy (OPTICON) under grant number RII3-Ct-2004-001566 for FP6 (2004-2008), grant number 226604 for FP7 (2009-2012) and grant number 312430 for FP7 (2013-2016). This work has made use of the SPHERE Data Centre, jointly operated by OSUG/IPAG (Grenoble), PYTHEAS/LAM/CeSAM (Marseille), OCA/Lagrange (Nice), and Observatoire de Paris/LESIA (Paris).
References
- Anglada-Escudé et al. (2016) Anglada-Escudé G., et al., 2016, Nature, 536, 437
- Anglada et al. (2017) Anglada G., et al., 2017, ApJ, 850, L6
- Barron et al. (2011) Barron E. G., Kaplan G. H., Bangert J., Bartlett J. L., Puatua W., Harris W., Barrett P., 2011, in American Astronomical Society Meeting Abstracts #217. p. 344.14
- Benedict et al. (1999) Benedict G. F., et al., 1999, AJ, 118, 1086
- Beuzit et al. (2008) Beuzit J.-L., et al., 2008, in Society of Photo-Optical Instrumentation Engineers (SPIE) Conference Series. p. 18, doi:10.1117/12.790120
- Bonnefoy et al. (2016) Bonnefoy M., et al., 2016, A&A, 587, A58
- Claudi et al. (2008) Claudi R. U., et al., 2008, in Society of Photo-Optical Instrumentation Engineers (SPIE) Conference Series. , doi:10.1117/12.788366
- Delorme et al. (2017) Delorme P., et al., 2017, preprint, (arXiv:1712.06948)
- Dohlen et al. (2008) Dohlen K., et al., 2008, in Society of Photo-Optical Instrumentation Engineers (SPIE) Conference Series. , doi:10.1117/12.789786
- Foreman-Mackey et al. (2013) Foreman-Mackey D., Hogg D. W., Lang D., Goodman J., 2013, PASP, 125, 306
- Fusco et al. (2006) Fusco T., et al., 2006, Opt. Express, 14, 7515
- Johnson (1966) Johnson H. L., 1966, ARA&A, 4, 193
- Kervella et al. (2017) Kervella P., Thévenin F., Lovis C., 2017, A&A, 598, L7
- Lagrange et al. (2010) Lagrange A.-M., et al., 2010, Science, 329, 57
- Li et al. (2017) Li Y., Stefansson G., Robertson P., Monson A., Cañas C., Mahadevan S., 2017, Research Notes of the American Astronomical Society, 1, 49
- Lurie et al. (2014) Lurie J. C., et al., 2014, AJ, 148, 91
- Maire et al. (2016a) Maire A.-L., et al., 2016a, A&A, 587, A56
- Maire et al. (2016b) Maire A.-L., et al., 2016b, in Ground-based and Airborne Instrumentation for Astronomy VI. p. 990834 (arXiv:1609.06681), doi:10.1117/12.2233013
- Mann et al. (2015) Mann A. W., Feiden G. A., Gaidos E., Boyajian T., von Braun K., 2015, ApJ, 804, 64
- Markwardt (2009) Markwardt C. B., 2009, in Bohlender D. A., Durand D., Dowler P., eds, Astronomical Society of the Pacific Conference Series Vol. 411, Astronomical Data Analysis Software and Systems XVIII. p. 251 (arXiv:0902.2850)
- Marois et al. (2006) Marois C., Lafrenière D., Doyon R., Macintosh B., Nadeau D., 2006, ApJ, 641, 556
- Mesa et al. (2015) Mesa D., et al., 2015, A&A, 576, A121
- Mesa et al. (2017) Mesa D., et al., 2017, MNRAS, 466, L118
- Nelder & Mead (1965) Nelder J. A., Mead R., 1965, Computer Journal, 7, 308
- Pavlov et al. (2008) Pavlov A., Möller-Nilsson O., Feldt M., Henning T., Beuzit J.-L., Mouillet D., 2008, in Society of Photo-Optical Instrumentation Engineers (SPIE) Conference Series. p. 39, doi:10.1117/12.789110
- Pecaut & Mamajek (2013) Pecaut M. J., Mamajek E. E., 2013, ApJS, 208, 9
- Sahu et al. (2014) Sahu K. C., Bond H. E., Anderson J., Dominik M., 2014, ApJ, 782, 89
- Sahu et al. (2017) Sahu K. C., et al., 2017, Science, 356, 1046
- Soummer et al. (2012) Soummer R., Pueyo L., Larkin J., 2012, ApJ, 755, L28
- Thalmann et al. (2008) Thalmann C., et al., 2008, in Society of Photo-Optical Instrumentation Engineers (SPIE) Conference Series. , doi:10.1117/12.789158
- Vigan et al. (2010) Vigan A., Moutou C., Langlois M., Allard F., Boccaletti A., Carbillet M., Mouillet D., Smith I., 2010, MNRAS, 407, 71
- Vigan et al. (2016) Vigan A., et al., 2016, A&A, 587, A55
- Zurlo et al. (2014) Zurlo A., et al., 2014, A&A, 572, A85
- Zurlo et al. (2016) Zurlo A., et al., 2016, A&A, 587, A57
- van Leeuwen (2007) van Leeuwen F., 2007, A&A, 474, 653