Swift Observations of the bright uncatalogued X-ray transient MAXI J1535-571
Abstract
The black hole candidate MAXI J1535-571 is a recently discovered X-ray transient. We report on the monitoring observations of Swift Gamma-Ray Burst Mission during outburst. The source transits from the hard state to the intermediate state, and reaches the soft state; near the end of the outburst, it returns to the hard state passing through the low intermediate state, following a typical Q-shaped loop in the hardness-intensity diagram. During the high intermediate state, detailed spectral analyses using a multi-temperature disk model reveal that the disk luminosity is flatter than the inner disk temperature to the fourth power, and the disk temperature profile varies as the disk radius raised to the power of , consistent with the behavior of a slim disk, implying that the disk structure has been modified due to the high luminosity of erg s-1. Meanwhile, the column density increases with the Eddington ratio, suggesting that the outflow matters are driven by radiation pressure due to the high accretion rate.
Keywords:
stars: individual (MAXI J1535-571) — X-rays: binaries — accretion, accretion disks — black hole physics1 Introduction
A Low-mass X-ray binary system with a black hole compact object usually accretes matter from a companion star via Roche-lobe overflow and demonstrates a transient behavior. Driven by instabilities in the accretion disk (Lasota, 2001), it may undergo an outburst after a long quiescent period, accordingly, its luminosity can vary by many orders of magnitude. The spectra in the outburst are primarily contributed by two components, i.e., a standard thin accretion disk (Shakura & Sunyaev, 1973) and a corona in a power-law form. In a typical outburst, the source usually undergo several different spectral states (Fender et al., 2004; Remillard & McClintock, 2006; Done et al., 2007, e.g.,). At the initial onset phase of an outburst, it is in a hard state with the spectrum dominated by a hard power-law component, and a steady jet may be present in this period. As the accretion rate increases, the source goes through an intermediate state and then reaches a soft state. In the soft state, the accretion disk dominates the emission and the power law component becomes much softer, meanwhile, the jet quenches. The source stays in soft state until the late fading stage of the outburst. Then it returns to an intermediate state with an intensity lower than the one in the previous intermediate state. At the end of an outburst, the source turns back to the hard state. Thus, through the outburst, a black hole transient typically follows an counterclockwise Q-shaped loop in the hardness-intensity diagram (HID) (Belloni et al., 2005; Belloni & Motta, 2016, e.g.,).
In some giant outbursts, the luminosity can approach to or exceed the classical Eddington limit (Revnivtsev et al., 2002; Tomsick et al., 2005; Motta et al., 2017, e.g.,). The accretion disk can no longer keep its thin structure and becomes geometrically thick (Abramowicz et al., 1988, slim disk,), in the meanwhile, advection becomes the dominant process. Photons are trapped in the disk and the emission is thus inefficient. The disk luminosity and inner disk temperature relationship is then expected to be flatter than that of the standard thin disk (Watarai et al., 2000).
In this study, we report on a giant outburst of a new X-ray transient, MAXI J1535-571, which exhibits clear spectral evolution during the outburst. The source was serendipitously discovered with the Monitor of All-sky X-ray Image (Matsuoka et al., 2009, MAXI;) Gas Slit Camera (GSC) and the Neil Gehrels Swift Observatory (Swift) Burst Alert Telescope (Barthelmy, 2004, BAT;) when it went into outburst on 2017 September 2nd (Negoro et al., 2017a; Markwardt et al., 2017). Using Swift/X-ray Telescope (Burrows et al., 2005, XRT;) Photon Counting (PC) mode data with the exposure time of 3279 s, the corrected X-ray position of the source was reported to be R.A.=, Decl.=- (J2000.0) (Kennea et al., 2017). The X-ray flux in the 4.0–10.0 keV band was about 34 mCrab (Negoro et al., 2017a), and its Swift/XRT spectrum was well represented by an absorbed power-law model with a neutral hydrogen column density () of and a photon index of 1.53, indicating the source was in hard state (Kennea et al., 2017).
Follow-up X-ray observations of MAXI J1535-571 were performed. Its MAXI/GSC spectrum obtained on September 5 also agreed with an absorbed power-law model, but the photon index was about 1.84, softer than that obtained on September 2nd (Negoro et al., 2017b). seemed to be stable (), but was larger than the line-of-sight Galactic column density, (Kalberla et al., 2005), suggesting that the accretion disk or the dense interstellar gas might obscure the source.
The source continued to brighten and soften on September 10-11, and the Swift/BAT count rate in the 15–50 keV band started to decrease, indicating that the source might undergo a hard to soft state transition (Nakahira et al., 2017; Kennea, 2017; Palmer et al., 2017). In the following MAXI/GSC observation taken on September 20, the source intensity in the 2–20 keV band increased to 5 Crab, and the photon index reached to the value of 2.9. The thermal component also appeared in the spectrum; the inner disk temperature was about 1.5 keV throughout the fitting with a multi-temperature disk blackbody model (diskbb11 1 https://heasarc.gsfc.nasa.gov/xanadu/xspec/manual/node159.html) (Shidatsu et al., 2017). Later works performed by the MAXI team obtain a more detailed look at the state transition of the source (Nakahira et al., 2018). They argued that two counterclockwise circles appeared on the HID. The source stayed at the soft state until 2018 April 30; then it showed spectral hardening in Swift/XRT observations and went back to the hard state (Russell et al., 2018).
The Swift/XRT power density spectrum of September 11 showed a strong low-frequency quasi-periodic oscillation (QPO) with the first and second harmonics at 1.87 Hz and 3.87 Hz, respectively (Mereminskiy & Grebenev, 2017). The QPOs also were detected by Neutron star Interior Composition ExploreR (Gendreau et al., 2012, NICER;) between September 12 and 13 (Gendreau et al., 2017). The frequency of the first harmonic drifted between 1.9 Hz and 2.8 Hz, with the fractional root-mean-squared (rms) amplitude to be 6%, while the frequency of the second harmonic drifted between 3.8 Hz and 5.6 Hz, with the fractional rms of 5% (Gendreau et al., 2017). Benefiting from the large effective area of Insight-HXMT, QPOs were also definitely detected in the energy band up to 100 keV (Huang et al., 2018). Recently, some works reported the detailed evolution of the QPO parameters (Mereminskiy et al., 2018; Shang et al., 2018).
Nuclear Spectroscopic Telescope Array (Harrison et al., 2013, NuSTAR;) detected a broad Fe line and a Compton hump with the peak energy of 30 keV on September 7 (Xu et al., 2018). Using a model combining a multi-temperature thermal component, a lamppost reflection model (Dauser et al., 2014; García et al., 2014, relxilllpCp;) and an unblurred reflection model (García & Kallman, 2010, xillverCp;), they found the BH spin as , the inner disk radius as 22 2 is the innermost stable circular orbit., and the inclination angle of the inner disk . They also reported the existence of a broad iron emission line in the NICER spectra taken on September 13. Using the model of relxill (Dauser et al., 2014; García et al., 2014) which is a combination of a multi-temperature thermal component and a relativistic reflection, Gendreau et al. (2017) obtained a consistent BH spin, , but much lower inclination, . Miller et al. (2018) recently reanalyzed the NICER data and obtained a near-maximal spin of 0.994. Moreover, they found that the accretion disk is likely to be warped and the inclination of the inner disk is .
Multiwavelength observations of this source were also performed. The optical counterpart was identified by the 0.61m B&C Telescope at Mt. John Observatory. The magnitude in the SDSS -band was 21m.79, while no source was detected in the SDSS and bands, suggesting that the source might be a low mass X-ray binary (LMXB) (Scaringi & ASTR211 Students, 2017). The near-infrared (NIR) counterpart was identified in the following observations taken on September 5, by the Small and Moderate Aperture Research Telescope System (SMARTS) 1.3m telescope at Cerro Tololo Inter-American Observatory (CTIO) (Dincer, 2017). Gemini observed the source on October 2, and found that the source had faded by about 2m.2 in the -band. A Brackett-gamma emission line appeared in the K-band spectrum with the line centroid at 21667 Å with the FWHM of Å ( km/s) (Britt et al., 2017).
The radio counterpart of MAXI J1535-571 was discovered by the Australia Telescope Compact Array (ATCA) on September 5 (Russell et al., 2017). The flux densities at 5.5 GHz and 9.0 GHz had a power-law form with an index of , consistent with emission from a compact jet. The Atacama Large Millimetre/Sub-Millimetre Array (ALMA) and the ATCA then observed the radio source on September 11 and 12, respectively (Tetarenko et al., 2017). A spectral break between the 140–230 GHz was found, which means that the optically thick jet changed to optically thin at this frequency range.
Inferred from the X-ray and multiwavlength observations, MAXI J1535-571 differs from a neutron star. Its radio luminosity at 5 GHz is well above the limit of all known neutron star binaries, but consistent with the values of BH binaries (Russell et al., 2017). Moreover, its MAXI/GSC light curve shows rapid X-ray variability with no obvious pulsation (Negoro et al., 2017b) and is lack of X-ray bursts. Moreover, its unabsorbed flux of the 1–60 keV in the onset of the outburst is erg cm-2 s-1; assuming a typical distance of Galactic black holes (BHs) of 8 kpc, the luminosity is erg s-1 and violates the classical Eddington limit of a neutron star (Negoro et al., 2017b). However, the dynamical mass constraint is not available yet, thus we prefer to mention that it is still a BH candidate, instead of firmly conclude its BH nature.
In this paper, we particularly use Swift monitoring observations (Section 2) to investigate the spectral evolution and properties of the recently discovered BH candidate, MAXI J1535-571 (Section 3), and then discuss the results in Section 4.

2 OBSERVATIONS and Data reduction
Monitoring of MAXI J1535-571 with Swift commenced on 2017 September 2. In order to study the outburst properties of the source, we search for all of Swift/XRT observations until 2018 May 14th. Due to its extreme brightness, except for the late fading stage, we only use the data taken in windowed timing (WT) mode. In the late fading stage, the data taken in photon counting (PC) mode are used instead as the source is very weak. The properties of the observations are listed in Table 3.
| ObsID | Observed date | Observed date | Exposure | Count rateb | Count ratec | Pixelsd | State |
|---|---|---|---|---|---|---|---|
| (day) | (MJD) | (s) | (cts s-1) | (cts s-1) | |||
| 770431000 | 2017-09-02 20:07:41 | 57998.84 | 1615.86 | 0 | Hard | ||
| 770502000 | 2017-09-03 09:02:43 | 57999.38 | 75.03 | 0 | Hard | ||
| 770656000 | 2017-09-04 14:05:48 | 58000.59 | 15.60 | 0 | Hard | ||
| 770656001 | 2017-09-04 17:12:35 | 58000.72 | 988.80 | 0 | Hard | ||
| 10264002 | 2017-09-06 00:41:58 | 58002.03 | 449.23 | 2 | Hard | ||
| 10264003 | 2017-09-08 06:40:51 | 58004.28 | 4948.53 | 3 | Hard | ||
| 771371000 | 2017-09-08 11:39:18 | 58004.49 | 69.12 | 4 | Hard | ||
| 10264004 | 2017-09-11 06:34:43 | 58007.27 | 1089.61 | 7 | HIM | ||
| 10264005 | 2017-09-12 06:19:10 | 58008.26 | 899.61 | 9 | HIM | ||
| 10264007 | 2017-09-13 00:11:05 | 58009.01 | 889.45 | 9 | HIM | ||
| 10264006 | 2017-09-14 22:19:59 | 58010.93 | 1074.61 | 9 | HIM | ||
| 10264008 | 2017-09-15 09:19:30 | 58011.39 | 984.64 | 8 | HIM | ||
| 10264009 | 2017-09-16 02:47:14 | 58012.12 | 1059.79 | 9 | HIM | ||
| 88245001 | 2017-09-17 04:17:53 | 58013.18 | 2223.08 | 11 | HIM | ||
| 10264010 | 2017-09-18 04:13:31 | 58014.18 | 1104.61 | 10 | HIM | ||
| 10264011 | 2017-09-19 08:56:26 | 58015.37 | 989.39 | 0e | SIM | ||
| 88245002 | 2017-09-20 23:13:58 | 58016.97 | 954.61 | 11 | SIM | ||
| 88245003 | 2017-09-21 00:48:59 | 58017.03 | 1014.19 | 13 | SIM | ||
| 10264012 | 2017-09-22 15:17:53 | 58018.64 | 1189.21 | 13 | SIM | ||
| 10264013 | 2017-09-23 02:23:05 | 58019.10 | 1009.60 | 13 | SIM | ||
| 10264014 | 2017-09-24 02:29:57 | 58020.10 | 599.21 | 13 | SIM | ||
| 10264015 | 2017-09-25 21:30:52 | 58021.90 | 899.49 | 13 | SIM | ||
| 10264016 | 2017-09-26 18:15:01 | 58022.76 | 909.22 | 13 | SIM | ||
| 10264017 | 2017-09-27 16:40:13 | 58023.70 | 859.22 | 11 | SIM | ||
| 10264018 | 2017-09-28 18:04:31 | 58024.75 | 1044.61 | 12 | SIM | ||
| 10264019 | 2017-09-29 18:00:51 | 58025.75 | 964.65 | 12 | SIM | ||
| 10264020 | 2017-09-30 18:01:05 | 58026.75 | 889.62 | 13 | SIM | ||
| 10264021 | 2017-10-01 17:51:20 | 58027.74 | 874.62 | 12 | SIM | ||
| 10264022 | 2017-10-02 17:48:25 | 58028.74 | 1109.61 | 12 | SIM | ||
| 10264023 | 2017-10-03 17:46:07 | 58029.74 | 1004.61 | 11 | SIM | ||
| 10264024 | 2017-10-04 17:44:51 | 58030.74 | 964.61 | 11 | SIM | ||
| 10264025 | 2017-10-05 15:55:38 | 58031.66 | 604.61 | 10 | SIM | ||
| 10264026 | 2017-10-06 11:08:37 | 58032.47 | 1154.61 | 11 | SIM | ||
| 10264027 | 2017-10-07 04:37:47 | 58033.19 | 1024.61 | 11 | SIM | ||
| 10264028 | 2017-10-08 05:57:40 | 58034.25 | 974.61 | 12 | SIM | ||
| 10264029 | 2017-10-09 10:54:12 | 58035.46 | 1059.61 | 10 | SIM | ||
| 10264030 | 2017-10-10 12:07:37 | 58036.51 | 994.06 | 10 | SIM | ||
| 10264031 | 2017-10-11 07:35:39 | 58037.32 | 854.62 | 9 | SIM | ||
| 88245004 | 2017-10-22 23:42:52 | 58048.99 | 2088.03 | 6 | SIM | ||
| 88246001 | 2017-10-24 23:31:53 | 58050.98 | 1528.20 | 6 | SIM | ||
| 10491002 | 2018-01-19 08:08:13 | 58137.34 | 1119.61 | 3 | Soft | ||
| 10264032 | 2018-03-17 19:13:28 | 58194.80 | 279.62 | 0 | Soft | ||
| 10264033 | 2018-03-18 10:47:57 | 58195.45 | 1370.35 | 0 | Soft | ||
| 10264034 | 2018-03-24 21:16:57 | 58201.89 | 1859.22 | 0 | Soft | ||
| 10264035 | 2018-03-26 13:28:47 | 58203.56 | 1409.22 | 0 | Soft | ||
| 10264036 | 2018-03-28 13:23:57 | 58205.56 | 2015.28 | 0 | Soft | ||
| 10264037 | 2018-03-30 02:03:57 | 58207.09 | 1910.28 | 0 | Soft | ||
| 10264038 | 2018-04-01 20:30:56 | 58209.86 | 509.46 | 0 | Soft | ||
| 10264039 | 2018-04-07 18:47:57 | 58215.79 | 2244.15 | 0 | Soft | ||
| 10264040 | 2018-04-09 11:41:57 | 58217.49 | 2131.63 | 0 | Soft | ||
| 10264041 | 2018-04-12 00:32:57 | 58220.03 | 1949.17 | 0 | Soft | ||
| 10264042 | 2018-04-13 14:35:57 | 58221.61 | 1719.23 | 0 | Soft | ||
| 10264043 | 2018-04-16 23:58:57 | 58225.00 | 1115.41 | 0 | Soft | ||
| 10264044 | 2018-04-18 15:51:57 | 58226.66 | 249.45 | 0 | Soft | ||
| 10264045 | 2018-04-21 22:21:57 | 58229.94 | 1063.92 | 0 | Soft | ||
| 10264046a | 2018-04-24 22:04:57 | 58232.92 | 1703.15 | 0 | IM | ||
| 10264047a | 2018-04-26 02:32:56 | 58234.11 | 1797.36 | 0 | IM |
| ObsID | Observed date | Observed date | Exposure | Count rateb | Count ratec | Pixelsd | State |
|---|---|---|---|---|---|---|---|
| (day) | (MJD) | (s) | (cts s-1) | (cts s-1) | |||
| 10264048a | 2018-04-29 21:21:57 | 58237.89 | 1771.22 | 0 | Hard | ||
| 10264049a | 2018-05-02 21:23:57 | 58240.90 | 1854.74 | 0 | Hard | ||
| 10264050a | 2018-05-08 20:48:58 | 58246.87 | 1790.09 | 0 | Hard | ||
| 10264051a | 2018-05-10 09:17:57 | 58248.39 | 1903.64 | 0 | Hard | ||
| 10264052a | 2018-05-12 07:17:56 | 58250.31 | 1003.63 | 0 | Hard | ||
| 10264053a | 2018-05-14 08:41:38 | 58252.37 | 1470.92 | 0 | Hard |
aThe observations are taken in photon counting mode.
bThe observed count rates, which are not corrected for bad pixels, background and pileup.
cThe count rates in the 0.5–10.0 keV band have been corrected for bad pixels, background and pileup, using the PSF correction factor in xrtmkarf.
dThe radii of the excluded region.
eDuring this observation, Swift partly missed the source.


The Swift/XRT data are reduced using XSELECT, HEASoft v6.22, with XRT CALDB version 20170501. However, most of the observations are faced with several pileups due to the high count rates ( cts s-1, Table 1) of the source. We thus extract the counts by excluding the core using an annulus if pileup is present in the observation. The inner radius of the excluded region is selected so that the extracted count rate falls below 100 cts s-1 (method 1, Table 1). For comparison, we also investigate the level of pileup by increasing the excluded region and seeking for the key radius where the spectra is no longer soften (method 2, see Section 3.2 for more details) or the fraction of grade 0 events stay close to constant (method 3) 33 3 http://www.swift.ac.uk/analysis/xrt/pileup.php. Method 1 and 2 give a consistent result. Method 3, however, shows a trend towards a smaller excluded region, and thus is not strict as the method 1 and 2.
The outer radius of the extracted region is 20 pixels. For WT mode data, the background extraction region is an annulus centered at the source with the inner and the outer radii of 90 and 110 pixels, respectively. For PC mode data, the background extraction region is a source-free annulus centered at the source with the inner and the outer radii of 60 and 110 pixels, respectively. Using the ftool xrtmkarf including the point-like PSF correction, ancillary response files are created and the ratios between the total fluence of the source and the fluence within the annular extraction region are estimated. The loss of counts due to pileup and bad pixels are then corrected using the fluence ratio. Finally, except for the last six observations (ObsID 10264048 – 10264053), the extracted spectra are rebinned to contain minimum 20 counts per bin using grppha in order to use statistics in the spectral fits below (section 3.2). For ObsID 10264048 – 10264053, there are very few photons, the spectra are thus grouped with a minimum of 1 count in each bin, and we use C statistic in the spectral fits.
3 Results
3.1 Light Curve and Hardness Ratio
As shown in the light curves (Figure 1) of Swift/BAT (15--50 keV band)44 4 https://swift.gsfc.nasa.gov/results/transients/weak/MAXIJ1535-571/ and XRT (0.5–10 keV), the source went through a clear evolution and was extremely variable over the duration of the outburst. The hardness ratio, defined as the ratio of the count rates in the 4.0–10 keV to 0.5–4.0 keV bands, exhibited four distinguishable groups (Figure 1): it stayed around 0.5–0.6 at the beginning of the outburst (group A), but suddenly decreased to on MJD 58007 (group B), and then stayed close to that level; after a ninety-day interval that Swift did not observe the source, the hardness ratio was less than 0.2, which is much smaller than the previous values (group C); near the end of the outburst, the hardness ratio suddenly jumped up to a high level, with a value of around 0.6, similar to that of the beginning of the outburst (group D). Different groups in the hardness ratio may indicate different spectral state. Therefore, the source may undergo several state transitions over the course of the outburst.
HIDs are powerful tools to distinguish different spectral states. We thus plotted two HIDs using Swift/XRT observations in the energy range of 0.5–10.0 keV from MJD 57999 to MJD 58252 and the simultaneous MAXI/GSC data 55 5 http://134.160.243.77/star_data/J1535-572/J1535-572.html in the energy range of 2–20 keV, and marked the four groups above with the same symbols used for the hardness ratio curve (Figure 2). Near the end of the outburst, the source was too weak to be detected by MAXI, thus group D is not in the MAXI HID. Two HIDs follow a similar X-ray spectral evolution track, similar to the typical Q-shaped loop of BH binaries (Belloni & Motta, 2016, Figure 4 of ). Group A and D are in the right branches of the HIDs, which means that the source was in the hard state of raising stage and fading stage, respectively. Group C is in the left branches of the HIDs, which indicates that the source was in the soft state. Group B goes through a small counter clockwise loop, and it is referred to the intermediate state. Since several pileups are present in most of Swift/XRT observations, the central source pixels are excluded and the final enough count rate were not enough to do detailed timing analyses. However, benefiting from pileup-free and large effective area of Insight-HXMT, based on the timing analyses, Huang et al. (2018) argued that the source was in the intermediate state from MJD 58008 to MJD 58019, which is consistent with our results. Moreover, the spectral analyses explained in Section 3.2 verifies our state identification.
3.2 Spectral Properties
The XSPEC v12.9.1m software package (Arnaud, 1996) is used to perform the spectral fits. For the absorption calculation, the absorption model (tbabs) with Wilms et al. (2000) abundances and Verner et al. (1996) cross-sections, is implemented. The Swift/XRT data below 1.0 keV are ignored during the spectral fits in order to exclude the low-energy spectral residuals in windowed timing mode. For PC mode, the spectra in the energy range of 0.3–10.0 keV is adopted to the spectral fits. If pileup is present in an observation, the level of pileup is investigated by increasing the excluded region. We find that the photon index () stays stable when using the radius listed in Table 1, and the typical change in is less than 0.02 when continuing to increase the excluded region. The spectra of BH binaries are usually a composite of a thermal component, represented by a diskbb model, and a nonthermal component, represented by a power-law model (Remillard & McClintock, 2006). We thus experiment several models, i.e., a single power-law, a single diskbb and a two-component model consisting of power-law and disk components, to explore the significance of the disk and power-law components. The two-component model is preferred only if the F-test probability is low (). However, near the end of the outburst (ObsID 10264046 – 10264053), the source is so weak, therefore count rates are not enough to decide the best fitting model, we thus inferred it from the hardness raio (Figure 1). For ObsID 10264046 – 10264047, the hardness ratio started to increase and the source passed through the hard state after four days, thus the two-component model is used. For ObsID 10264048 – 10264053, a single power-law is preferred as the source has already come back to the hard state. The models adopted are summarized in Table 1.
The X-ray absorption column density , the photon index , the inner disk temperature , the square root of the normalization of the diskbb model () are shown in Figure 3. The absorbed flux of the power-law and disk components in the 0.5–10.0 keV band, and the evolution of the ratios of the disk component flux to the total flux are shown in Figure 4. Parameter errors around the peak of outburst are larger than that in the raising stage and early fading stage, which seems to be in strong contrast with the expected uncertainty in statistics. However, we should note that the ‘detected’ counts are similar in these stages due to the pileup-excluding criteria ( cts s-1), and the PSF correction factor in xrtmkarf are needed to correct the ‘real’ counts. Therefore, although the ‘detected’ statistical errors in these stages are similar, the actual uncertainties around the outburst peak became much larger due to a large PSF correction factor.
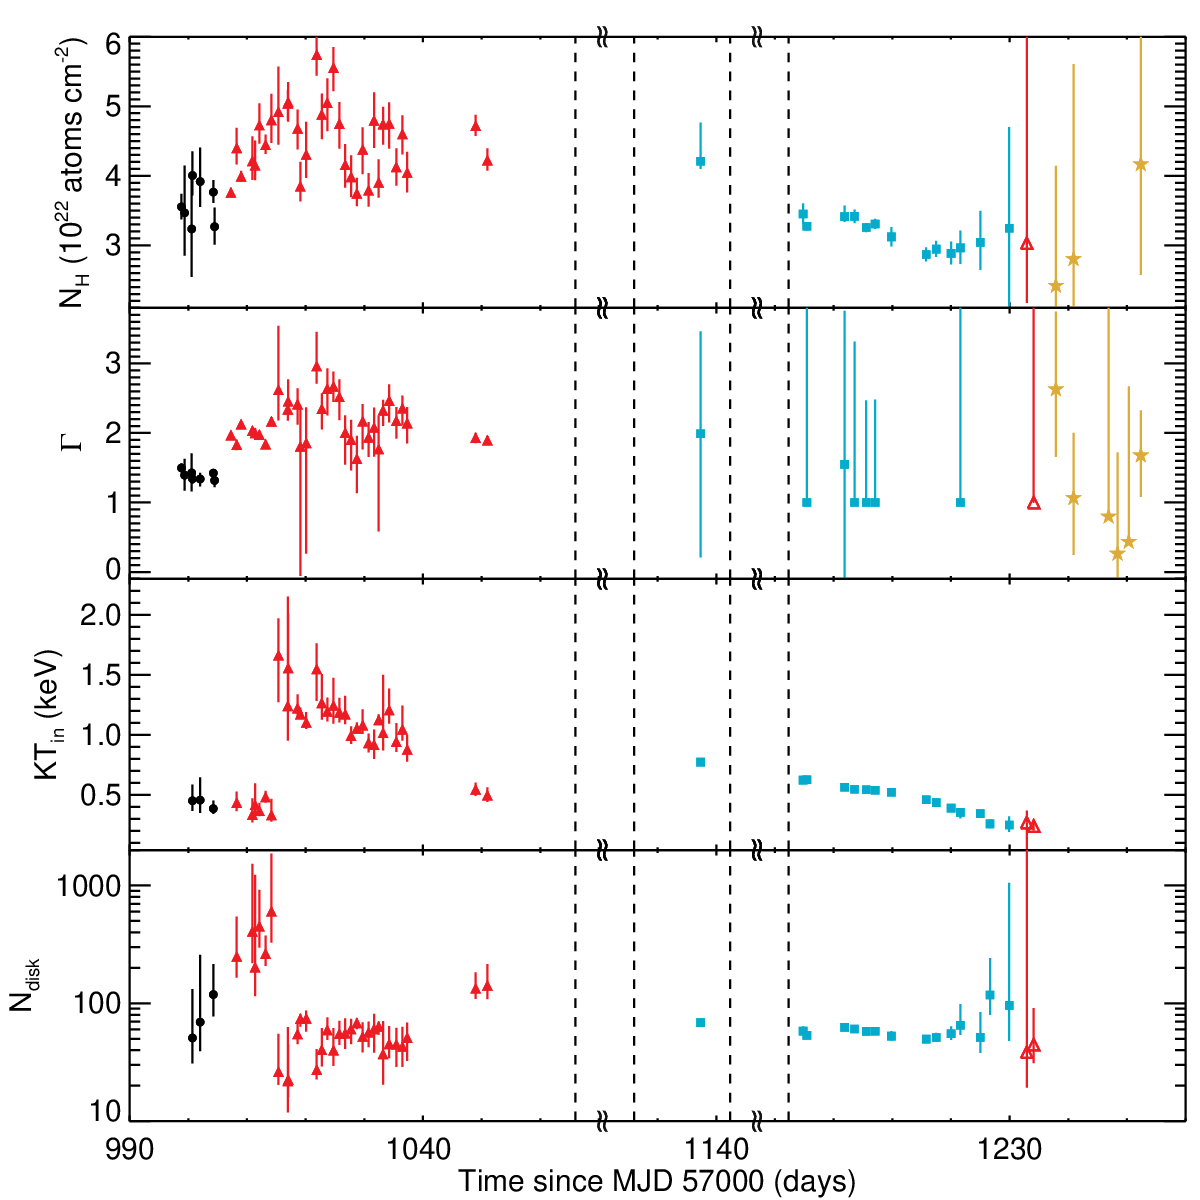

Compared with the Galactic absorption column density (Kalberla et al., 2005, , ), show an obvious excess in the whole outburst, indicating that some intrinsic materials, such as the accretion disk, interstellar gas and outflow matter, may obscure the source. Moreover, evolves along the outburst and reaches its peak value around the outburst maxima.
At the beginning of the outburst (MJD 57999 – 58004), the spectra were hard ( 1.5), and the disk component was cool ( 0.5 keV) and weak (disk fraction 5%), consistent with the expectations of the hard state. As the accretion rate increasing, the source entered into the intermediate state. The power-law component became softer and the disk component started to be significant in the flux. Upon closer inspection, there were three parts in this state (Figure 3 and 4): MJD 58007 – 58014 (ObsID 10264004 – 10264010, part 1), MJD 58015 – 58037 (ObsID 10264011 – 10264031, part 2) and MJD 58049 – 58051 (ObsID 88245004 – 88246001, part3). were about in part 2, larger than that of parts 1 and 3 (); the inner disk temperature of part 2 had a significantly higher level, while the inner disk radius () were much lower than that of parts 1 and 3; of part 2 were larger, so the disk component was stronger. Although we could not perform the timing analysis with Swift/XRT observations due to pileup effect, the timing results of Insight-HXMT found that the fractional rms over 0.1–32 Hz (1-12 keV) decreased from 15% on MJD 58014 to 1.9% on MJD 58015 and meanwhile QPOs switched from type C to type B (Huang et al., 2018). Inferred from the spectral and timing properties, part 1 is in hard intermediate (HIM) state, while part 2 is soft intermediate (SIM) state. We also refer to part 3 as a hard intermediate state because the spectral properties are similar to that of part 1, even though there are no timing studies during this period. After a ninety-day interval, when Swift observed the source again (MJD 58137), we found that the disk component dominated the emission with 80% and was stable, indicating that the source may go through another soft intermediate state, which was not detected due to the lack of observations, and reached the soft state finally. The source stayed in the soft state until MJD 58230. Around MJD 58233–58234 (ObsID 10264046 – 10264047), decreased to be less than 40%, and four days later, the source was in the hard state again. We thus revise ObsID 10264046 and 10264047 as intermediate state. For convenience, the state classifications are listed in Table 3.


3.3 Disk Component
In general, the disk component of black hole can be well described with a standard thin disk (Shakura & Sunyaev, 1973). Its disk luminosity and the inner disk temperature follows , and its radial temperature profile varies as . However, the disk structure may be modified if the source is bright. The peak flux of MAXI J1535-571 is Crab, we thus need to test whether its disk component follows the standard scenario. As some key parameters, i.e, the distance and the inclination , are not well constrained, we thus use the disk luminosity and the square root of the normalization of the diskbb model, instead, to test the relations and .
versus , as shown in the left panel of Figure 5, follows a tight relation, except for the observations which the source was in the high intermediate state. We thus fit versus in the high intermediate state (middle panel of Figure 5) and the remaining states (right panel of Figure 5) to a power-law function, respectively, and found that is and . Moreover, we also test the relation if only fitting data in the SIM state and soft state, respectively, and obtain for the SIM state and for the soft state.
versus are plotted in Figure 6. In the high intermediate state (middle panel of Figure 6), and appear to have a robust correlation. The radial temperature profile has a flatter of if fitting to a power-law function (). The data in the right panel of Figure 6 show clearly that the soft state has an approximately constant radius, consistent with the expectation that the inner disk extends to the innermost stable circular orbit (ISCO) in the soft state. in the hard state is not significantly larger than that in the soft state, indicating that the inner disk is not significantly truncated, consistent with the result of Xu et al. (2018), which report an inner disk radius of in the hard state based on the reflection modeling of NuSTAR data.
| ObsID | Model | |||||
|---|---|---|---|---|---|---|
| () | (keV) | ()f | ||||
| 770431000 | PL | 410.9/450 | ||||
| 770502000 | PL | 49.1/58 | ||||
| 770656000 | PL | 45.0/42 | ||||
| 770656001 | PLBB | 736.0/700 | ||||
| 10264002 | PLBB | 583.6/608 | ||||
| 10264003 | PLBB | 984.4/855 | ||||
| 771371000 | PL | 188.6/227 | ||||
| 10264004 | PL | 763.0/696 | ||||
| 10264005 | PLBB | 695.6/672 | ||||
| 10264007 | PL | 701.5/661 | ||||
| 10264006 | PLBB | 700.9/681 | ||||
| 10264008 | PLBB | 681.5/682 | ||||
| 10264009 | PLBB | 781.1/689 | ||||
| 88245001 | PLBB | 859.2/769 | ||||
| 10264010 | PLBB | 718.1/692 | ||||
| 10264011 | PLBB | 486.1/516 | ||||
| 88245002 | PLBB | 687.8/660 | ||||
| 88245003 | PLBB | 709.8/645 | ||||
| 10264012 | PLBB | 789.9/648 | ||||
| 10264013 | PLBB | 623.4/615 | ||||
| 10264014 | PLBB | 597.5/577 | ||||
| 10264015 | PLBB | 678.8/618 | ||||
| 10264016 | PLBB | 658.2/634 | ||||
| 10264017 | PLBB | 650.8/611 | ||||
| 10264018 | PLBB | 636.2/632 | ||||
| 10264019 | PLBB | 637.5/622 | ||||
| 10264020 | PLBB | 658.5/634 | ||||
| 10264021 | PLBB | 644.7/632 | ||||
| 10264022 | PLBB | 699.5/651 | ||||
| 10264023 | PLBB | 607.4/631 | ||||
| 10264024 | PLBB | 678.7/645 | ||||
| 10264025 | PLBB | 612.3/612 | ||||
| 10264026 | PLBB | 658.8/645 | ||||
| 10264027 | PLBB | 681.4/656 | ||||
| 10264028 | PLBB | 599.2/618 | ||||
| 10264029 | PLBB | 689.1/654 | ||||
| 10264030 | PLBB | 656.0/644 | ||||
| 10264031 | PLBB | 581.9/621 | ||||
| 88245004 | PLBB | 885.3/760 | ||||
| 88246001 | PLBB | 694.2/729 | ||||
| 10491002 | PLBB | 508.7/510 | ||||
| 10264032 | BB | 241.1/253 | ||||
| 10264033 | PLBB | c | 448.2/404 | |||
| 10264034 | PLBB | 381.3/371 | ||||
| 10264035 | PLBB | c | 364.9/323 | |||
| 10264036 | PLBB | c | 391.5/353 | |||
| 10264037 | PLBB | c | 442.4/347 | |||
| 10264038 | BB | 245.3/226 | ||||
| 10264039 | BB | 275.5/247 | ||||
| 10264040 | BB | 209.2/227 | ||||
| 10264041 | BB | 184.0/171 | ||||
| 10264042 | PLBB | c | 136.6/133 |
| ObsID | Model | |||||
|---|---|---|---|---|---|---|
| () | (keV) | ()f | ||||
| 10264043 | BB | 100.9/63 | ||||
| 10264044 | BB | 21.5/11 | ||||
| 10264045 | BB | 22.1/21 | ||||
| 10264046 | PLBB | 1ce | 11.1/9 | |||
| 10264047 | PLBB | c | 6.6/5 | |||
| 10264048a | PL | 58.7/63 | ||||
| 10264049a | PL | 55.3/68 | ||||
| 10264050a | PL | d | 0.3/1 | |||
| 10264051a | PL | 4.3/10 | ||||
| 10264052a | PL | d | 3.2/4 | |||
| 10264053a | PL | 120.6/159 |
aUsing the C statistic (cstat in xspec) to fit the spectra.
b is fixed at as it is difficult to be constrained.
cThe power-law component is weak and favors a negative value when it is a free fit parameter. So, the lower limit of is fixed to 1.
dThe parameter lower limit andeupper limit are invalid due to a low statistic.
fThe goodness of fit in C statistic is described in terms of .
4 Discussion
Swift monitoring observations and the detailed spectral analyses of the recently discovered BH candidate, MAXI J1535-571, are presented in this paper.
4.1 State evolution
The source was first detected in the hard state, then went through the high intermediate state, and reached the soft state afterward. Near the end of the outburst, the source went back to the low intermediate state and finally returned to the hard state66 6 Some most recent data reveal that the source has several state transitions at the end of the outburst (Parikh et al., 2018; Negoro et al., 2018). But the source flux is weak, we thus decide not to do detailed spectral analysis. . It shows a specific counter clockwise Q-shaped loop in the HIDs.
We track the evolution of the model parameters, such as , , , and the component flux, during the outburst. is larger than the Galactic value, suggesting that there are some intrinsic materials to obscure the source. Especially, shows a peak around the peak of the outburst. We discuss the indication in Section 4.3. The power-law component is weak in the soft state and is significant and harder in the hard state, while the disk component dominates the X-ray spectrum in the soft state and is weaker in the intermediate and hard states, consistent with the typical behaviors of Galactic black hole binaries.
4.2 Mass estimation
The spin of BH can be measured by fitting the disk continuum (Zhang et al., 1997), assuming a standard thin disk, or by fitting the general relativistic ray (García et al., 2014, e.g.,), and the normalization of the diskbb model can be used to infer the BH mass if giving the spin and inclination values. In the soft state, of MAXI J1535-571 is approximately constant, indicating that the inner disk extends to the ISCO. We thus use the measurements obtained in the soft state to estimate the BH mass. Assuming , and , the BH mass is obtained to be larger than for a distance of 10 kpc, or greater than for a distance of 5 kpc. But we also note that the measurements of and are strongly dependent on the model, and the distance is unknown, thus the mass estimation here is only an estimate.
4.3 Eddington accretion
The peak flux of the source is up to Crab and its disk structure may be modified from the standard thin disk due to the high accretion rate. In order to investigate the physics of the accretion disk, we have examined the relationship between disk luminosity and temperature, , and the radial emission profile of the disk temperature, . We found and in the high intermediate state (middle panels of Figures 5 and 6), in contrast with the expectations of a simple thin disk, but consistent with a slim disk (Abramowicz et al., 1988). In the remaining states, an of well agrees with the value of a standard thin disk. Therefore, we replace the diskbb model in the high intermediate state with a disk model with a variable exponent to the disk temperature profile, i.e., -free disk model (diskpbb)77 7 https://heasarc.gsfc.nasa.gov/xanadu/xspec/manual/node164.html in XSPEC. The expected for a standard thin disk is 0.75, while for a slim disk, is 0.5. If a power law is added to the -free disk model, we are not able to constrain in the spectral fits, and all possible values, from 0.5 to 1.0, are allowed. If the -free model is used alone, appears to be , consistent with the expectations of a slim disk. If we fix of diskpbb at 0.5 and fit the spectra again88 8 It is difficult to constrain the power-law index for some observations, and a negative value is obtained if fitting the component freely. We thus set the lower limit of the power-law index to be 1., and would be subject to a power-law function with an index of (Figure 7). If only fitting the data in the SIM state, the index would be . Moreover, we note that in the SIM state is smaller than that of the soft state, which is seemingly unreasonable because the inner disk already extends to the ISCO in the soft state. However, for a high accretion rate, the advection-dominated flow does not abruptly decrease inside the ISCO. An amount of matter inside the ISCO can produce a substantial radiation, thus the derived inner disk radius is smaller than that of the ISCO (Watarai et al., 2000).

The slim disk is dominated by the advection within the disk, and becomes radiatively inefficient due to the advection process, resulting in the flattening of the and relationship. , in the radial emission profile, is expected as for a slim disk (Watarai et al., 2000). A slim disk exists when the luminosity is close to the Eddington or moderately super-Eddington. The disk luminosity of MAXI J1535-571, in the high intermediate state, is larger than erg s-1 and could reach up to several of erg s-1, approaching to or exceeding the Eddington limit of a stellar mass BH. As a result of this high accretion rate, the disk of MAXI J1535-571 cannot maintain its thin geometry, and becomes slim. The slim accretion disk has also been suggested for a few Galactic BH binaries in high state, such as XTE J1550-564 (Kubota & Makishima, 2004), 4U 1630-47 (Tomsick et al., 2005) and V404 Cyg (Motta et al., 2017), and also for some Ultraluminous X-ray sources (Kaaret et al., 2017).


In usually, as the mass accretion rate increases, the radiation pressure begins to dominate and a outflow is blown from the disk, which can obscure the source and increase . Actually, in MAXI J1535-571 is larger than the Galactic column density, and shows an evolution in the outburst with a peak around the flux maxima. We thus test the correlation (Figure 8) between and the Eddington ratio assuming a BH mass of , which is an average estimation above. keep about when unabsorbed (upper panel of Figure 8) is low () and start to increase as the increasing of , consistent with the scenario that outflows are driven by high accretion rate. Especially in high intermediate state, is significantly larger. However, we also note that there is a degeneracy between and unabsorbed , as a higher will recover a larger unabsorbed . Therefore, we test the correlation between and observed , and found that high observed also correspond to large . Moreover, except for observations that the source are in the hard source, also seems to be correlated with the unabsorbed of disk component, and starts to enhance around several percent of .
Blueshifted X-ray absorption features are discovered in some super-Eddington sources (Pinto et al., 2016; Walton et al., 2016), and explained as originating in a wind flowing toward us. For MAXI J1535-571, some low-energy line-like residuals, such as an absorption feature at keV and an emission feature at keV, appear in the spectra (Figure 9). But the detections of the line features are marginal99 9 The line feature is so weak that it will not affect the continuum fitting results., and we note that the residuals near the Silicon and Gold edges ( keV) were previously observed in some XRT spectra1010 10 http://www.swift.ac.uk/analysis/xrt/digest_cal.php#res. Although the improved calibration files have reduced the residuals, in a few cases, the feature is still apparent. Therefore, we do not go further in this paper based on the current data quality. High spectral resolution data are needed to further resolve the feature in MAXI J1535-571.


Acknowledgments
We thank the anonymous referee for useful comments that have improved the paper. LT acknowledges funding support from the National Natural Science Foundation of China (NSFC) under grant numbers U1838115, the CAS Pioneer Hundred Talent Program Y8291130K2 and the Scientific and technological innovation project of IHEP Y7515570U1. CG acknowledges support from CAS President’s International Fellowship Initiative (PIFI). JQ thank support from the Chinese NSFC 11673023. We thank support from National Key R&D Program of China (grant No. 2016YFA0400800), the Chinese NSFC U1838201, 11733009 and 11473027, XTP project XDA 04060604, the Strategic Priority Research Programme ’The Emergence of Cosmological Structures’ of the Chinese Academy of Sciences, Grant No.XDB09000000,and the Chinese NSFC U1838202.
References
- Abramowicz et al. (1988) Abramowicz, M. A., Czerny, B., Lasota, J. P., & Szuszkiewicz, E. 1988, ApJ, 332, 646
- Arnaud (1996) Arnaud, K. A. 1996, Astronomical Data Analysis Software and Systems V, 101, 17
- Barthelmy (2004) Barthelmy, S. D. 2004, Proc. SPIE, 5165, 175
- Belloni et al. (2005) Belloni, T., Homan, J., Casella, P., et al. 2005, A&A, 440, 207
- Belloni & Motta (2016) Belloni, T. M., & Motta, S. E. 2016, Astrophysics of Black Holes: From Fundamental Aspects to Latest Developments, 440, 61
- Britt et al. (2017) Britt, C. T., Bahramian, A., & Strader, J. 2017, The Astronomer’s Telegram, 10816,
- Burrows et al. (2005) Burrows, D. N., Hill, J. E., Nousek, J. A., et al. 2005, SSRv, 120, 165
- Dauser et al. (2014) Dauser, T., García, J., Parker, M. L., Fabian, A. C., & Wilms, J. 2014, MNRAS, 444, L100
- Dincer (2017) Dincer, T. 2017, The Astronomer’s Telegram, 10716,
- Done et al. (2007) Done, C., Gierliński, M., & Kubota, A. 2007, A&AR, 15, 1
- Fender et al. (2004) Fender, R. P., Belloni, T. M., & Gallo, E. 2004, MNRAS, 355, 1105
- García & Kallman (2010) García, J., & Kallman, T. R. 2010, ApJ, 718, 695
- García et al. (2014) García, J., Dauser, T., Lohfink, A., et al. 2014, ApJ, 782, 76
- Gendreau et al. (2012) Gendreau, K. C., Arzoumanian, Z., & Okajima, T. 2012, Proc. SPIE, 8443, 844313
- Gendreau et al. (2017) Gendreau, K., Arzoumanian, Z., Markwardt, C., et al. 2017, The Astronomer’s Telegram, 10768,
- Harrison et al. (2013) Harrison, F. A., Craig, W. W., Christensen, F. E., et al. 2013, ApJ, 770, 103
- Huang et al. (2018) Huang, Y., et al. 2018, submitted
- Kaaret et al. (2017) Kaaret, P., Feng, H., & Roberts, T. P. 2017, ARA&A, 55, 303
- Kalberla et al. (2005) Kalberla, P. M. W., Burton, W. B., Hartmann, D., et al. 2005, A&A, 440, 775
- Kennea et al. (2017) Kennea, J. A., Evans, P. A., Beardmore, A. P., et al. 2017, The Astronomer’s Telegram, 10700,
- Kennea (2017) Kennea, J. A. 2017, The Astronomer’s Telegram, 10731,
- Kubota & Makishima (2004) Kubota, A., & Makishima, K. 2004, ApJ, 601, 428
- Lasota (2001) Lasota, J.-P. 2001, NewAR, 45, 449
- Markwardt et al. (2017) Markwardt, C. B., Burrows, D. N., Cummings, J. R., et al. 2017, GCN CIRCULAR, 21788
- Matsuoka et al. (2009) Matsuoka, M., Kawasaki, K., Ueno, S., et al. 2009, PASJ, 61, 999
- Mereminskiy & Grebenev (2017) Mereminskiy, I. A., & Grebenev, S. A. 2017, The Astronomer’s Telegram, 10734,
- Mereminskiy et al. (2018) Mereminskiy, I. A., Grebenev, S. A., Prosvetov, A. V., & Semena, A. N. 2018, arXiv:1806.06025
- Miller et al. (2018) Miller, J. M., Gendreau, K., Ludlam, R. M., et al. 2018, arXiv:1806.04115
- Motta et al. (2017) Motta, S. E., Kajava, J. J. E., Sánchez-Fernández, C., et al. 2017, MNRAS, 471, 1797
- Nakahira et al. (2017) Nakahira, S., Negoro, H., Mihara, T., et al. 2017, The Astronomer’s Telegram, 10729,
- Nakahira et al. (2018) Nakahira, S., Shidatsu, M., Makishima, K., et al. 2018, arXiv:1804.00800
- Negoro et al. (2017a) Negoro, H., Ishikawa, M., Ueno, S., et al. 2017a, The Astronomer’s Telegram, 10699,
- Negoro et al. (2017b) Negoro, H., Kawase, T., Sugizaki, M., et al. 2017b, The Astronomer’s Telegram, 10708,
- Negoro et al. (2018) Negoro, H., Sugawara, Y., Nakajima, M., et al. 2018, The Astronomer’s Telegram, 11682,
- Palmer et al. (2017) Palmer, D. M., Krimm, H. A., & Swift/BAT Team 2017, The Astronomer’s Telegram, 10733,
- Parikh et al. (2018) Parikh, A. S., Russell, T. D., Wijnands, R., et al. 2018, The Astronomer’s Telegram, 11652,
- Pinto et al. (2016) Pinto, C., Middleton, M. J., & Fabian, A. C. 2016, Nature, 533, 64
- Remillard & McClintock (2006) Remillard, R. A., & McClintock, J. E. 2006, ARA&A, 44, 49
- Revnivtsev et al. (2002) Revnivtsev, M., Gilfanov, M., Churazov, E., & Sunyaev, R. 2002, A&A, 391, 1013
- Russell et al. (2017) Russell, T. D., Miller-Jones, J. C. A., Sivakoff, G. R., Tetarenko, A. J., & Jacpot Xrb Collaboration 2017, The Astronomer’s Telegram, 10711,
- Russell et al. (2018) Russell, T. D., Altamirano, S. R. D., Miller-Jones, J. C. A., et al. 2018, The Astronomer’s Telegram, 11611,
- Scaringi & ASTR211 Students (2017) Scaringi, S., & ASTR211 Students 2017, The Astronomer’s Telegram, 10702,
- Shang et al. (2018) Shang, J. R. et al. 2018, arXiv:1806.07147
- Shakura & Sunyaev (1973) Shakura, N. I., and Sunyaev, R. A., A&A, 24, 337–355(1973).
- Shidatsu et al. (2017) Shidatsu, M., Nakahira, S., Negoro, H., et al. 2017, The Astronomer’s Telegram, 10761,
- Tetarenko et al. (2017) Tetarenko, A. J., Russell, T. D., Miller-Jones, J. C. A., Sivakoff, G. R., & Jacpot Xrb Collaboration 2017, The Astronomer’s Telegram, 10745,
- Tomsick et al. (2005) Tomsick, J. A., Corbel, S., Goldwurm, A., & Kaaret, P. 2005, ApJ, 630, 413
- Verner et al. (1996) Verner, D. A., Ferland, G. J., Korista, K. T., & Yakovlev, D. G. 1996, ApJ, 465, 487
- Walton et al. (2016) Walton, D. J., Middleton, M. J., Pinto, C., et al. 2016, ApJL, 826, L26
- Watarai et al. (2000) Watarai, K.-y., Fukue, J., Takeuchi, M., & Mineshige, S. 2000, PASJ, 52, 133
- Wilms et al. (2000) Wilms, J., Allen, A., & McCray, R. 2000, ApJ, 542, 914
- Xu et al. (2018) Xu, Y., Harrison, F. A., García, J. A., et al. 2018, ApJL, 852, L34
- Zhang et al. (1997) Zhang, S. N., Cui, W., & Chen, W. 1997, ApJL, 482, L155