Performance Metrics for the Objective Assessment of Capacitive Deionization Systems
Abstract
In the growing field of capacitive deionization (CDI), a number of performance metrics have emerged to describe the desalination process. Unfortunately, the separation conditions under which these metrics are measured are often not specified, resulting in optimal performance at minimal removal. Here we outline a system of performance metrics and reporting conditions that resolves this issue. Our proposed system is based on volumetric energy consumption (Wh/m3) and throughput productivity (L/h/m2) reported for a specific average concentration reduction, water recovery, and feed salinity. To facilitate and rationalize comparisons between devices, materials, and operation modes, we propose a nominal standard testing condition of removing 5 mM from a 20 mM NaCl feed solution at 50% water recovery for CDI research. Using this separation, we compare the desalination performance of a flow-through electrode (fte-CDI) cell and a flow between membrane (fb-MCDI) device, showing how significantly different systems can be compared in terms of generally desirable desalination characteristics. In general, we find that performance analysis must be considered carefully so to not allow for ambiguous separation conditions or the maximization of one metric at the expense of another. Additionally, for context we discuss a number of important underlying performance indicators and cell characteristics that are not performance measures in and of themselves but can be examined to better understand differences in performance.
1 Introduction
Capacitive deionization (CDI) encompasses a group of water desalination technologies that uses cyclic charging and discharging of electrodes and the resulting electrosorption of ions to deplete or enrich a feed water stream.Biesheuvel et al. (2017) Interest in CDI has grown substantially in recent years, with currently more than 150 publications annually reporting on the topic.Zhang et al. (2018) As often occurs in a growing device research field, a need has emerged for establishing guidelines for evaluating, reporting, and comparing device performance.Balducci et al. (2017); Khenkin et al. (2018); Gogotsi and Simon (2011); Brousse et al. (2015); Editorial (2015); Zuliani et al. (2015) At present, much of the work in CDI focuses on materials and methods to improve the efficiency and desalination capacity of the system, but many published studies are actually not comparable to one another. This is primarily because either certain critical performance parameters are not reported, or the desalination conditions explored are different in some substantial aspect.
For desalination technologies such as reverse osmosis (RO) or electrodialysis (ED), performance metrics typically include energy consumption per volume of dilute effluent and a volume throughput parameter.Cohen-Tanugi et al. (2014); Park et al. (2017); Alvarado and Chen (2014); Pan et al. (2017) This set of metrics is sufficient for comparison between removal methods only when the water recovery (WR), feed salinity, and total concentration reduction are the same.Park et al. (2017) In other words, energy and throughput metrics alone are insufficient to provide a comparable description of performance because these values depend critically on the separation conditions. Achieving comparable separation conditions in CDI is particularly difficult because the method usually removes a smaller, highly variable fraction of the ions. Since extrapolating results from one set of removal conditions to another is not straightforward, it is critical to control for the feed salinity, concentration reduction, and water recovery in a performance evaluation.
To add to the complexity of the CDI performance landscape, the community has turned to a number of metrics to describe its desalination process. Some commonly used energy, throughput, and materials metrics in CDI are: the salt adsorption capacity (SAC, in mg/g of electrodes), average salt adsorption rate (ASAR, in mol/min/cm2 or in mg/g/min),Zhao et al. (2013); Kim and Yoon (2015); Hemmatifar et al. (2016); Hawks et al. (2018); Wang and Lin (2018) energy consumption per mole of salt removed (in kJ/mol kJ/g, or /ion),Zhao et al. (2012); Qu et al. (2016); Suss et al. (2015); Shang et al. (2017) energy normalized adsorbed salt (ENAS, in mol/J),Hemmatifar et al. (2016); Hawks et al. (2018); Oyarzun et al. (2018) and specific energy consumption (SEC, in mg/J).Suss et al. (2015); Wang and Lin (2018) While these metrics may be insightful for the processes relevant to CDI, it would be beneficial to settle upon a minimum-necessary set of measures that reflect economically relevant desalination performance. Additionally, it is important to distinguish between throughput and energy consumption, as these different desalination aspects often trade off with one another. Indeed, several studies have shown that SAC, ASAR, and ENAS, for example, are highly coupled with clear tradeoffs among them.Hemmatifar et al. (2016); Kim and Yoon (2015); Hawks et al. (2018); Wang and Lin (2018) For instance, adsorption rate can be increased at the cost of higher energy consumption or lower SAC.Hemmatifar et al. (2016); Kim and Yoon (2015) Thus, both an energy and a throughput metric must be reported for a given separation in order to fully define performance.
With these considerations in mind, herein we present a framework for objectively comparing desalination performance in capacitive-based removal systems along with an example standardized deionization protocol for CDI research. We also discuss the relation between the proposed parameters and their typically-used traditional counterparts. Our goal here is to create a framework by which generic, economically relevant, desalination capability can be evaluated for a given separation with any CDI-type approach. To highlight how this framework can be implemented, we propose a protocol that can be easily followed for both large and small laboratory-scale devices with the intent of facilitating study-to-study comparisons in CDI research. Hence, for example, our procedure does not prescribe flow rates, charging methods, device size, electrode configuration, or even removal mechanism. For context, we also distinguish between performance “metrics” and performance “indicators”, where metrics are meant to reflect generic desalination performance and indicators are used to better understand why a certain performance was achieved. Since understanding the reasons behind differences in performance is vitally important to technological progress, we discuss a number of performance indicators and highlight the essential cell characteristics that underlie many of these results.
2 Framework for Comparing Deionization Performance
Our proposed approach to evaluating desalination performance of a CDI system is pictographically shown in Fig. 1. First, and most importantly, a target separation must be defined, which includes the feed salt concentration (), the concentration reduction after treatment (), and the water recovery (). With these conditions defined, the desalination performance can be evaluated by examining the energy consumed per cubic meter of diluate, , in Wh/m3 and the throughput productivity, , in L/h/m2, where the area unit in corresponds to the projected face area of a typical device (i.e., the face area over which electrodes overlap, see Fig. S2 in the supporting information) or projected face area of the membranes in a flow-electrode cell.Cohen-Tanugi et al. (2014); Pan et al. (2017); Doornbusch et al. (2016) These performance metrics are defined quantitatively below for dynamic steady state (DSS) cycling but pertain to any operation mode (e.g., batch, flow-electrode, etc.). By controlling for the separation conditions, new materials,Huang et al. (2017) device geometries,Suss et al. (2015) electrode configurations,Mubita et al. (2018); Qu et al. (2018) and operation modesQu et al. (2016); Dykstra et al. (2018); García-Quismondo et al. (2016) can be objectively compared to one and other in terms of their energy consumption and volume throughput (see Section 2.1 and 2.2 for an example of such a comparison).
Here we advocate for and as opposed to, for example, the various other metrics mentioned above because the end product of deionization is most often a volume of treated water, which means that volume-based performance measures are more directly relevant to practical applications. While it may seem that additional performance measures lend further insight, in fact many of these metrics are closely related by definition (see section 3.0.5). In the end, the total cost of the process is of course the ultimate comparator, but cost can vary too much due to a number of application-specific factors. Thus, here we use the productivity as a surrogate for capital cost, and the energy consumption as a surrogate for operational cost. In addition, the choice of and as primary performance measures will help facilitate comparisons between CDI and other desalination methods, better defining where and how CDI is technologically relevant.Pan et al. (2018); Zhao et al. (2013); van Limpt and van der Wal (2014) Finally, the approach of Fig. 1 has a direct relevance to thermodynamic efficiency, which is another insightful comparator of separation efficiency.Długołecki and Van Der Wal (2013); Wang et al. (2018); Biesheuvel (2009); Hemmatifar et al. (2018) Thus, from here we refer to and as primary performance metrics and the various other (molar) metrics as secondary performance metrics.

In addition to and as primary performance measures, Fig. 1 also highlights the other crucial aspect of our perforamnce framework: defining the separation conditions. The issue with overlooking separation conditions is that virtually any desalination performance metric will be enhanced at lower water recovery and/or removal (i.e., lower concentration reduction or absolute amount of moles removed). Indeed, it has been demonstrated that SAC, ASAR, and ENAS can all improve when the magnitude of concentration reduction is decreased.Hawks et al. (2018); Wang and Lin (2018) Fig. 4 also confirms this effect, showing that for higher energy consumption increases and productivity decreases or remains constant. In general, improving any performance metrics without a set minimum concentration reduction will result in a maximum value at irrelevant, vanishingly small concentration reductions. Furthermore, the risk of only examining metrics normalized by salt adsorbed or concentration reduced is that such parameters mask the absolute amount removed. Concentration reduction is of course not the only important separation condition, as CDI performance is expected to increase with higher feed salinity due to lower ionic resistances. Thus, CDI performance results at the same concentration reduction and water recovery are not equivalent if taken with different feed concentrations. Finally, there is no straightforward way to convert performance metrics between separation conditions. Even for simple changes in the separation, a quantitative prediction of how performance should scale is difficult, requiring a full well-calibrated model.Ramachandran et al. (2018) If multiple parameters are changed, a quantitative comparison of experiment and data is even more difficult.Biesheuvel et al. (2014)
To illustrate the need for specifying separation conditions, in Fig. 2 we plot simulated performance curves from the simple resistive model of Hawks et al.Hawks et al. (2018) for various concentration reductions (). Fig. 2 shows that both removal rate (as described by ASAR), throughput (as described by productivity), and energy consumption (as described by ENAS or ) are simultaneously and monotonically enhanced at lower average concentration reduction of the feed stream. The input parameters for the model were taken from experimental results from Hawks et al.,Hawks et al. (2018) and the plot was generated by varying the applied current and flow rate for CC operation with a constant 1 V voltage window.

The model assumes no Faradaic losses, but this assumption will not change the overall conclusion that performance typically increases with lower concentration reduction. We note that the same general conclusions were recently reached by Wang et al.Wang and Lin (2018) with a different cell geometry and device model. Thus, without specifying the concentration reduction, for example, one is free to exploit the fact that “desalinated” water is any water that has a salt concentration less than the feed, regardless of how much less concentration. Additionally, both Fig. 2 and Fig. 4 highlight the inherent trade-off between throughput and energy consumption that often emerges, reinforcing the assertion that it is critical to report both energy and throughput metrics for a given separation.Wang and Lin (2018)
2.1 Example Standardized Separation for CDI Research
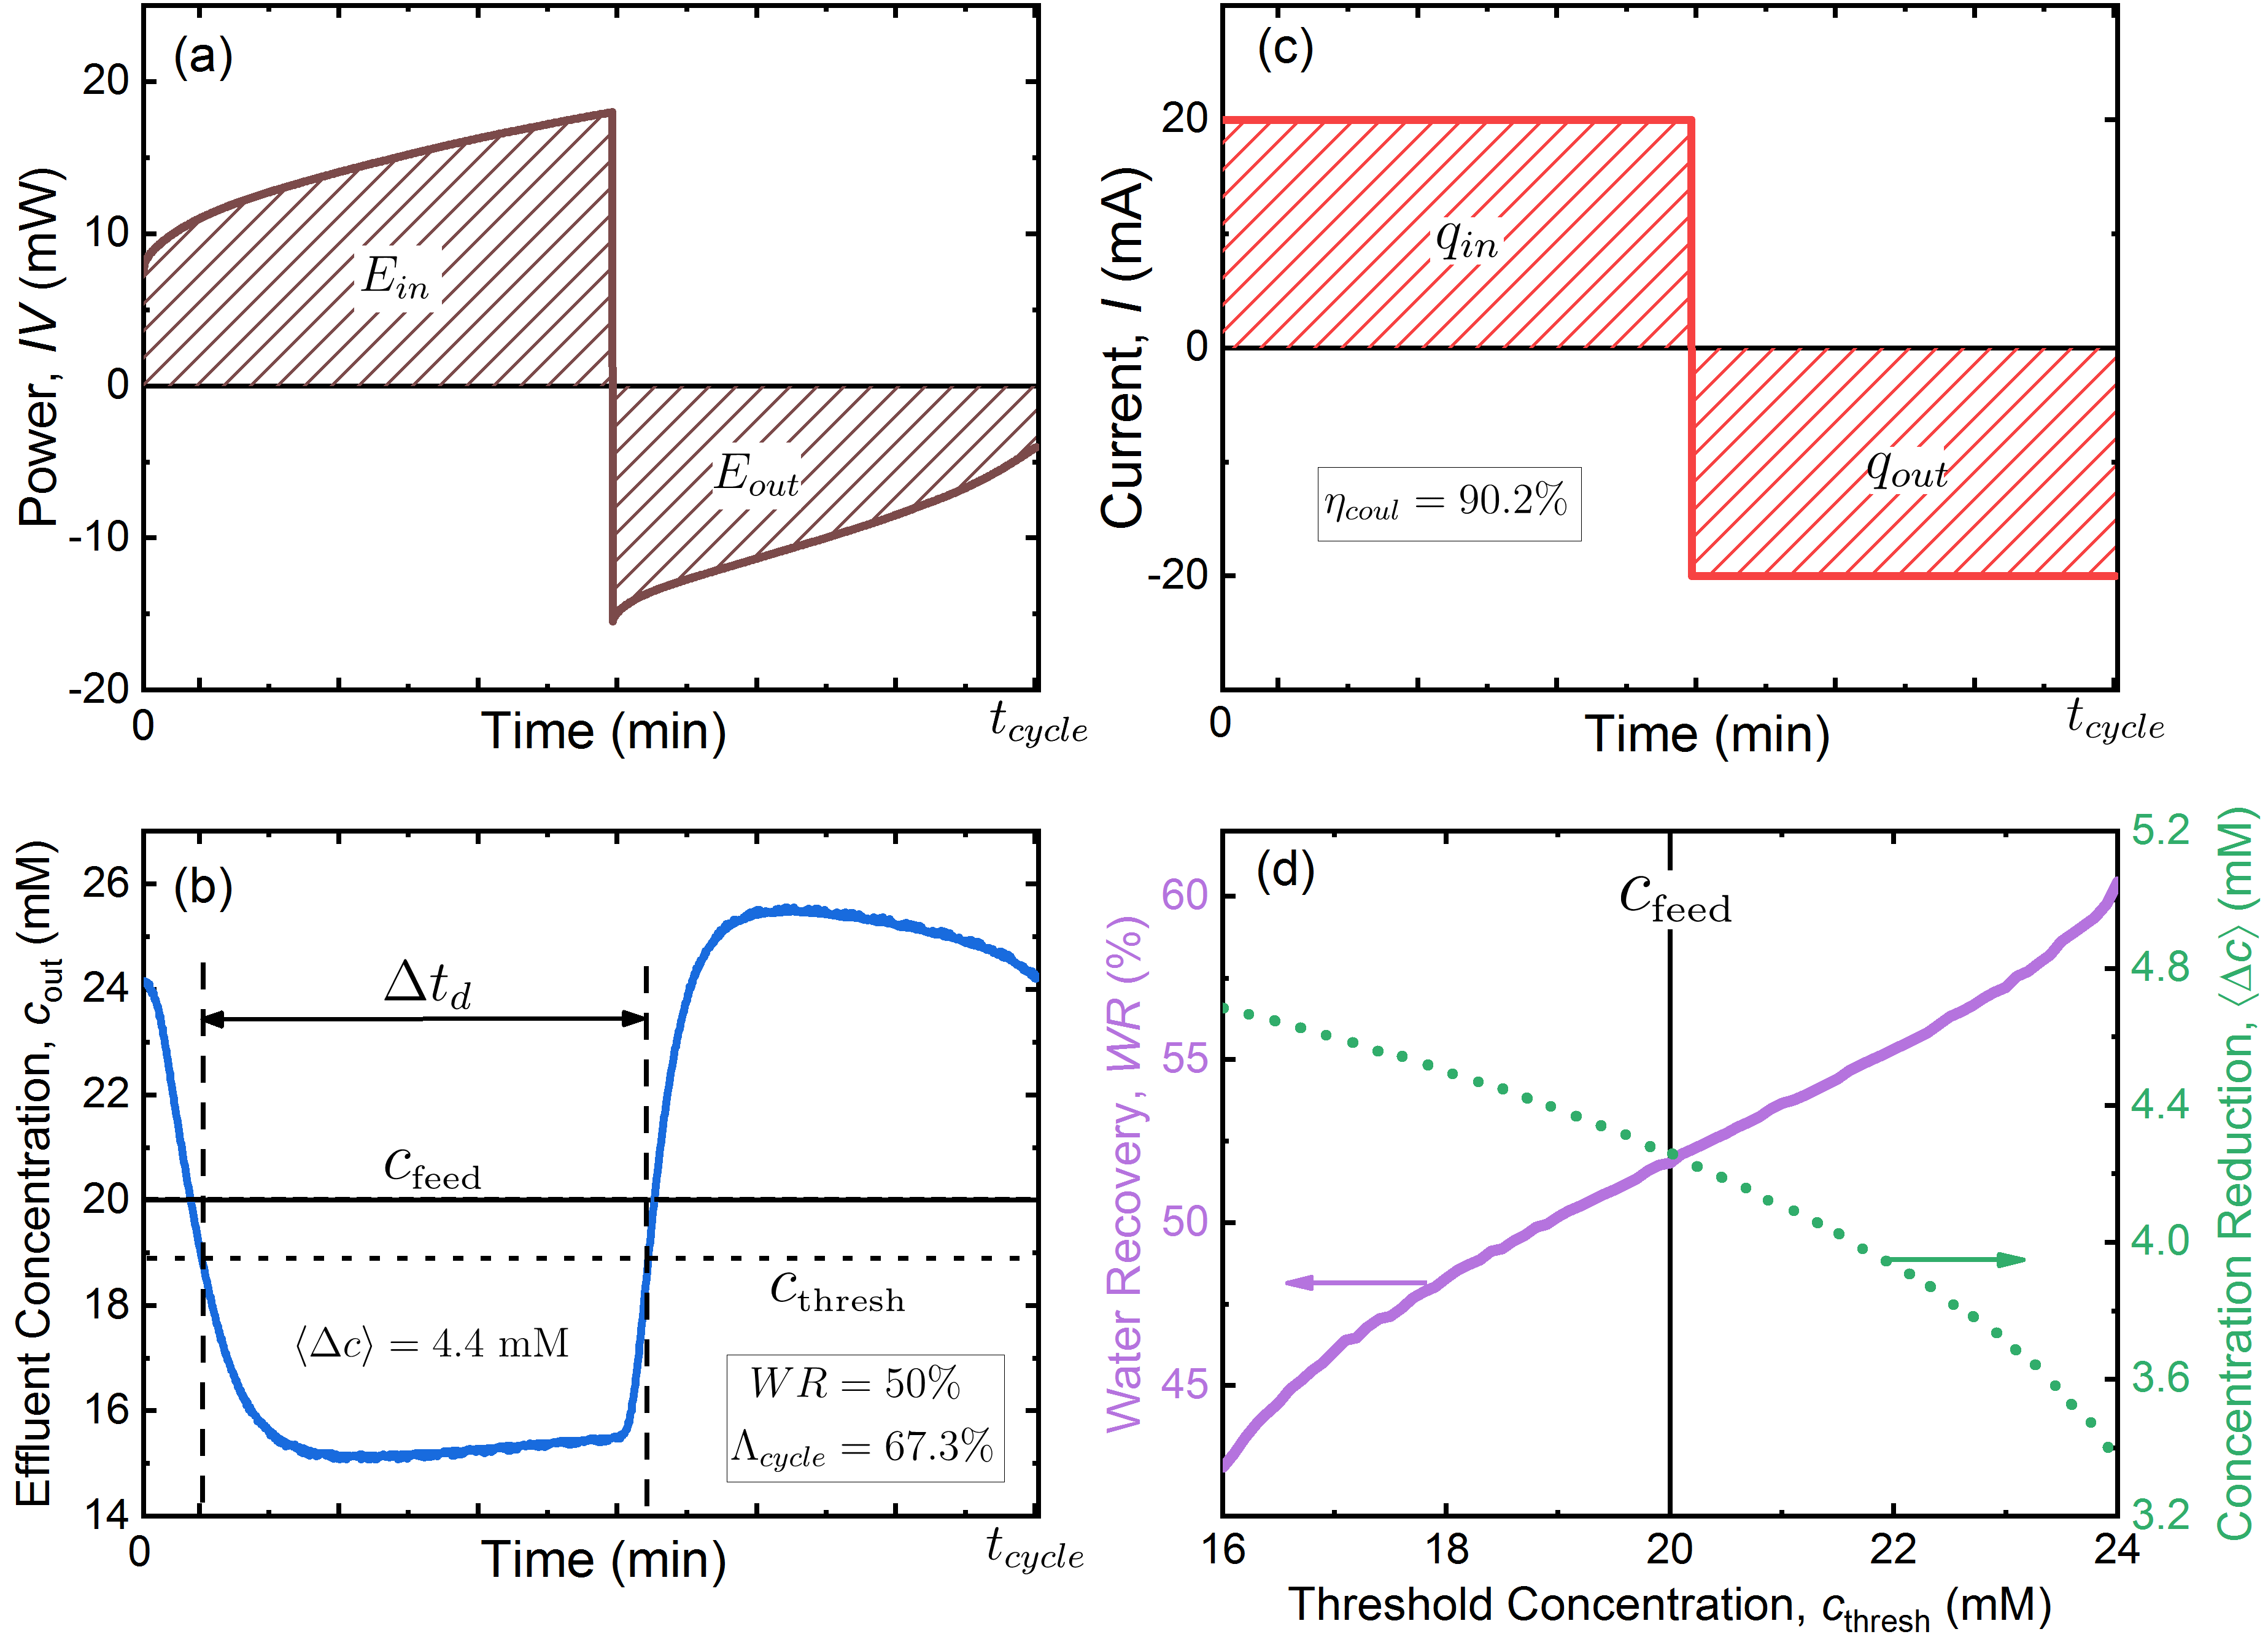
For comparing CDI research results, we propose the following example separation condition as a nominal case: a feed water of 20 mM NaCl; an average concentration reduction of 5 mM in dynamic steady-state (DSS) cycling operation;Porada et al. (2012); Zhao et al. (2013); Hemmatifar et al. (2016) and a water recovery of 50%. This means that half of the effluent water volume will have an averaged concentration of 15 mM, and the other half will have a concentration of 25 mM. Under these removal conditions, we propose reporting at least the two performance parameters mentioned above: volumetric energy consumption () and throughput productivity ().
For this separation, we propose a feed concentration of 20 mM NaCl because it is in the middle of the salinity range where CDI is expected to industrially relevant.Zhao et al. (2013); Pan et al. (2018); van Limpt and van der Wal (2014) We chose a of 5 mM and a water recovery of 50% because both of these are reasonably attainable in a research lab setting. It would be more relevant to examine a 15 mM removal from a 20 mM feed at a WR of 75% or higher, but this requires significantly more engineering to achieve. Since a reporting standard will only be adopted if its reporting requirements are reasonably attainable, it would be counterproductive to propose removal conditions that are too difficult to meet. However, too small of a concentration reduction pertains more to salt adsorption performance than to desalination performance, which overestimates the suitability of the device for water treatment purposes. Thus, we propose a 5 mM removal here as a reasonable compromise between achievability and relevance to desalination.
In order to obtain and at WR %, one can analyze the concentration vs. time data with respect to a concentration threshold (), below which water is considered to be collected as diluate and above which water is considered to be collected as concentrate (Fig. 3b). In Fig. 3 we show example data for constant flow rate constant current (CC) operation with a flow-through electrode (fte-CDI) device similar to that described in Ref. 16 (see Table S2 in the supporting information (SI) for cell particulars). Not shown as example data but still analyzed for comparison is a flow between membrane CDI (fb-MCDI) device (see Table S3 in the SI for cell particulars). The typical choice of threshold concentration (if one is used) is the feed concentration (); however, this is arbitrary. Fig. 3b and 3d illustrate how choosing a different threshold concentration alters the time over which diluate is collected within a DSS cycle and subsequently how and trade off against each other. An example numerical approach for analyzing data like that in Fig. 3 along with a calculation spreadsheet written in generally available commercial software (Microsoft Excel) are provided in the SI.

In terms of measuring and for a given , one can extract values at the relevant concentration reduction by sweeping through an operational variable, plotting vs. and vs. , and linearly interpolating at the of interest (Fig. 4). Curves of this type for the fte-CDI cell in Fig. 4a,b were generated by varying the flow rate (1-5 ml/min) and holding a constant charging/discharging current (0.89 mA/cm2) and voltage window (0.2-0.9 V). Similarly, for the fb-MCDI device in Fig. 4c,d, such data was generated by varying the magnitude of the charging/discharging current (0.74-1.85 mA/cm2) and holding a constant flow rate (3.75 ml/min per cell), discharge voltage (0 V), and charging time (3 min). The upper charging voltage was not controlled within the voltage window of 0.0-1.4 V. These example experimental sweeps give a range of performance and values (see SI Fig. S3, Fig. S4, and Fig. 3 for raw data). In this way, the 5 mM removal condition, for instance, can be readily estimated from a linear interpolation of the results. Note that we do not advocate for performance extrapolation, and interpolation should be conducted with reasonable data spacing.
Notably, the energy consumption data in Fig. 4 assumes perfect capacitive energy recovery and reuse from the discharge, which is an idealized case. Due to the capacitive nature of CDI, a portion of the energy put into the desalination process is recoverable during the discharge; however, a real circuit that drives CDI devices will not transfer energy perfectly, but only recover a fraction () of the total recoverable energy added to the CDI cell during desalination. Importantly, CDI measurements in the lab virtually always measure the total recoverable energy, as opposed to actually use it to power another CDI device or the same device at a later time. Thus, in general, it is important to note energy consumption values assuming no energy recovery so to know the range of expected values if a real circuit was used. For Fig. 4a,b, the 5 mM removal with no energy recovery () consumes 150 Wh/m3, or about 2.6 more energy per volume of diluate than with perfect energy recovery and reuse.
As noted above, another benefit of using our proposed separation conditions and metrics is that energy consumption can be readily compared to thermodynamic calculations. For instance, calculating the specific Gibbs free energy of separation as defined in Wang et al.Wang et al. (2018) for the 5 mM removal in Fig. 4b reveals that the thermodynamic minimum is 2.8% of the measured value of 58 Wh/m3. In the same vein, the fb-MCDI cell in Fig. 4d has a thermodynamic efficiency of 4.1% as well as a larger productivity for the same separation (see SI Section 3 for full details of calculation and Fig. S6 and Fig. S7 for data).Długołecki and Van Der Wal (2013); Hemmatifar et al. (2018) This analysis gives context to the energy consumption values in terms of how much more efficient a separation could be if ideally carried out. Of course, even when such efficiencies are compared for equal separations (as in Fig. 4), one must also weigh them against productivity to capture the full performance picture.
In terms of device comparisons, Fig. 4 provides an example for how to objectively compare different desalination systems (e.g., here CC fte-CDI in (a,b) vs. CC fb-MCDI in (c,d)). As expected, for identical mM, mM, %, separations, the MCDI system shows significantly enhanced performance when compared to the membrane free fte-CDI system. Specifically, the fb-MCDI device consumes 69% of the energy at 1.38 the productivity when compared to a fte-CDI cell. Importantly, such performance gains must be weighted against the additional cost that accompanies the use of membranes. In the next section we expand upon Fig. 4 by further varying operation conditions to achieve multiple performance points (, ) at identical mM, mM, %, separations. In this way, a more comprehensive picture of performance space can be obtained.
2.2 Performance Tradeoffs
For a more complete understanding of performance space, one can generate traces like those in Fig. 4 over several operational variables of interest (e.g., voltage window, charging time, charging current, flow rate, etc.) and then plot vs. for identical separations. In this vein, Fig. 5 shows experimental results for the fte-CDI and fb-MCDI devices discussed above. Fig. 5 further reveals the range of performance that can be expected when using control circuits that have perfect energy recovery and reuse () and no energy recovery or reuse (). The CC operation data in Fig. 5 for the fte-CDI device was generated by varying the flow rate and charging current and holding the voltage window constant, while the data for fb-MCDI device was obtained by varying flow rate and charging/discharging current and holding the charging time constant.
The relationship between and for the CC operation observed in Fig. 5 agrees well with the model predictions of Fig. 2b, all showing a clear linear tradeoff between throughput and energy consumption. The difference in performance between CC fte-CDI and CC fb-MDCI is further elucidated in Fig. 5, but again must be weighted against the additional cost that accompanies the use of membranes. The larger difference in energy consumption between for the fte-CDI cell vs. the fb-MCDI cell implies that the fte-CDI system is storing a higher amount of the total energy put into the desalination cycle when compared to the fb-MCDI cell, likely due to the lower series resistance (see SI Tables S2 and S3).

In terms of understanding how well an electrode material, device, or operation mode performs, one can compare productivity at equivalent energy consumption to assess the relative required system size at a similar operating cost. For example, in Fig. 5 with , the fb-MCDI device has 3 more throughput than the fte-CDI cell at equivalent energy consumption (56 Wh/m3), implying that the fte-CDI cell must be at least roughly 3 less expensive than the fb-MCDI device to be competitive. Alternatively, one can compare energy consumption at equivalent productivity to get a sense of the difference in operating cost for a similar system size. Overall, these comparisons highlight how the performance framework introduced herein enables a detail-independent assessment of the CDI system’s capabilities in terms of its economically relevant deionization performance.
3 Definitions
In this section, we mathematically define how to calculate the proposed performance metrics. Importantly, all analyses are intended for cyclic data taken over a full dynamic-steady state (DSS)Porada et al. (2012); Zhao et al. (2013); Hemmatifar et al. (2016) charge/discharge cycle. To supplement these performance values, it is also important to publish the raw effluent concentration or conductivity vs. time data and the relevant current/voltage vs. time data for a DSS cycle (e.g., Fig. S3 in the supporting information). In our case, DSS is typically achieved on the third or fourth identical cycle of a given operation condition. Observing that the effluent conductivity begins and ends at the same value is a simple method for checking that DSS has been achieved. We also discuss below how these definitions must be modified for systems with flowable electrodes operating continuously rather than cyclically. Note that here and throughout the paper unit conversions are implied.
3.0.1 Water Recovery
For the water recovery (Fig. 1), we define
| (1) | ||||
| (2) | ||||
| (3) |
where is the volumetric flow rate through the cell, is the volume of desalinated water (diluate) collected that, when mixed, has a lower salinity relative to the feed stream, is the volume of “brine” water (concentrate) collected that, when mixed, is enriched in salt relative to the feed stream, is the time over which the desalinated water is collected, is the time over which the concentrate stream is collected, and is the water recovery (%). The typical choice of is everywhere where the effluent conductivity is less than the feed conductivity (Fig. 3b); however, the user is in fact free to choose the region over a DSS cycle arbitrarily so long as final average salinity is lower than the feed. In our definition, the total volume of fluid flowed over the DSS cycle is .
3.0.2 Concentration Reduction
The salt removed from the effluent stream and the average concentration reduction can be calculated from
| (4) | ||||
| (5) | ||||
| (6) |
where is the salt removed over one cycle relative to the feed stream as measured from the effluent (moles), is the salt added to the concentrate stream over one cycle as measured by the effluent (moles), is the effluent salt concentration (mM), and is the average concentration reduction (mM). is maximum for the choice of such that , and will go down if a smaller portion of more strongly desalinated water is kept to enhance concentration reduction, or if a portion of the concentrate is used to enhance water recovery (Fig. 3d).
3.0.3 Energy Consumption
For volumetric energy consumption per cell () of Fig. 1, we propose
| (7) | ||||
| (8) | ||||
| (9) | ||||
| (10) |
where is the current-voltage product for a single electrode pair (W), is the total DSS cycle time (min), is the total energy input during the DSS cycle (J), is the total recoverable energy from the cell over the DSS cycle (J), is the volumetric energy consumption (Wh/m3), the molar energy consumption (kJ/mol), and is the fraction of actually recovered and reused to power another charging phase. Thus, if perfect energy recovery is assumed as in Fig. 4, then implicitly . Examples of practical values of can be found in the literature.Landon et al. (2013); Kang et al. (2016); Pernia et al. (2014); Pernía et al. (2012) Since real-world energy transfer circuits (e.g., buck-boost converters) are not perfectly efficient, it is important to report for at least two values of (e.g., 0 and 1). If there are multiple devices in series or parallel, then , , and in the Eqn. (9) must be summed appropriately. A graphical example of , , and for the cell examined herein is shown in Fig. 3a. If the pumping energy is significant compared to the desalination energy , then this number should be reported as well. The pumping energy for a CDI cycle can be calculated as (Wh/m3) where is the pressure drop across the cell (psi) and the integral is over a cycle. For the data in Fig. 4a and 4b, the pumping energy is at worst 4 lower than the desalination energy (5 Wh/m3), making it safe to assume that it is negligible.
3.0.4 Productivity
For throughput we use the term productivity (Fig. 1),Pan et al. (2017) which is given by
| (11) |
where is the productivity in L/h/m2, is the number of cells (electrode pairs) in the CDI stack (series and parallel), and is the projected face area (cm2) of one cell as discussed above and illustrated in Fig. S2 in the SI. The productivity is simply a volume of diluate produced per unit time per projected face area of device. Since the separation condition (i.e., , , and ) is already specified, there is only a need to specify volume throughput and not an average removal rate like with ASAR. Normalizing by projected face area rather than electrode mass is more directly related to cell resistance and cost when membranes are used. Similarly, volume throughput for a given separation is more closely tied to general desalination performance as opposed to salt removal rate,Ghaffour et al. (2013); Zhao et al. (2013) which is more specific to CDI-type desalination techniques.
3.0.5 Performance Metric Relationships
Finally, it is important to understand the defined relationships between traditional performance metrics—what we call here secondary performance metrics—and those detailed above. For instance, recalling that the previous performance metrics ASAR and ENAS as defined in Ref. 16 are
| (12) | ||||
| (13) |
then comparing Eqns. (12) and (13) to Eqns. (6) and (9-11) reveals that
| (14) | ||||
| (15) | ||||
| (16) |
Furthermore, combining Eqns. (14) and (15) gives
| (17) |
Thus, with specified, the volumetric metrics proposed here can be converted to the traditional molar parameters and vice versa. Note that here and throughout the paper unit conversions are implied.
The exercise of examining how various performance metrics in the CDI literature are related by definition is important, because it reveals where metric comparisons do not necessarily give additional insight (only relations by definition). Ultimately, we chose to advocate for the two parameters and because they reflect generally desirable desalination characteristics for any system, regardless of its operating mechanism. We do not advocate using molar-based metrics because the end product of deionization is a volume of treated water, not a mole of salt, which makes volume-normalized quantities of a more broad interest. Interestingly, though, ENAS by definition is , which gives a sense of how efficiently a given is achieved; however, this number must be analyzed extremely carefully because the best values can often occur in a region of separation space that is irrelevant to practical applications (i.e., low ). Thus, various normalized analysis of desalination performance that deviates from the Fig. 1 framework must be conducted with caution.
3.0.6 Non-DSS Operation
While DSS cycling is the dominant mode of operation for CDI, there are other operation modes like batch-mode and flow-electrode setups that require a different approach to calculating the various parameters described above. In general, though, the approach depicted in Fig. 1 holds regardless of operation method.
For systems with flowable electrodes,Doornbusch et al. (2016) the definitions Eqns. (1)-(11) still hold by replacing the specified integration time with the total experiment time. For batch mode operation,Porada et al. (2013) the individual quantities and , , , along with system size and experiment time can be used to directly compute the values of Fig. 1. In essence, the equations above for DSS operation can be adapted straightforwardly to give values that faithfully reflect those of Fig. 1.
4 Performance Indicators
In this section, we will discuss parameters which we believe are highly useful for understanding cell performance and material limitations, but are not performance metrics in and of themselves. These parameters combined with the reported operational performance metrics above can help better understand why certain materials, device architectures, and operation modes are more suitable for CDI, or in contrast, are less suitable. If the primary goal of the study is to evaluate a novel electrode material, then such extra characterization is especially critical. Importantly, the following descriptions are not meant to be comprehensive technical reviews, but rather are included to lend context to the CDI performance metric/indicator landscape.
4.1 Salt Adsorption Capacity
We begin our performance indicator discussion with the salt adsorption capacity (mg/g), which for a CDI cell over a DSS cycle is given by
| (18) |
where is the molar mass of the salt (g/mol), is the total mass of electrodes in the cell (g). The SAC is a function of operational flow efficiency (defined below and in Ref. 16) and magnitude of adsorbed salt over a DSS cycle.Hawks et al. (2018) This is in contrast to the maximum salt adsorption capacity (mSAC) or identically equilibrium salt adsorption capacity (Eq-SAC), which are taken at constant-voltage equilibrium. The Eq-SAC value is best measured over many charging voltages to at least V (with the discharge voltage typically set to zero), a salinity of 20 mM, and using NaCl so that experiments can be compared between different studies.Guyes et al. (2017); Suss et al. (2015). Notably, if the electrode material density is reported (), then different Eq-SAC normalizations (e.g. mg/ml or mol/ml) can be readily evaluated.
The strength of Eq-SAC is that it is an indicator of the upper limit of desalination capacity over a given voltage window, where higher values typically correspond to larger obtainable removals during operation (i.e., higher possible concentration reductions and water recoveries). However, Eq-SAC is not a desalination performance metric in and of itself, and therefore cannot be used as a substitute for energy consumption and throughput. Eq-SAC is influenced by a combination parameters, including: equilibrium charge efficiency, charging and discharging voltages, point of zero charge (PZC), and material capacitance.
4.2 Capacitance and PZC
The capacitance and PZC are important factors that underly SAC, and therefore also strongly impact the desalination capacity of a cell. A discussion of capacitance characterization for electrochemical supercapacitors is given by Zuliani et al.Zuliani et al. (2015), and analysis of the material point of zero charge (PZC) and its influence on CDI performance can be found in Refs. 46; 47; 48; 49; 50; 51.
In brief, though, the cell’s differential capacitance can be evaluated through the use of the equation
| (19) |
where is the cell voltage (V), is the current (A), and is the capacitance (F), which can be converted to material capacitance (F/g or F/cm3) by considering the electrodes in a CDI cell as two capacitors in series.Zuliani et al. (2015) In terms of normalization,Zuliani et al. (2015); Gogotsi and Simon (2011) the electrode volumetric capacitance in F/cm3 is more relevant to CDI operation,Hawks et al. (2018) but the gravimetric capacitance in F/g has better comparability to electrochemical capacitors at large; thus, assessing both is important. Similar to SAC, if the electrode material density is reported, then the volumetric and gravimetric capacitance values can be calculated from one another. Eqn. (19) suffices for capacitance assessment of both supercapacitors and pseudocapacitors;Brousse et al. (2015) however, it may not be the best way to characterize intercalation storage mechanisms, which are an emerging area of interest in CDI.Porada et al. (2017); Kim et al. (2017); Suss and Presser (2018) In the case of charge storage by intercalation, electrode capacity in mAh/cm3 and mAh/g and voltage window are perhaps more appropriate.
In contrast to energy-storage studies, the relevant material capacitance can be difficult to evaluate due to the low electrolyte concentrations pertinent to CDI operation (e.g., 20 mM NaCl). At these low concentrations, significant PZC, depletion, resistive, and Faradaic effects can obscure the capacitance evaluation by Eqn. (19). We find that in CC operation, for example, the discharge portion of the desalination cycle can often provide a somewhat reasonable estimation of through Eqn. (19). This analysis is identical to evaluating the capacitance by the method of galvanostatic cycling, which is a common approach for capacitance evaluation.Zuliani et al. (2015) Another way to measure capacitance is with cyclic voltammetry (CV) taken at concentrations and (multiple) sweep rates that are comparable to the ones used for desalination. For such a CV measurement, the electrode material PZC can be estimated from the voltage at which the capacitance from Eqn. (19) passes through a local minimum. For purely comparative purposes, the differential capacitance can be taken as the value of at (, see SI Fig. S9). An illustration of these effects and CV analysis are presented in the SI Fig. S9, including for the cell from Figs. 3 and 4 (Fig. S1). If the CV is measured in a CDI cell, then it can be done with sufficient flow rate such that depletion effects are avoided. It is important that the CV is measured both over enough cycles such that DSS is reached and at relevant concentrations since double-layer capacitance scales non-linearly with electrolyte concentration in the low ionic strength regime that is relevant to CDI.
Other ways to measure the capacitance are by the galvanometric intermittent titration technique (GITT) or amperometric intermittent titration technique (AITT), which involve transferring a precise quantity of charge and measuring the change in voltage, or changing the cell voltage and measuring the charge transferred, respectively. These methods have been routinely applied in CDI for carbon-based materials,Zhao et al. (2010); Porada et al. (2012); Porada et al. (2013); Porada et al. (2013) as well as recently applied for CDI with intercalation materials.Porada et al. (2017) Compared to CV, GITT may be more applicable to intercalation materials,Porada et al. (2017) and AITT might be more practical at low salinities (e.g., 5 mM NaCl).Porada et al. (2012); Guyes et al. (2017); Kim et al. (2015)
4.3 Charge and Coulombic Efficiencies
A further set of relevant performance indicators are the charge efficiency and Coulombic efficiency, which have been the subject of much research in CDI.Shanbhag et al. (2016); Zhao et al. (2012); Zhao et al. (2010); Avraham et al. (2009); Avraham et al. (2010); Gao et al. (2014); Kim et al. (2015); Hemmatifar et al. (2016) In terms of DSS cycling, the charge transferred, total cycle charge efficiency , and round-trip Coulombic efficiency Smith et al. (2014); Shanbhag et al. (2016) are defined here by
| (20) | ||||
| (21) | ||||
| (22) | ||||
| (23) |
where is the charge transferred at positive current (C), is the charge transferred at negative current (C), and is Faraday’s constant (96485 C/mol). Of the two periods of opposing current direction in Eqns. (19) and (20), we define positive current to be the “charging step”, which is that period where the energy input was higher than in the period of opposing current sign. Alternatively, if the voltage polarity does not change and one assumes charge conservation over a DSS cycle, then the charge transferred to the cell must not be greater than the charge released from the cell, or . From this, the definition of positive current in Eqn. (19) also follows. A graphical example of and for the cell examined herein is shown in Fig. 3c.
It should also be noted that there is some ambiguity in the literature regarding the use of or in Eqn. (22). For instance, as defined here was referred to as the “dynamic charge efficiency” in Refs. 16 and 18, but in Ref. 55 the “charge efficiency” was taken as . The replacement of with in Eqn. (22) can be done to partly factor out Coulombic losses in the total cycle charge efficiency. While the true capacitive charge transferred over a cycle lies somewhere between and , using the charge released is a reasonable approach as the capacitive charge transferred is generally expected to be closer to .
In general, these efficiencies reflect the disparity between transferred electrical charge on one hand and salt deficiency or excess in the effluent stream on the other. In typical unfunctionalized carbon-based electrodes, there are broadly three main reasons behind such disparities. First, at low potentials across the electric double layers, co-ion expulsion occurs to a significant extent compared to counterion adsorption, leading to inefficient net adsorption. Second, unwanted parasitic reactions can consume accumulated electric charge via Faradaic reactions at one or more electrodes. And finally, a portion of the desalinated water inside the cell is often not recoverable due to operational effects.Hawks et al. (2018); Shang et al. (2017) Such effects are captured by the flow efficiency parameter,Hawks et al. (2018); Johnson and Newman (1971) which is defined as the ratio of moles of salt removed from the effluent stream to the moles of salt adsorbed by the electrodes over a DSS cycle.Hawks et al. (2018) Overall, the total cycle charge efficiency is influenced by flow efficiency, double layer, and Faradaic effects,Hawks et al. (2018) and the round-trip Coulombic efficiency of Eqn. (23) measures charge loss due to Faradaic processes.Bazant (2013); Pillay and Newman (1996); Shanbhag et al. (2016) Taken together, a full analysis of Eqns. (22) and (23) can yield significant insight as to where operational performance losses are being incurred.
4.4 Series Resistance
Finally, since CDI cells are high-current low-voltage devices, the series resistance is an important parameter that can help understand performance.Qu et al. (2015); Qu et al. (2016); Dykstra et al. (2016) Energy loss in CDI occurs via primarily two processes: energy dissipation through Joule heating by current through the resistive elements in the system, and unwanted Faradaic reactions. The resistive elements can be categorized as a series resistance and an ionic resistance within the electrode pores. This series resistance includes external leads, contact resistances at current collectors, collector resistance (often negligible), and ionic resistance within the separator. The impedance across the electrode thickness can be thought of as a distributed series/parallel arrangement of ionic resistances, capacitive surfaces, and electronic resistance of the electrode material (i.e., a transmission line).Posey and Morozumi (1966); Dunn and Newman (2000); de Levie (1964) While the series resistance clearly affects energy consumption,Qu et al. (2016); Hemmatifar et al. (2016) it also influences operational performance through, for example, the charging time in CV operation and voltage window in CC operation.
Here we define the total series resistance () as the external electronic resistance plus the separator resistance (i.e., ).Dykstra et al. (2016) In other words, the series resistance is the resistance of every part of the system except the resistance in the porous electrodes. The external electronic resistance includes the resistance due to the current collector, wires, and contacts,Qu et al. (2015); Dykstra et al. (2016) whereas the separator resistance captures the ionic resistance across the separator according to
| (24) |
where is the separator thickness (m), is the separator tortuosity, is the electrolyte conductivity in the separator (mS/cm), and is the separator porosity. There is also a significant ionic transport resistance associated with the electrolyte in the macropores; however, this resistance is strongly frequency dependent, being an electrical short at high frequency that ideally transitions to a capacitance in series with the electrolyte resistance at low frequency.Suss et al. (2013); Posey and Morozumi (1966); Dunn and Newman (2000); de Levie (1964)
| Category | Symbol | Typical Unit | Definition |
| Separation Condition | mM | Average concentration reduction of the feed over a cycle. | |
| mM | Salt concentration of the feed stream. | ||
| % | The ratio of diluate volume to total volume of water flowed over a cycle. | ||
| Primary Performance Metric | Wh/m3 or Wh/m3 | Volumetric energy consumption reported for multiple energy recoveries . | |
| L/h/m2 | The volume of diluate per total cycle time per cell face area. | ||
| Secondary Performance Metric | kJ/mol | Molar energy consumption. | |
| mol/J | Energy normalized adsorbed salt. | ||
| mol/min/cm2 | Average salt adsorption rate per cell face area. | ||
| Performance Indicator | F, F/cm3, F/g | Cell and material capacitance with measurement method and salinity noted. | |
| % | Total cycle charge efficiency. | ||
| % | Coulombic efficiency of a cycle. | ||
| cm2 | Series resistance, the sum of the external electronic resistance and the separator resistance . | ||
| Cell Characteristic | – | Number of cells used in the separation. | |
| – | Number of membranes used per cell. | ||
| cm2 | Projected face area of a CDI cell (i.e., face area over which electrodes overlap). | ||
| m | Electrode thickness. | ||
| m | Separator thickness. | ||
| g | Total mass of electrodes. | ||
| g/cm3 | Electrode mass density. |
In terms of experiments, the series resistance in particular can be readily measured with electrochemical impedance spectroscopy (EIS) at high frequency (e.g., 10-100 kHz) by taking the value of the real part of the impedance as the imaginary part tends to zero (see SI Fig. S10 and S11). It is important to note that high frequency EIS measurements are capable of measuring the true , whereas methods based on applying an abrupt current or voltage step and measuring the instantaneous response often captures a significant amount of electrode ionic resistance (unless high time-resolution equipment is used). Because Eqn. (24) is dependent on ion concentration, will change dynamically throughout a CDI cycle due to changes in electrolyte conductivity from desalination and regeneration.Hemmatifar et al. (2016) Nevertheless, EIS measurements are useful for establishing a baseline for comparing different device architectures and better understanding differences in performance. Examples and illustrations of how to measure with EIS are presented in Section 6 of the SI.
5 Parameter Summary
A summary of the essential separation conditions, performance metrics, and performance indicators that are discussed above are presented in Table 1. In the SI, a table is given defining all parameters used in this work, including those in Table 1. We also add to Table S2 and S3 several essential cell characteristics that are highly valuable in interpreting desalination results. For example, the dry electrode material density is a critical electrode property that allows for conversion between
gravimetric and volumetric parameters. Additionally, the number of membranes used per cell is important for estimating the overall device cost, as the membranes are typically a cost-driving factor for the devices that use them. Finally, general device geometric parameters like the electrode and separator thickness (dry, uncompressed) are important basic cell characteristics that influence the magnitude of many of the discussed parameters. The parameters in Table 1 for the cell that underlies the results in Fig. 4 along with other important cell characteristics are summarized in a separation report in the SI Table S2. For convenience, we also provide this report format in the form of a calculation spreadsheet written in generally available commercial software (Microsoft Excel) that can be downloaded and readily used for other studies.
6 Conclusions
In conclusion, we proposed a framework for quantifying CDI performance in terms of volumetric energy consumption (Wh/m3) and throughput productivity (L/h/m2). We demonstrated that reporting these metrics for equivalent separation conditions is essential for comparability and obtaining practically meaningful values. For research purposes, we proposed a nominal standard removal of 5 mM out of a 20 mM NaCl feed stream at 50% water recovery for comparing new materials, devices, and operation modes. Using this separation, we compare performance between a fte-CDI cell and fb-MCDI cell, showing how significantly different systems can be compared in terms of generic desalination performance. The need for introducing such a framework arises from previously used metrics being reported without specifying the removal conditions (concentration reduction, feed concentration, and water recovery). In general, metric normalization must be carefully considered so to not allow evaluation at unspecified removal. The rationale presented here resolves this issue and better aligns CDI performance reporting with the field of desalination in general. Finally, for context, we discuss various cell characteristics and performance indicators that are highly useful for understanding why certain performance metrics were measured. Taken together, this work helps drive CDI in a direction towards more comparable and relevant performance evaluations so that this technology can realize its full potential.
References
- Biesheuvel et al. (2017) Biesheuvel, P. M.; Bazant, M. Z.; Cusick, R. D.; Hatton, T. A.; Hatzell, K. B.; Hatzell, M. C.; Liang, P.; Lin, S.; Porada, S.; Santiago, J. G. et al. Capacitive Deionization – defining a class of desalination technologies. arXiv 2017, 1–3.
- Zhang et al. (2018) Zhang, C.; He, D.; Ma, J.; Tang, W.; Waite, T. D. Faradaic reactions in capacitive deionization (CDI) - problems and possibilities: A review. Water Res. 2018, 128, 314–330.
- Balducci et al. (2017) Balducci, A.; Belanger, D.; Brousse, T.; Long, J. W.; Sugimoto, W. Perspective—A Guideline for Reporting Performance Metrics with Electrochemical Capacitors: From Electrode Materials to Full Devices. J. Electrochem. Soc. 2017, 164, A1487–A1488.
- Khenkin et al. (2018) Khenkin, M. V.; K. M., A.; Visoly-Fisher, I.; Galagan, Y.; Di Giacomo, F.; Patil, B. R.; Sherafatipour, G.; Turkovic, V.; Rubahn, H.-G.; Madsen, M. et al. Reconsidering figures of merit for performance and stability of perovskite photovoltaics. Energy Environ. Sci. 2018,
- Gogotsi and Simon (2011) Gogotsi, Y.; Simon, P. True Performance Metrics in Electrochemical Energy Storage. Science 2011, 334, 917–918.
- Brousse et al. (2015) Brousse, T.; Belanger, D.; Long, J. W. To Be or Not To Be Pseudocapacitive? J. Electrochem. Soc. 2015, 162, A5185–A5189.
- Editorial (2015) Editorial, A checklist for photovoltaic research. Nat. Mater. 2015, 14, 1073–1073.
- Zuliani et al. (2015) Zuliani, J. E.; Caguiat, J. N.; Kirk, D. W.; Jia, C. Q. Considerations for consistent characterization of electrochemical double-layer capacitor performance. J. Power Sources 2015, 290, 136–143.
- Cohen-Tanugi et al. (2014) Cohen-Tanugi, D.; McGovern, R. K.; Dave, S. H.; Lienhard, J. H.; Grossman, J. C. Quantifying the potential of ultra-permeable membranes for water desalination. Energy Environ. Sci. 2014, 7, 1134–1141.
- Park et al. (2017) Park, H. B.; Kamcev, J.; Robeson, L. M.; Elimelech, M.; Freeman, B. D. Maximizing the right stuff: The trade-off between membrane permeability and selectivity. Science 2017, 356, eaab0530.
- Alvarado and Chen (2014) Alvarado, L.; Chen, A. Electrodeionization: Principles, strategies and applications. Electrochim. Acta 2014, 132, 583–597.
- Pan et al. (2017) Pan, S. Y.; Snyder, S. W.; Ma, H. W.; Lin, Y. J.; Chiang, P. C. Development of a Resin Wafer Electrodeionization Process for Impaired Water Desalination with High Energy Efficiency and Productivity. ACS Sustain. Chem. Eng. 2017, 5, 2942–2948.
- Zhao et al. (2013) Zhao, R.; Satpradit, O.; Rijnaarts, H. H. M.; Biesheuvel, P. M.; van der Wal, A. Optimization of salt adsorption rate in membrane capacitive deionization. Water Res. 2013, 47, 1941–1952.
- Kim and Yoon (2015) Kim, T.; Yoon, J. CDI ragone plot as a functional tool to evaluate desalination performance in capacitive deionization. RSC Adv. 2015, 5, 1456–1461.
- Hemmatifar et al. (2016) Hemmatifar, A.; Palko, J. W.; Stadermann, M.; Santiago, J. G. Energy breakdown in capacitive deionization. Water Res. 2016, 104, 303–311.
- Hawks et al. (2018) Hawks, S. A.; Knipe, J. M.; Campbell, P. G.; Loeb, C. K.; Hubert, M. A.; Santiago, J. G.; Stadermann, M. Quantifying the flow efficiency in constant-current capacitive deionization. Water Res. 2018, 129, 327–336.
- Wang and Lin (2018) Wang, L.; Lin, S. Intrinsic tradeoff between kinetic and energetic efficiencies in membrane capacitive deionization. Water Res. 2018, 129, 394–401.
- Zhao et al. (2012) Zhao, R.; Biesheuvel, P. M.; van der Wal, A. Energy consumption and constant current operation in membrane capacitive deionization. Energy Environ. Sci. 2012, 5, 9520.
- Qu et al. (2016) Qu, Y.; Campbell, P. G.; Gu, L.; Knipe, J. M.; Dzenitis, E.; Santiago, J. G.; Stadermann, M. Energy consumption analysis of constant voltage and constant current operations in capacitive deionization. Desalination 2016, 400, 18–24.
- Suss et al. (2015) Suss, M. E.; Porada, S.; Sun, X.; Biesheuvel, P. M.; Yoon, J.; Presser, V. Water desalination via capacitive deionization: what is it and what can we expect from it? Energy Environ. Sci. 2015, 8, 2296–2319.
- Shang et al. (2017) Shang, X.; Cusick, R. D.; Smith, K. C. A Combined Modeling and Experimental Study Assessing the Impact of Fluid Pulsation on Charge and Energy Efficiency in Capacitive Deionization. J. Electrochem. Soc. 2017, 164, E536–E547.
- Oyarzun et al. (2018) Oyarzun, D. I.; Hemmatifar, A.; Palko, J. W.; Stadermann, M.; Santiago, J. G. Adsorption and capacitive regeneration of nitrate using inverted capacitive deionization with surfactant functionalized carbon electrodes. Sep. Purif. Technol. 2018, 194, 410–415.
- Doornbusch et al. (2016) Doornbusch, G. J.; Dykstra, J. E.; Biesheuvel, P. M.; Suss, M. E. Fluidized bed electrodes with high carbon loading for water desalination by capacitive deionization. J. Mater. Chem. A 2016, 4, 3642–3647.
- Huang et al. (2017) Huang, Z.-H.; Yang, Z.; Kang, F.; Inagaki, M. Carbon electrodes for capacitive deionization. J. Mater. Chem. A 2017, 5, 470–496.
- Mubita et al. (2018) Mubita, T.; Porada, S.; Biesheuvel, P. M.; van der Wal, A.; Dykstra, J. Capacitive deionization with wire-shaped electrodes. Electrochim. Acta 2018, 270, 165–173.
- Qu et al. (2018) Qu, Y.; Campbell, P. G.; Hemmatifar, A.; Knipe, J. M.; Loeb, C. K.; Reidy, J. J.; Hubert, M. A.; Stadermann, M.; Santiago, J. G. Charging and Transport Dynamics of a Flow-Through Electrode Capacitive Deionization System. J. Phys. Chem. B 2018,
- Dykstra et al. (2018) Dykstra, J.; Porada, S.; van der Wal, A.; Biesheuvel, P. M. Energy consumption in capacitive deionization – Constant current versus constant voltage operation. Water Res. 2018,
- García-Quismondo et al. (2016) García-Quismondo, E.; Santos, C.; Soria, J.; Palma, J.; Anderson, M. A. New Operational Modes to Increase Energy Efficiency in Capacitive Deionization Systems. Environ. Sci. Technol. 2016, 50, 6053–6060.
- Pan et al. (2018) Pan, S.-Y.; Snyder, S. W.; Lin, Y. J.; Chiang, P.-C. Electrokinetic desalination of brackish water and associated challenges in the water and energy nexus. Environ. Sci. Water Res. Technol. 2018, 4, 613–638.
- Zhao et al. (2013) Zhao, R.; Porada, S.; Biesheuvel, P. M.; van der Wal, A. Energy consumption in membrane capacitive deionization for different water recoveries and flow rates, and comparison with reverse osmosis. Desalination 2013, 330, 35–41.
- van Limpt and van der Wal (2014) van Limpt, B.; van der Wal, A. Water and chemical savings in cooling towers by using membrane capacitive deionization. Desalination 2014, 342, 148–155.
- Długołecki and Van Der Wal (2013) Długołecki, P.; Van Der Wal, A. Energy recovery in membrane capacitive deionization. Environ. Sci. Technol. 2013, 47, 4904–4910.
- Wang et al. (2018) Wang, L.; Biesheuvel, P. M.; Lin, S. Reversible thermodynamic cycle analysis for capacitive deionization with modified Donnan model. J. Colloid Interface Sci. 2018, 512, 522–528.
- Biesheuvel (2009) Biesheuvel, P. M. Thermodynamic cycle analysis for capacitive deionization. J. Colloid Interface Sci. 2009, 332, 258–264.
- Hemmatifar et al. (2018) Hemmatifar, A.; Ramachandran, A.; Liu, K.; Oyarzun, D. I.; Bazant, M. Z.; Santiago, J. G. Thermodynamics of Ion Separation by Electrosorption. arXiv 2018,
- Ramachandran et al. (2018) Ramachandran, A.; Hemmatifar, A.; Hawks, S.; Stadermann, M.; Santiago, J. Self similarities in desalination dynamics and performance using capacitive deionization. Water Res. 2018, 140.
- Biesheuvel et al. (2014) Biesheuvel, P. M.; Porada, S.; Levi, M.; Bazant, M. Z. Attractive forces in microporous carbon electrodes for capacitive deionization. J. Solid State Electrochem. 2014, 18, 1365–1376.
- Porada et al. (2012) Porada, S.; Weinstein, L.; Dash, R.; van der Wal, A.; Bryjak, M.; Gogotsi, Y.; Biesheuvel, P. M. Water Desalination Using Capacitive Deionization with Microporous Carbon Electrodes. ACS Appl. Mater. Interfaces 2012, 4, 1194–1199.
- Landon et al. (2013) Landon, J.; Gao, X.; Neathery, J. K.; Liu, K. Energy Recovery in Parallel Capacitive Deionization Operations. ECS Trans. 2013, 53, 235–243.
- Kang et al. (2016) Kang, J.; Kim, T.; Shin, H.; Lee, J.; Ha, J. I.; Yoon, J. Direct energy recovery system for membrane capacitive deionization. Desalination 2016, 398, 144–150.
- Pernia et al. (2014) Pernia, A. M.; Alvarez-Gonzalez, F. J.; Prieto, M. A. J.; Villegas, P. J.; Nuno, F. New Control Strategy of an Up–Down Converter for Energy Recovery in a CDI Desalination System. IEEE Trans. Power Electron. 2014, 29, 3573–3581.
- Pernía et al. (2012) Pernía, A. M.; Norniella, J. G.; Martín-Ramos, J. A.; Díaz, J.; Martínez, J. A. Up–Down Converter for Energy Recovery in a CDI Desalination System. IEEE Trans. Power Electron. 2012, 27, 3257–3265.
- Ghaffour et al. (2013) Ghaffour, N.; Missimer, T. M.; Amy, G. L. Technical review and evaluation of the economics of water desalination: Current and future challenges for better water supply sustainability. Desalination 2013, 309, 197–207.
- Porada et al. (2013) Porada, S.; Zhao, R.; van der Wal, A.; Presser, V.; Biesheuvel, P. M. Review on the science and technology of water desalination by capacitive deionization. Prog. Mater. Sci. 2013, 58, 1388–1442.
- Guyes et al. (2017) Guyes, E. N.; Shocron, A. N.; Simanovski, A.; Biesheuvel, P. M.; Suss, M. E. A one-dimensional model for water desalination by flow-through electrode capacitive deionization. Desalination 2017, 415, 8–13.
- Avraham et al. (2011) Avraham, E.; Noked, M.; Cohen, I.; Soffer, A.; Aurbach, D. The Dependence of the Desalination Performance in Capacitive Deionization Processes on the Electrodes PZC. J. Electrochem. Soc. 2011, 158, P168.
- Gao et al. (2015) Gao, X.; Omosebi, A.; Landon, J.; Liu, K. Surface charge enhanced carbon electrodes for stable and efficient capacitive deionization using inverted adsorption–desorption behavior. Energy Environ. Sci. 2015, 8, 897.
- Gao et al. (2018) Gao, X.; Omosebi, A.; Landon, J.; Liu, K. Voltage-Based Stabilization of Microporous Carbon Electrodes for Inverted Capacitive Deionization. J. Phys. Chem. C 2018, 122, 1158–1168.
- Omosebi et al. (2015) Omosebi, A.; Gao, X.; Rentschler, J.; Landon, J.; Liu, K. Continuous operation of membrane capacitive deionization cells assembled with dissimilar potential of zero charge electrode pairs. J. Colloid Interface Sci. 2015, 446, 345–351.
- Omosebi et al. (2014) Omosebi, A.; Gao, X.; Landon, J.; Liu, K. Asymmetric Electrode Configuration for Enhanced Membrane Capacitive Deionization. ACS Appl. Mater. Interfaces 2014, 6, 12640–12649.
- Hemmatifar et al. (2017) Hemmatifar, A.; Oyarzun, D. I.; Palko, J. W.; Hawks, S. A.; Stadermann, M.; Santiago, J. G. Equilibria model for pH variations and ion adsorption in capacitive deionization electrodes. Water Res. 2017, 122, 387–397.
- Porada et al. (2017) Porada, S.; Shrivastava, A.; Bukowska, P.; Biesheuvel, P.; Smith, K. C. Nickel Hexacyanoferrate Electrodes for Continuous Cation Intercalation Desalination of Brackish Water. Electrochim. Acta 2017, 255, 369–378.
- Kim et al. (2017) Kim, T.; Gorski, C. A.; Logan, B. E. Low Energy Desalination Using Battery Electrode Deionization. Environ. Sci. Technol. Lett. 2017, 4, 444–449.
- Suss and Presser (2018) Suss, M. E.; Presser, V. Water Desalination with Energy Storage Electrode Materials. Joule 2018, 2, 10–15.
- Zhao et al. (2010) Zhao, R.; Biesheuvel, P. M.; Miedema, H.; Bruning, H.; van der Wal, A. Charge Efficiency: A Functional Tool to Probe the Double-Layer Structure Inside of Porous Electrodes and Application in the Modeling of Capacitive Deionization. J. Phys. Chem. Lett. 2010, 1, 205–210.
- Porada et al. (2013) Porada, S.; Borchardt, L.; Oschatz, M.; Bryjak, M.; Atchison, J. S.; Keesman, K. J.; Kaskel, S.; Biesheuvel, P. M.; Presser, V. Direct prediction of the desalination performance of porous carbon electrodes for capacitive deionization. Energy Environ. Sci. 2013, 6, 3700.
- Kim et al. (2015) Kim, T.; Dykstra, J. E.; Porada, S.; van der Wal, A.; Yoon, J.; Biesheuvel, P. M. Enhanced charge efficiency and reduced energy use in capacitive deionization by increasing the discharge voltage. J. Colloid Interface Sci. 2015, 446, 317–326.
- Shanbhag et al. (2016) Shanbhag, S.; Whitacre, J. F.; Mauter, M. S. The Origins of Low Efficiency in Electrochemical De-Ionization Systems. J. Electrochem. Soc. 2016, 163, E363–E371.
- Avraham et al. (2009) Avraham, E.; Bouhadana, Y.; Soffer, A.; Aurbach, D. Limitation of Charge Efficiency in Capacitive Deionization. J. Electrochem. Soc. 2009, 156, P95.
- Avraham et al. (2010) Avraham, E.; Noked, M.; Bouhadana, Y.; Soffer, A.; Aurbach, D. Limitations of charge efficiency in capacitive deionization processes III: The behavior of surface oxidized activated carbon electrodes. Electrochim. Acta 2010, 56, 441–447.
- Gao et al. (2014) Gao, X.; Omosebi, A.; Landon, J.; Liu, K. Enhancement of charge efficiency for a capacitive deionization cell using carbon xerogel with modified potential of zero charge. Electrochem. commun. 2014, 39, 22–25.
- Smith et al. (2014) Smith, K. C.; Chiang, Y.-M.; Craig Carter, W. Maximizing Energetic Efficiency in Flow Batteries Utilizing Non-Newtonian Fluids. J. Electrochem. Soc. 2014, 161, A486–A496.
- Johnson and Newman (1971) Johnson, A. M.; Newman, J. Desalting by Means of Porous Carbon Electrodes. J. Electrochem. Soc. 1971, 118, 510.
- Bazant (2013) Bazant, M. Z. Theory of chemical kinetics and charge transfer based on nonequilibrium thermodynamics. Acc. Chem. Res. 2013, 46, 1144–1160.
- Pillay and Newman (1996) Pillay, B.; Newman, J. S. The Influence of Side Reactions on the Performance of Electrochemical Double-Layer Capacitors. J. Electrochem. Soc. 1996, 143, 1806.
- Qu et al. (2015) Qu, Y.; Baumann, T. F.; Santiago, J. G.; Stadermann, M. Characterization of Resistances of a Capacitive Deionization System. Environ. Sci. Technol. 2015, 49, 9699–9706.
- Dykstra et al. (2016) Dykstra, J. E.; Zhao, R.; Biesheuvel, P. M.; van der Wal, A. Resistance identification and rational process design in Capacitive Deionization. Water Res. 2016, 88, 358–370.
- Posey and Morozumi (1966) Posey, F. A.; Morozumi, T. Theory of Potentiostatic and Galvanostatic Charging of the Double Layer in Porous Electrodes. J. Electrochem. Soc. 1966, 113, 176–184.
- Dunn and Newman (2000) Dunn, D.; Newman, J. Predictions of Specific Energies and Specific Powers of Double-Layer Capacitors Using a Simplified Model. J. Electrochem. Soc. 2000, 147, 820.
- de Levie (1964) de Levie, R. On porous electrodes in electrolyte solutions—IV. Electrochim. Acta 1964, 9, 1231–1245.
- Suss et al. (2013) Suss, M. E.; Baumann, T. F.; Worsley, M. A.; Rose, K. A.; Jaramillo, T. F.; Stadermann, M.; Santiago, J. G. Impedance-based study of capacitive porous carbon electrodes with hierarchical and bimodal porosity. J. Power Sources 2013, 241, 266–273.
See pages - of zSI_v6.pdf