DOOM Level Generation using Generative Adversarial Networks
Abstract
We applied Generative Adversarial Networks (GANs) to learn a model of DOOM levels from human-designed content. Initially, we analyzed the levels and extracted several topological features. Then, for each level, we extracted a set of images identifying the occupied area, the height map, the walls, and the position of game objects. We trained two GANs: one using plain level images, one using both the images and some of the features extracted during the preliminary analysis. We used the two networks to generate new levels and compared the results to assess whether the network trained using also the topological features could generate levels more similar to human-designed ones. Our results show that GANs can capture intrinsic structure of DOOM levels and appears to be a promising approach to level generation in first person shooter games.
I Introduction
Content creation is nowadays one of the most expensive and time consuming tasks in the game development process. Game content can be either functional or non-functional [1]; functional content, such as weapons, enemies, and levels, is related to the game mechanics and directly affects game dynamics; non-functional content, such as textures, sprites, and 3D models, is not related to game mechanics and has a limited impact on game dynamics. In this context, levels are of paramount importance, especially in first person shooter and platform games, as they greatly affect the player experience. Unfortunately, level design usually heavily relies on domain expertise, good practices, and an extensive playtesting. To deal with these issues, several game researchers are spending considerable effort on studying and designing procedural content generation systems that, exploiting machine learning and search algorithms, can model the level design process and assist human designer.
In this work, we focus on the level design for DOOM11 1 https://en.wikipedia.org/wiki/Doom_(franchise), a first person shooter game released in 1993 that is considered a milestone in video game history and today still has an active community of players. There are several collections of DOOM levels freely available online, like the Video Game Level Corpus [2] (VGLC), which includes the official levels of DOOM and DOOM2 represented in multiple formats, and the idgames archive22 2 http://doom.wikia.com/wiki/Idgames_archive, a large repository with more than 9000 DOOM levels created by the community. Thanks to the possibility offered by such publicly available data, in this paper we propose and study a novel method for the procedural generation of DOOM levels using Generative Adversarial Networks (GANs) a type of deep neural network. Initially, we created a dataset suitable for training a GAN from more than 1000 DOOM levels. We processed each level to generate (i) a set of images that represent the most important features of the level (i.e., the walkable area, walls, floor height, objects, and room segmentation), and (ii) a vector of numerical and categorical attributes that effectively describe the level (e.g., size, length of the perimeter, number of rooms, etc.). Then we trained two models of GAN: (i) an unconditional GAN that uses as input only the images of the levels and (ii) a conditional GAN that uses as input also a selection of the features extracted from the existing levels. To evaluate and compare the quality of the levels generated by the two networks we designed a set of metrics, inspired to the ones used to evaluate the quality of indoor maps created by SLAM algorithms [3]. Our results show that the quality of the generated levels improves during the training process and, after 36000 iterations, both networks generate levels of good visual quality and with a limited amount of noise. The results also suggest that the conditional GAN is able to exploit the input feature vector to generate levels with a slightly higher visual and structural similarity to human-designed levels.
II Related Work
II-A Generative Adversarial Networks
Generative Adversarial Networks (GANs) are a recent generative model based on Artificial Neural Networks. This type of models learns the data distribution of a dataset and generate synthetic data that exhibit similar characteristics to the real data. Among all the domains in which GANs have been already applied, image processing is one of the most prominent. For example, Radford et al. [4] presented several applications of GANs that involve handwritten digits [5], human faces [6], and bedrooms [7]. Then, a large amount of creative work was performed also on datasets about birds and flowers [8]. Another successful application of GANs is the image-to-image translation: Isola et al. [9] investigated GANs as a general solution to this problem in several settings such as image colorization, segmented image to realistic scene conversion or generation of realistic objects starting from hand drawn input (see for example Figure 1). GANs have also been employed in many other domains such as frame prediction in videos [10] and sound generation [11].

II-B PCGML in Video-Games
Procedural Content Generation (PCG) was used in early days of game development to deal with memory and computational limitations [12]. Notable examples include Elite [13], a space simulation in which procedural generation is used to create the game universe, and Rogue [14], a dungeon-crawling game in which dungeon rooms and the hallways are generated by means of an algorithm. More recently, PCG is still used in several games to support the generation of content and to increase the re-playability of games. Some examples of PCG applications in recent games are Diablo [15], Minecraft [16], Dwarf Fortress [17], Elite: Dangerous [18], and No Man’s Sky [19].
Recently, Summerville et al. [20] introduced a novel approach to PCG based on machine learning (PCGML), that consists of training machine learning models (e.g., a deep neural network) on existing game contents and, thus, using the trained models to generate novel contents. This approach proved to be successful in several applications [20], despite most of the previous works focused on the level generation for platform games. For example, Dahlskog et al. [21] used n-grams to generate new levels for Super Mario[22], Rishabh et al. [23] used autoencoders, while Snodgrass and Ontañón [24] proposed an approach based on Markov Chains. In [25] the authors presented a method for generating levels of Legend of Zelda[26] using Bayes Nets for the high level topological structure and Principal Component Analysis for generating the rooms. In contrast, in this work, we propose a method for generating the whole level topology using a single model, with the possibility of easily adding more features or eventually applying the same structure to another dataset. In their work, Scott et al.[27] use neural networks for predicting resources location in StarCraft II maps [28]. Although the data domain is similar to the one used in our work, they focused on resource placement rather than map topology generation. Beckham and Pal [29] proposed a method based on GANs for generating realistic height level maps for video games, that is more focused on landscapes and might be difficult to apply to generate indoor environments. Finally, the same approach can be also applied to non-functional content generation, as done in [30], in which GANs are used to generate 2d sprites.
III Analysis of DOOM Levels
DOOM is a major milestone in the history of video games that greatly influenced the First Person Shooter game genre. In DOOM, the player traverses a series of levels populated by enemies that she must kill to reach the exit, while collecting weapons, ammunition, power-ups, and keys to open doors.
III-A Level Representation (WADs)
DOOM levels are saved as WAD files that store all the topological information as well as the multimedia assets. A WAD file contains an ordered sequence of records (or lumps). The Name lump simply contains the name of the level. The lump named Things contains all the information about the objects included in the level that are not walls, doors, or floor tiles. The Vertexes lump is an ordered list of each vertex in the map. The Linedefs lump contains all the directed lines that connects two vertices of the map; lines define walls, steps, invisible boundaries, or triggers (e.g., tripwires, switches). The Sidedefs lump contains the texture data for each side of a line and the number of sector (i.e., an area of the level) enclosed by that side of the line. The lump labeled Sectors contains the information about all the sectors that is areas that have a constant height and the same texture. Figure 2 shows an example of a level with 3 sectors. Note that although all the above lumps are mandatory to build a playable level, some additional lumps are added to the WAD format to speed up the rendering process; we refer the interested reader to [31] for a complete list.

III-B Image Representation
To train GANs with DOOM levels, we generated a set of images to represent the data of WAD files. Each image represents a specific feature of the level as a grayscale 8-bit image. In particular, we generated six images for each level. FloorMap images represent the level floor encoding (i) the empty areas that can be traversed by the players with a white pixel and (ii) all the areas that cannot be traversed (e.g., obstacles, areas outside the walls) with a black pixel. WallMap images represent the level walls as white one-pixel-wide lines. HeightMap images represent the height of the floor in each level area; zero values encode the areas that cannot be traversed, other values encode all the other heights. ThingsMap images represent data defined by the Things lump described before; things are encoded as single pixels with a specific value for each type of element that can be found in a level. TriggerMap images represent all the level triggers and encode both (i) the type of trigger and (ii) a tag identifying either the trigger or the triggered object (local doors, remote doors, lifts, switches and teleports). RoomMap images represent a room segmentation of the level computed with an approach similar to the one used for the analysis of indoor environments [32].
III-C Features
We analyzed the levels using both the WAD files and the images generated in the previous step. For each level, we extracted 176 features (numerical and categorical) divided in four major groups. Metadata features are based on the metadata available for each level, such as title, authors, description, rating, number of downloads, etc. WAD features were extracted directly from the level WAD file and included the number of lines, things, sectors, vertices, size of the level, etc. Image features were extracted from the image representation of the level like, for instance, the equivalent diameter of the level, fraction of area that can be traversed, perimeter of the level, vertical and horizontal size of the level, etc. Graph features are computed from a graph representation extracted from the RoomMap image by applying methods used to analyze indoor environments [33]; they include number of nodes, closeness centrality, betweenness centrality, assortativity, etc.
IV Deep Level Generation
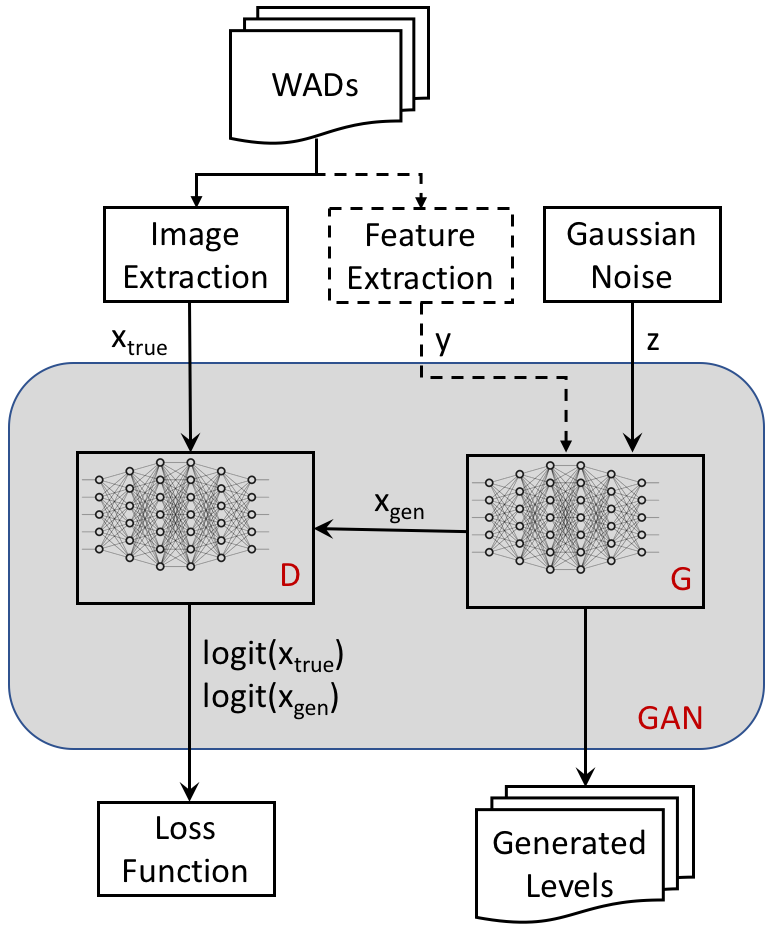
In this study, we applied Generative Adversarial Networks [34] (GANs) to learn a model of existing DOOM levels; we then used the model to generate new levels. Figure 3 shows an overview of our framework. The generative network comprises two deep neural networks: a generator network G and a discriminator network D. For each level, the generator network receives in input () (i) the six images (Section III-B) extracted from the level WAD file (ii) a vector of level features (Section III-C), and (iii) a noise vector sampled from a Gaussian distribution. As a result, the GAN generates six images that represent a generated level and can be used to produce a fully playable level. Thus, the generator network is trained to generate an output that is as similar as possible to the original inputs . In contrast, the discriminator network receives as input either or (the images of either a level designed by a human or a level produces by the generator network). The discriminator network outputs the logit value of the probability that and are images of a generated level. Thus, the discriminator network is trained to distinguish between human-designed and generated levels.
Network Architecture. We employed the Wasserstein GAN with Gradient Penalty (WGAN-GP) [35] architecture that proved to be more stable and to provide similar or better results than other GAN architectures [35]. In addition, we replaced the tanh activation function on the output layer [35], with a sigmoid function (more suitable for grayscale images with few levels of gray). In particular, we considered two models of WGAN-GP: (i) an unconditional WGAN-GP that receives as input only the images extracted by the WAD file and the noise vector (i.e., only and ); (ii) a conditional WGAN-GP that also receives the vector of features extracted from the level.
Loss Functions. The loss functions and used for the generator (G) and discriminator (D) networks are defined as,
where and are the loss functions used respectively for the discriminator and the generator networks; and are the images that represent human-designed and generated levels; the gradient penalty is computed as and , , .
Training. We trained the discriminator and generator networks following the approach proposed in [35]: we used Adam[36] optimizer and optimized the discriminator network five times for each update of the generator network. In each training iteration, we also applied a 90 degree clockwise rotation to the input images, so that the networks were trained using all the four possible level orientations. This transformation allows us to exploit the rotation invariance in the representation of a DOOM level, since its playability is not affected by its orientation in the space.
V Experimental Design
In this paper we trained and compared two different GANs: the first one, dubbed unconditional, does not have any level feature in input; the second one, dubbed conditional, has in input a vector of features selected among the ones extracted from the level (Section III-C). Both models have the same structure: the generator and the discriminator have 4 layers with 1024, 512, 256 and 128 filters, and have been trained for 36000 iterations on the same dataset with the same learning hyperparameters (, , , and ). In the following, we briefly describe the dataset used to train the networks, how we selected the additional input features for the conditional model, and how we evaluated the generated levels.
V-A Dataset
The training data consists of a selection of the levels available in the idgames archive, the largest online archive of levels, modifications, tools, and resources for the games based on the DOOM engine. In particular, due to computational constraints, we selected only levels on one single floor and that could be represented with images of size not greater than 128x128 pixels. As a result, our dataset contains 1088 levels. Please notice that this archive and its content is not officially maintained by id Software but it is community service.
V-B Feature Selection
Because of the memory limitation of our GPUs (6Gb), we were unable to use all the 176 features we extracted for each level (Section III-C) for training. Accordingly, we analyzed all the features and selected a small subset of them to be used as input to the conditional networks. Features selection was guided by two principles: (i) visual relevance, i.e., we needed features that had similar values in visually similar levels, and (ii) robustness, i.e., we needed features not affected by noisy pixels that might be generated by the network random sampling. At the end, we selected the following seven features:
- 1.
Equivalent diameter: diameter of the smallest circle that encloses the whole level.
- 2.
Major axis length: length of the longest axis of the level (either horizontal or vertical).
- 3.
Minor axis length: length of the longest axis of the level (either horizontal or vertical).
- 4.
Solidity: walkable area of the level (as a fraction of the area of the convex hull that encloses the whole level).
- 5.
Nodes: number of rooms in the level.
- 6.
Wall Distance Skewness: skewness of the distribution of each floor pixel distance from the closest wall; the value of this feature accounts for the balance between large and small areas.
- 7.
Wall Distance Skewness: kurtosis of the distribution of each floor pixel distance from the closest wall; the value of this feature is a measure of the variety of level areas in terms of size.
V-C Levels Evaluation
Evaluating the quality of the samples generated from a neural network is currently an open issue [37]. To deal with this problem, previous works [37] used either an assessment based on human annotations or on the score provided by the inception module [38], an image classifier. Unfortunately, these approaches require a lot of human effort and the inception module cannot be easily applied to our dataset which is very different from ImageNet33 3 http://www.image-net.org/ dataset it was trained on.
Accordingly, we designed a set of metrics related to the visual quality of the generated maps. In particular, our metrics are inspired to the ones designed in [3] to evaluate the maps generated by a SLAM algorithm running on a mobile agent, that are rather similar to the maps generated by our network. Note that, the proposed metrics are not meant to provide a general solution to the problem of evaluating samples of a GAN nor to improve previous work on the evaluation of maps generated by SLAM algorithms [3].
E: we compute the entropy of the pixel distribution for all the images that represent both human-designed and generated levels. Thus, for each level image, we compute the average absolute difference between the entropy values computed for human-designed levels () and the ones computed for generated levels (). As a result, this metric is able to detect whether the quantity of information encoded by the images of generated levels differs from the one encoded by the images of human-designed levels, as typically happens when generated images are very noisy.
SSIM: we computed the average Structural Similarity (SSIM) [39] index between the images of human-designed and generated levels. This metric takes into account several characteristics of the images, such as the luminance, the contrast and the local structure. The value SSIM is comprised between 0 and 1 (where 1 is achieved when comparing the same images).
EE: given that in some level images pixel could have only few meaningful values (e.g., in the FloorMap each pixel should have either value 0, black, or 255, white), we computed how far each pixel is to its closest meaningful value. Accordingly, we computed the Encoding Error of the network as a measure of the average errors over the pixel values of the level images generated by the network.
CE: first, we used the Harris detector [40] to compute the number of corners contained in FloorMap and WallMap images. Then, we computed the average Corner Error [3] between the images of human-designed levels and generated levels, that is a measure of how large is the difference between the average number of corners in the two sets of levels. The resulting metric provides an estimated of the how close are human-designed and generated levels in terms of structural complexity.
VI Experimental Results
We trained two GANs, an unconditional network using level images and a conditional network using also the level features; then, we compared them based on the evaluation of the level images they can generate.


Figure 4 and Figure 5 show the discriminator loss of the unconditional and the conditional networks. The discriminator loss steadily decreases with the training iterations in both types of network; in addition, the loss achieved on the training set (red line in Figure 4 and 5) is close to the one achieved on the validation set (blue line in Figure 4 and 5), suggesting that the networks have good generalization capabilities; finally, the learning process seems slightly faster for the conditional network than for unconditional one, although, due to the adversarial nature of the network, the discriminator loss value alone is not representative of the quality of the generated images.


Figure 6 compares the entropy of the pixel distribution E for the FloorMap images of the levels generated by the unconditional and conditional networks. Both networks are able to achieve a E value close to 0 at the end of the training; thus, the FloorMap of the generated levels have an entropy level very similar to human-designed levels. The analysis of the E value computed on WallMap and ThingsMap (not reported here) gives similar results, despite the final values of E are slightly greater as the generated images are slightly more noisy than FloorMap. Figure 7 shows the E computed on the HeightMap of the generated levels: although the conditional network is able to achieve slightly smaller E (at the end of the training) than unconditional network, none of the two networks is able to achieve a E value close to 0; the result is not surprising as in human-designed levels there is usually a very limited number of height levels, while the generated HeightMap images are much more noisy.

Figure 8 compares the average Structural Similarity index SSIM computed on the levels generated by the two networks; the results show that both networks rapidly improve the SSIM of the generated levels at the beginning of the training process; in addition, they also suggest that the levels generated by conditional network have an overall quality that is slightly better than the one generated by the unconditional network.

The analysis of the network Encoding Error EE computed on the level images generated by the two networks shows that both networks quickly reduce EE during the training process achieving almost the same final performance at the end. Figure 9 shows the EE computed for the FloorMap of the generated levels; both networks generate images with very small errors at the end of the training process.


Figure 10 and Figure 11 show the average Corner Error CE computed respectively on the FloorMap and on the WallMap of the levels generated by the two networks; the results suggest that the CE of the levels generated by the unconditional network does not improve with training, while it does (at least slightly) in the levels generated by conditional network; in addition, during the whole training process, the CE appears to be much less noisy for the unconditional network; these results suggest that, overall, levels generated by conditional network have a structural complexity more similar to the human-designed levels.


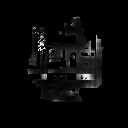
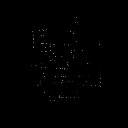

Finally, Figure 12 and Figure 13 report examples of levels generated by the two networks. The visual comparison shows that the levels generated by the conditional network (Figure 13) have a richer structure and, overall, look slightly more similar to the human-designed levels. On the other hand, the images suggest that the networks struggle to reproduce smaller details of the levels, probably due to generation noise.
VII Conclusions
We trained two Generative Adversarial Networks (GANs) to learn a model from more than 1000 DOOM levels. The unconditional model was trained with level images extracted from the original WAD files. The conditional model was trained using the same images and additional topological features extracted from the level structure. We applied the models to generate new levels and analyzed the types of levels generated with and without the additional features. Our results show that the two networks can generate new levels with characteristics that are similar to the levels used for training. They also show that the additional features used to train the conditional network increase the quality of generated samples and lead to better learning. The evaluation of samples generated with GANs is still a recent field of research and so far there is no prevailing approach. Moreover, our domain makes is difficult to apply the commonly used methods to assess sample quality. In this work, we proposed a qualitative method for assessing the generated sample quality during the training process that works for DOOM level images.
Our promising results, although preliminary, represent an excellent starting point for future improvements and highlight a viable alternative to classical procedural generation. Most generated levels have proved to be interesting to explore and play due to the presence of typical features of DOOM maps (like narrow tunnels and large rooms). Our approach extracts domain knowledge through learning and so it does not require an expert to encode it explicitly, as traditional procedural generation often does. Thus, human designers can focus on high-level features by including specific types of maps or features in the training set as those we selected as network inputs.
References
- [1] J. Togelius, G. N. Yannakakis, K. O. Stanley, and C. Browne, “Search-based procedural content generation,” in Applications of Evolutionary Computation, C. Di Chio, S. Cagnoni, C. Cotta, M. Ebner, A. Ekárt, A. I. Esparcia-Alcazar, C.-K. Goh, J. J. Merelo, F. Neri, M. Preuß, J. Togelius, and G. N. Yannakakis, Eds. Berlin, Heidelberg: Springer Berlin Heidelberg, 2010, pp. 141–150.
- [2] A. J. Summerville, S. Snodgrass, M. Mateas, and S. O. n’on Villar, “The vglc: The video game level corpus,” Proceedings of the 7th Workshop on Procedural Content Generation, 2016.
- [3] A. Filatov, A. Filatov, K. Krinkin, B. Chen, and D. Molodan, “2d slam quality evaluation methods,” 08 2017.
- [4] A. Radford, L. Metz, and S. Chintala, “Unsupervised representation learning with deep convolutional generative adversarial networks,” CoRR, vol. abs/1511.06434, 2015. [Online]. Available: http://arxiv.org/abs/1511.06434
- [5] Y. Lecun, L. Bottou, Y. Bengio, and P. Haffner, “Gradient-based learning applied to document recognition,” Proceedings of the IEEE, vol. 86, no. 11, pp. 2278–2324, Nov 1998.
- [6] Z. Liu, P. Luo, X. Wang, and X. Tang, “Deep learning face attributes in the wild,” in Proceedings of International Conference on Computer Vision (ICCV), 2015.
- [7] F. Yu, Y. Zhang, S. Song, A. Seff, and J. Xiao, “Lsun: Construction of a large-scale image dataset using deep learning with humans in the loop,” arXiv preprint arXiv:1506.03365, 2015.
- [8] H. Zhang, T. Xu, H. Li, S. Zhang, X. Huang, X. Wang, and D. N. Metaxas, “Stackgan: Text to photo-realistic image synthesis with stacked generative adversarial networks,” CoRR, vol. abs/1612.03242, 2016. [Online]. Available: http://arxiv.org/abs/1612.03242
- [9] P. Isola, J.-Y. Zhu, T. Zhou, and A. A. Efros, “Image-to-image translation with conditional adversarial networks,” arxiv, 2016.
- [10] M. Mathieu, C. Couprie, and Y. LeCun, “Deep multi-scale video prediction beyond mean square error,” CoRR, vol. abs/1511.05440, 2015. [Online]. Available: http://arxiv.org/abs/1511.05440
- [11] L. Yang, S. Chou, and Y. Yang, “Midinet: A convolutional generative adversarial network for symbolic-domain music generation using 1d and 2d conditions,” CoRR, vol. abs/1703.10847, 2017. [Online]. Available: http://arxiv.org/abs/1703.10847
- [12] N. Shaker, J. Togelius, and M. J. Nelson, Procedural content generation in games. Springer, 2016.
- [13] D. Braben and I. Bell, “Elite,” 1984.
- [14] A. Design, “Rogue,” 1980.
- [15] B. N. Blizzard Entertainment, “Diablo,” 1996.
- [16] Mojang, “Minecraft,” 2011.
- [17] T. Adams, “Dwarf fortress,” 2006.
- [18] F. Developments, “Elite: Dangerous,” 2014.
- [19] H. Games, “No man’s sky,” 2016.
- [20] A. Summerville, S. Snodgrass, M. Guzdial, C. Holmgård, A. K. Hoover, A. Isaksen, A. Nealen, and J. Togelius, “Procedural content generation via machine learning (PCGML),” CoRR, vol. abs/1702.00539, 2017. [Online]. Available: http://arxiv.org/abs/1702.00539
- [21] S. Dahlskog, J. Togelius, and M. J. Nelson, “Linear levels through n-grams,” in Proceedings of the 18th International Academic MindTrek Conference: Media Business, Management, Content & Services. ACM, 2014, pp. 200–206.
- [22] S. Miyamoto and T. Tezuka, “Super mario bros.” 1985.
- [23] R. Jain, A. Isaksen, C. Holmgård, and J. Togelius, “Autoencoders for level generation, repair, and recognition,” in Proceedings of the ICCC Workshop on Computational Creativity and Games, 2016.
- [24] S. Snodgrass and S. Ontañón, “Experiments in map generation using markov chains.” in FDG, 2014.
- [25] A. J. Summerville and M. Mateas, “Sampling hyrule: Multi-technique probabilistic level generation for action role playing games,” in Eleventh Artificial Intelligence and Interactive Digital Entertainment Conference, 2015.
- [26] S. Miyamoto and T. Tezuka, “The legend of zelda,” 1986.
- [27] S. Lee, A. Isaksen, C. Holmgård, and J. Togelius, “Predicting resource locations in game maps using deep convolutional neural networks,” in The Twelfth Annual AAAI Conference on Artificial Intelligence and Interactive Digital Entertainment. AAAI, 2016.
- [28] B. Entertainment, “Starcraft ii,” 2010.
- [29] C. Beckham and C. J. Pal, “A step towards procedural terrain generation with gans,” CoRR, vol. abs/1707.03383, 2017. [Online]. Available: http://arxiv.org/abs/1707.03383
- [30] L. Horsley and D. Perez-Liebana, “Building an automatic sprite generator with deep convolutional generative adversarial networks,” in Computational Intelligence and Games (CIG), 2017 IEEE Conference on. IEEE, 2017, pp. 134–141.
- [31] M. S. Fell, “The unofficial doom specs,” Online, December 1994. [Online]. Available: http://www.gamers.org/dhs/helpdocs/dmsp1666.html
- [32] R. Bormann, F. Jordan, W. Li, J. Hampp, and M. Hägele, “Room segmentation: Survey, implementation, and analysis,” in 2016 IEEE International Conference on Robotics and Automation (ICRA), May 2016, pp. 1019–1026.
- [33] M. Luperto and F. Amigoni, “Predicting the global structure of indoor environments: A constructive machine learning approach,” 2018, unpublished article at the moment of writing.
- [34] I. J. Goodfellow, J. Pouget-Abadie, M. Mirza, B. Xu, D. Warde-Farley, S. Ozair, A. C. Courville, and Y. Bengio, “Generative adversarial networks,” CoRR, vol. abs/1406.2661, 2014. [Online]. Available: http://arxiv.org/abs/1406.2661
- [35] I. Gulrajani, F. Ahmed, M. Arjovsky, V. Dumoulin, and A. C. Courville, “Improved training of wasserstein gans,” CoRR, vol. abs/1704.00028, 2017. [Online]. Available: http://arxiv.org/abs/1704.00028
- [36] D. P. Kingma and J. Ba, “Adam: A method for stochastic optimization,” CoRR, vol. abs/1412.6980, 2014. [Online]. Available: http://arxiv.org/abs/1412.6980
- [37] T. Salimans, I. J. Goodfellow, W. Zaremba, V. Cheung, A. Radford, and X. Chen, “Improved techniques for training gans,” CoRR, vol. abs/1606.03498, 2016. [Online]. Available: http://arxiv.org/abs/1606.03498
- [38] C. Szegedy, V. Vanhoucke, S. Ioffe, J. Shlens, and Z. Wojna, “Rethinking the inception architecture for computer vision,” CoRR, vol. abs/1512.00567, 2015. [Online]. Available: http://arxiv.org/abs/1512.00567
- [39] Z. Wang, A. C. Bovik, H. R. Sheikh, and E. P. Simoncelli, “Image quality assessment: from error visibility to structural similarity,” IEEE Transactions on Image Processing, vol. 13, no. 4, pp. 600–612, April 2004.
- [40] C. Harris and M. Stephens, “A combined corner and edge detector,” in In Proc. of Fourth Alvey Vision Conference, 1988, pp. 147–151.