Subaru/HiCIAO imaging of LkH 330 - multi-band detection of the gap and spiral-like structures
Abstract
We present - and -bands observations of the LkH 330 disk with a multi-band detection of the large gap and spiral-like structures. The morphology of the outer disk () at PA=0–45∘ and PA=180–290∘ are likely density wave-induced spirals and comparison between our observational results and simulations suggests a planet formation. We have also investigated the azimuthal profiles at the ring and the outer-disk regions as well as radial profiles in the directions of the spiral-like structures and semi-major axis. Azimuthal analysis shows a large variety in wavelength and implies that the disk has non-axisymmetric dust distributions. The radial profiles in the major-axis direction (PA=) suggest that the outer region () may be influenced by shadows of the inner region of the disk. The spiral-like directions (PA=10∘ and 230∘) show different radial profiles, which suggests that the surfaces of the spiral-like structures are highly flared and/or have different dust properties. Finally, a color-map of the disk shows a lack of an outer eastern region in the -band disk, which may hint the presence of an inner object that casts a directional shadow onto the disk.
I. Introduction
A protoplanetary disk loses almost all of its mass after a few million years [46, 24, 20, 77], during which the disk can be perturbed by accretion, jets, photoevaporation, dust growth, and planet formation [22, 7, e.g.,]. Previous theoretical simulations predicted gaps within disks, which is likely related to planet formation [62, 79, 98, 97, e.g.,]. In recent years, dozens of high-spatial resolution observations have revealed a diversity of shapes within disks such as gaps, rings, and spiral features [47, 66, 4, 71, e.g.,]. Radio observations allow investigation of the gas and dust distributions of disk and infrared (IR) observations provide scattered light information from the surface of disks. Particularly, possible planet-disk interactions for many of these disk shapes have been suggested [96, 27], as well as other predictions such as dust sintering [67]. However, the number of reported companion candidates within the disks is much smaller than the number of asymmetric disks [74, 75, 23, 81, 76]. Therefore continuing explorations of disk and companions is important for the study of planet formation and disk evolution mechanisms.
A class of disks having an inner cavity, called transitional disks, is of particular interest in studying the disk evolution and dissipation. Some of the transitional disks are expected to harbor a small inner disk that is optically thick in optical/near-IR around a central star and are called pre-transitional disks [35, 36]. In this paper, we report the result of near infrared scattered light imaging observations of LkH 330. LkH 330 is a young stellar object (YSO) in the Perseus association ((RA,DEC) =(03 45 48.28, 32 24 11.9)). This system exhibits the spectral feature of a pre-transitional disk [36] and [16] suggested an inner disk by showing polycyclic aromatic hydro-carbon features. Furthermore, mm and sub-mm observations have reported that the disk has a large (–) gap [15, 5, 54] and IR observations have suggested spirals [1]. These studies suggest grain growth and possibly unseen planets within the disk that may cause the large gap and spirals. To follow-up the earlier studies on this intriguing system we conducted - and -bands observations of LkH 330 as a part of the Strategic Explorations of Exoplanets and Disks with Subaru [86, SEEDS;] project.
II. Observations and Data Reduction
The observations and data for LkH 330, which are analyzed in this study, have been reported previously in [88].
We made -band (1.6 m) observations of LkH 330 in 2014 October and -band (2.2 m) observations in 2015 January with Subaru/HiCIAO [84] combined with classical AO system AO 188 [50]. A typical FWHM of each unsaturated point-spread function (PSF) is 80 mas in the -band and 70 mas in the -band. The data of this study were obtained without a coronagraph for both the - and -band observations. Note that [1] also used Subaru/HiCIAO to observe this system in 2011 December but adopted a coronagraph mask, which prevents exploration of the gap region of the disk. The data sets were taken by combining polarization differential imaging (PDI) to investigate faint disk structures and angular differential imaging (ADI) to detect substellar companions around the central star. Detailed observation logs are shown in the SEEDS/YSO comprehensive report of [88], which applied only ADI reduction [61, 57] for companion explorations. This study focuses on the data analysis of PDI. We used the “quad-PDI” (qPDI) mode where two Wollaston prisms enable the acquisition of two ordinary and extraordinary rays on one frame simultaneously. Each field of view is 5″5 and the plate scale after distortion correction is 9.5 mas/pix. After the first reduction of flat fielding, distortion correction, and image registration, all the polarimetric data sets were reduced in the same way as [47, 48] using IRAF.
III. Results and Data Analysis
III.1. Basic Parameters of LkH 330
LkH 330 was assumed to have 250 pc for a distance, 3 Myr old for an age, and GIII for a spectral type [21, 34] in the previous studies introduced in Section I. However, Gaia DR2 recently reported the distance to be pc [40, 39]. Therefore we adopt the GAIA-measured distance in our discussion. [52] estimated a spectral type of LkH 330 to be F7.0 by analyzing its optical spectra with an assumed distance of 315 pc. We converted the spectral type of F7.0 to the effective temperature using the relationship between a spectral type and effective temperature in [70]. We used B and V-band magnitudes [64] to determine extinction-corrected V-band magnitude, which was converted to a LkHa 330’s bolometric luminosity based on [70]. These effective temperature and luminosity described above were compared to the Pisa pre-main sequence evolution tracks [87]. Finally, we estimate a mass and age of LkH 330 to be and Myr, respectively.


|


|

III.2. Polarized Intensity Image
We detected a large gap and spiral-like features with signal-to-noise (S/N) ratios of 30 at the peak of the ring and 20 at the peak of the spiral regions. Figure 1 shows and -scaled polarization intensity (PI) images. The PI parameter is dependent on and we scaled this parameter by multiplying PI image by so that we can more properly see the structures. We note that this treatment corresponds to neglecting the disk flaring when calculating scattering angle, and may be problematic when discussing the disk structures quantitatively [82]. In this paper, we present some characteristic features on radial and azimuthal profiles and disk asymmetry of the disk, but keep the discussions on them at more or less qualitative levels. The contours taken from the Submillimeter Array (SMA) observation (=0.87 mm) discussed in [1] are superimposed on the figures.
To estimate the S/N ratio, we first measured the polarization vector as seen in Figure 2 and defined as the difference of the angle between the polarization vector and the vector normal to the position vector measured from the central star. We then calculated radial profiles (see Figure 3) and converted the polarization angle error into a polarization error using an equation (6) in [56]. In this estimate of the error, we assume that the ”real” polarization vectors are centro-symmetric around the central star. The observed polarization pattern is indeed very close to centro-symmetric (see Figure 2) and the non-azimuthal polarization such as T Cha [73] is probably negligible. We define noise as the standard deviation at given annular areas like ADI contrast limit [88, see Section III.7 and].
III.3. Gap Region
We traced the inner wall (hereafter we call this the “ring”) region in the -scaled PI images and then fitted the peak profiles with an elliptic equation , in which and are the semi-major axis and semi-minor axis. Table 1 compares the cavity radius, position angle of the semi-major axis, and inclination from previous studies and this work.
In the calculation we used
the nonlinear least-squares (NLLS) Marquardt-Levenberg algorithm implemented into gnuplot. The error bars represent
1 asymptotic standard error.
We note that previous studies used the midplane of the disk for measuring the gap while we used the surface brightness of the disk.
Observations of transitional disks have systematically revealed bigger cavity sizes in the mm continuum than in scattered light [32], e.g., PDS 70 [48, 49] and 2MASS J1604 [63, 33]. This phenomenon may be explained as being due to mm-sized dust being filtered out at the cavity edge due to gas-dust coupling effect [78, 97, 31, e.g.,].
Here we report that LkH 330 is another example of this class of object. [5] modeled mm continuum emission of the disk and concluded that the cavity size is 84 au [54, ; see also]. The NIR cavity size seen by Subaru is only 54 au, much smaller than the mm cavity size.
| Parameters | Previous study | This study |
|---|---|---|
| semi-major axis [au]a | 50b–84c | 541 |
| position angle [degree] | 80b | 912 |
| inclination [degree] | 35b | 313 |
III.4. Spiral-like Region
As discussed in [1] the two peaks of the SMA continuum are located at spiral-like features. Interestingly, the surface and midplane distributions at the south-west region are consistent, while the north-east region does not exhibit a similar distribution. Figure 4 shows deprojected and -scaled PI images and figures 5 and 6 show polar-projected images taken from Figure 4. We traced the ridge of the spiral-like structures, which is superimposed on the images (blue crosses). The morphology of the outer region implies that the disk’s rotation is counter-clockwise. Note that we did not change the scattering angle when deprojecting the PI images but changed their inclinations to zero only for the purpose of tracing the peaks of the outer structures.
We can now see clear deviations from the axisymmetric ring-like structure at 200 mas. There are two spiral structures: one is launched at about PA=290∘ and the other is at PA=70∘. We find that the - and -band observations have different shapes of the outer asymmetric features. For the south-west non-axisymmetric features, they extend from PA290∘ to 180∘ both in - and -bands, and they appear like ”spiral” features. For the north-east feature, however, the H-band feature extends from PA70∘ to 0∘ and it does appear like a ”spiral”, while in the -band, the emission between PA40∘ and 0∘ is missing. The appearance of the north-east feature in the -band may be described as ”slightly inclined blob”. Anyway, the inclined spirals can have complex morphology [28, e.g.,] and we discuss the possibility of the spiral in Section IV.1.2.
We could trace the peaks of the south-west structure between PA=180∘–270∘ in the -band and between PA=180∘–290∘ in the -band. On the other hand, we could trace the peaks of the north-east structure between PA=0∘–70∘ in the -band and between PA=40∘–60∘ in the -band. We investigated angles between the roots of the spirals and the ring by using the -band result for north-east structure and the -band result for south-west structure. The pitch angles are determined to be 12∘ and 16∘ for the south-west and north-east structures, respectively. These values are similar to the SAO 206462 spirals [66].
However, we note a weak tendency from the “spiral top” toward the other side of disk in Figures 5 and 6, which possibly represents another mechanism. A trailing spiral behaves as a monotonically increasing profile [42]. The spiral density wave is likely to be a trailing feature, and it may be difficult to explain the blob-like morphology that we see in the north-east in the Ks-band image. Since previous SMA and CARMA observations did not report any specific features except for the central large gap, identifying these asymmetric outer structures requires follow-up observations with a high spatial resolution.


|


III.5. Azimuthal Profiles
III.5.1 Ring Region
We investigated the surface brightness profiles of the deprojected image after averaging over 55 pix so that we can expect to reduce the noise at the pixel scale. Figure 7 shows azimuthal profiles of the deprojected PI images at separations of and . We find that azimuthal profiles at the ring region () show strong wavelength dependence. This is in contrast to the results of multi-band observations of the disk in other systems [9, e.g.,]. The south direction (PA180∘) is the brightest in the -band profile. Considering that the minor axis of the disk is in the north-south direction (see Section III.3), this is probably due to the excess of forward scattering and therefore the southern side of the disk is likely to be the near side. However, in the -band, the scattered light is the brightest in the eastern side, which is along the major axis of the disk. Such a large variation in the scattered light profiles in different bands might suggest that the dust distribution is not azimuthally symmetric. This issue will be further discussed in Section IV.2.1.
III.5.2 Outer Region
Our -band profile at is different from [1], particularly at the north region. The previous observation used the coronagraph mask and did not explore the central region, while our observation could explore much inner region. Our profile might be partially influenced by the asymmetric dust distribution of the ring. We also find that these profiles are quite different from the ring azimuthal profile, particularly the relative decline of the surface brightness at the forward scattering region. The spiral-like features appear at in Figures 5 and 6 but our data sets suggest that the area likely belongs to the outer spiral-like region.

III.6. Radial Profiles
Figure 8 shows radial profiles between and in both the - and -band PI images. These profiles have azimuthal asymmetry. The PAs 10∘ and 230∘ correspond to both spiral-like features. and correspond to the semi-major axis directions. We used the least squares method on these profiles and a power-law to investigate the surface structure of the disk. The fitted powers are listed in Table 2. Except at the ring and spiral-like regions, the surface brightness is in proportion to the separation, to the power of no larger than 2, and is different from a flared disk’s behavior. An profile can be explained with a flat disk [65], which can produce shadows due to surface structures and make the surface brightness profiles complex.
Within the and profiles are similar but have small difference. This difference may reflect a difference in the ring’s scattering between the - and -bands. In both bands the inner regions (H: au, K: au) behaves as highly flared disks, which creates shadows outward (H:50–75 au, K: 55–80 au). By combining these features we can assume that the -band ring extends more than the -band ring.
At the outer region the fitted powers are smaller than along PA= direction, which suggests that the disk’s surface in the semi-major axis directions also behaves as a flat disk influenced by shadows. PA= profile is the semi-major axis direction but mixed with the spiral-like structure. In PA=10∘ and 230∘ directions the profiles exhibit a more gradual change, with a steep decrease at separations greater than . These profiles are consistent with flaring of the spiral-like structure and these region may have different dust properties.

| PA [degree] | ||||||
|---|---|---|---|---|---|---|
| 10 | -0.44 | -4.1 | -0.65 | -0.10 | -5.4 | -6.5 |
| 91 | -1.2 | -5.1 | -0.91 | -1.2 | -4.6 | -0.70 |
| 230 | -5.0 | -3.5 | -1.0 | 7.8 | -4.6 | -0.33 |
| 271 | -6.5 | -2.9 | -7.0 | 9.0 | -2.4 | -5.2 |
III.7. Angular Differential Imaging
As companion exploration, [88] conducted an ADI reduction of all the LkH 330 data sets and could not find any companion candidates around the central star. Figure 9 shows our ADI-reduced image of the -band observation. We performed ADI-LOCI reduction [57] and the algorithm automatically masked a region from the center. Our ADI-LOCI pipeline did not work properly for the nearly face-on disk, resulting in artificial residual pattern as seen in Figure 9. Therefore, one cannot discuss the morphology of the disk in the ADI-LOCI reduced image. Nonetheless, the image can be used to constrain the flux from a possible point-like source. Some signals remain around the central star but their S/N ratios of them are less than 5 and therefore we regard them as being residual from the PSF subtraction.
The contrast limits have already been described in [88], and were converted into mass limits based on the COND03 model [8]. Figure 10 shows the mass limit of our observations. We have set constraints on the mass of potential companions in the disk down to 20 . The shadows correspond to errors of our age estimation. The conversion was based on the “hot-start” model [3, BT-Settl;].
Besides age, planet mass limits could also be uncertain due to assumed planet luminosity evolution models. “Hot-start” evolutionary models such as those we adopt are often associated with disk instability formation. “Cold-start” models [60] attempt to model planet formation by core accretion and yield lower initial entropies and luminosities and thus higher masses for a given contrast limit [10, though see]. However, demographics suggest that companions with these masses/mass ratios and separations detectable from our data are likely not planets formed by core accretion [14, 25]. Thus, our mass limits are likely to probe only companions formed like binary stars or by disk instability.


IV. Discussions
The disk around the LkH 330 has complex morphology. In this section, we focus on disk features one by one and discuss the implications on the disk properties, which will help to synthetically model the disk and to investigate disk evolution mechanisms such as gap opening and spiral forming with unseen planets.
IV.1. Morphology
IV.1.1 Gap
Previous observations of LkH 330 suggested planet formation within the gap [97, 54, e.g.,]. Our ADI reduction could not fully explore the gap region and thus planet formation remains a plausible but unconfirmed scenario.
Grain growth [11, e.g.,] and disk wind [85, e.g.,] are also possible mechanisms for opening the gap in the disk. A spectral feature of LkHa 330 is an excess at the mm and sub-mm wavelength ranges [15, 53], which suggests the existence of larger dust and supports the possibility of grain growth. Investigating disk wind will require follow-up observations of gas kinematics; the presence of disk wind is suggested if blue-shift components excel in the data. Although photoevaporation can produce a gap within the disk [19, 43, 69, e.g.,], the disk mass is much larger [5, ;] than expected mass of the photoevaporation stage [2, an order of 0.001;].
IV.1.2 Spiral-like Structures
The LkH 330 system may be another disk, after SAO 206462 [66], MWC 758 [44], HD 100453 [90], DZ Cha [18] (note that the inner disk in the AB Aur system, Hashimoto et al. 47, has also been suggested to host two spiral arms, Figure 14 in Dong et al. 28), that has been discovered to have a pair of nearly symmetric spiral arms in scattered light. Except for HD 100453, which has an M dwarf companion that is probably driving the arms [29, 91], the origin of the spiral arms in the other systems is under debate. Two mechanisms are proposed to explain the morphology of these near arms: gravitational instability [30, e.g.,], and companion-disk interaction [30, 96, e.g.,]. As LkH 330’s disk mass is perhaps too low to trigger the gravitational instability [5, ;], we consider companion-disk interactions to constitute a plausible scenario.
We carried out three-dimensional hydrodynamics and radiative transfer simulations to produce synthetic images of a pair of planet-induced spiral arms in scattered light that qualitatively match the Subaru observations of LkH 330, as shown in Figure 11. The simulation was conducted based on the planetary-mass-companion model in Dong et al. [28], and is briefly described here. We use the hydrodynamics code PENGUIN [38] to calculate the density structure of a disk perturbed by a planet in a circular orbit at 100 au. The resulting disk structure is translated into near-IR polarized light images using the radiative transfer code HO-CHUNK3D [93]. The planet’s mass was , which corresponds to in LkH 330. The synthetic image was produced assuming the object is 310 pc away, and under the actual viewing angle of the system, PA = 90∘ and inclination = 30∘. The image was convolved by a Gaussian PSF to achieve an angular resolution of . The outer disk exterior to the planet’s orbit was removed in post-processing. The model image matches the actual data well, which suggests that the two spiral arms in LkH 330 may be induced by a – planet at AU (). At the current epoch, the planet may be at PA 20∘. Note that these simulations focus on reconstructing a pair of spirals in the LkH 330’s disk and are separate from those reported in [54] that predicted unseen protoplanets within the gap region.


|
IV.2. Color Discussion
We have observed LkH 330 in the - and -bands and can discuss a disk variation in wavelength. In this section we focus on the difference between the azimuthal profile of the ring shown in Figure 12 and a color map of the disk.
IV.2.1 Scattering Properties
We investigated phase functions of a grain-scattering model in Figure 12 using equations (8) and (9) in [45], where we fixed the polarization parameter of to 1. We put four dotted lines in each graph by changing the scattering parameter of and a coefficient of the phase function in order to compare the phase functions to the ring profiles. A formula of the phase function is given by
where is a scattering angle and is an inclination. Figure 13 is a polar diagram of Henyey-Greenstein phase function [51, , where is a phase angle;] by changing from 0 to 0.6, which shows the dependency of scattering angle on the phase function. Forward scattering angle is given by where is an opening angle of the disk [55, see figure 9 in]. We assume that the disk is geometrically thin and is negligible. Our adopted phase functions partially deviate from the azimuthal profiles of the ring. These phase functions have similar profiles at the brightest region. The -band functions with may be more suitable for the profile at PA–, while fits the profile at PA in the -band. However, these functions do not fully agree with the ring profiles. Apparently at the north region (PA0∘) both rings are much brighter than the expected phase functions and -band azimuthal profile three peaks, which cannot be reproduced by a simple phase function we adopt and may suggest the ring has non-axisymmetric distribution of dust and/or composition.
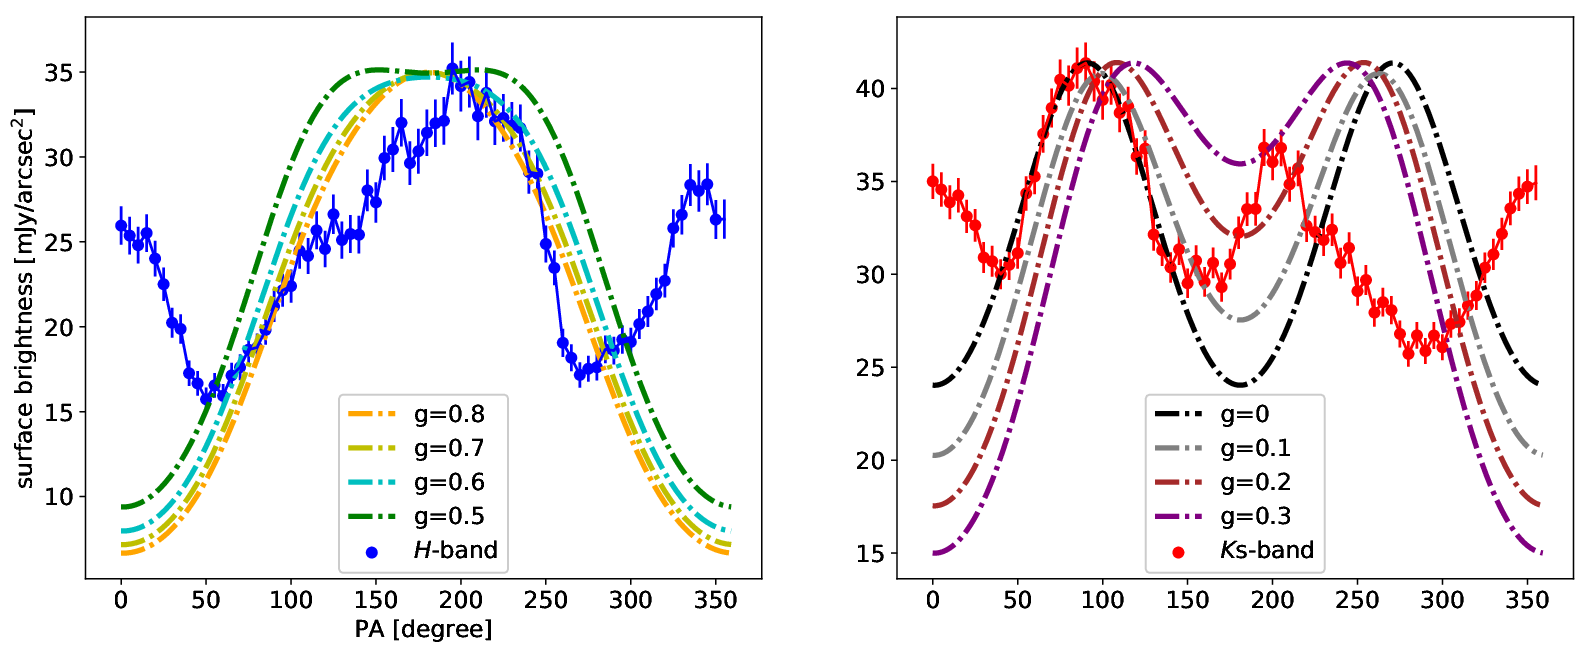

In order to investigate whether such large variations of the scattering properties with a simple dust model, we run a Mie scattering code attached to the HO-CHUNK radiative transfer code [13, 94] assuming the astronomical silicates model [58]. When we defined the dust size so as to reproduce the -band value by changing minimum dust size between 1 nm and 300 nm, the value in the -band was automatically defined and was always smaller than 0.5. This result indicates that the ring profiles cannot be described by a simple dust species distributed all over the entire disk. Our assumptions and calculations could not characterize the disk fully but might set particular constraints on the dust distribution.
Explaining these variations requires non-axisymmetric pattern of size, density, and composition distributions and vertical structures. As ALMA revealed that MWC 758 has complexity in its ring [12], radio interferometric observations will help to reveal dust size and density distributions. Identifying its composition requires follow-up observations in other bands, e.g., with JWST/MIRI [92] or TMT/MICHI [80]. A future integral field spectroscopy (IFS) in mid-IR wavelength can constrain abundance of polycyclic aromatic hydrocarbon and silicate. The wavelength difference of the azimuthal surface brightness structures shown in Figure 12 may not be simply explained by the azimuthal variations of the vertical structures and therefore investigating synthetic dust distributions will be necessary.
IV.2.2 Color Map
Figure 14 shows a color map of the disk generated by dividing the -band PI image by the -band PI image. In this process the -band image is convolved in order to fit the -band’s PSF to the -band’s PSF. AO188 worked effectively enough to suppress both PSF’s wings and the -band PSF’s core is broader as mentioned in Section II. We then re-registered two PDI-reduced images by defining the center as the elliptical-fit results of the ring. Finally we normalized the / PI image by the luminosity of the central star [95, =2.27 from UCAC4 catalog;].

We find that the disk is basically “blue”. This implies that the typical dust size is small enough for Rayleigh scattering. However, there are seen some ”redder” regions at (,PA)=(, 0∘–30∘) and (–, 45∘–90∘). The northern part (, 0∘–30∘) is influenced by the north-east spiral-like feature that appears only in the -band image (see Figures 4, 5, and 6). The inner eastern part (–, 45∘–90∘) corresponds to the wavelength-difference of the azimuthal profiles, which is discussed in Section IV.2.1.
The outer eastern part (–, 45∘–90∘) comes from the lack of an outer scattering area in the -band disk. The -band PI image previously reported in [1], which is presented as a -scaled PI image in Figure 16, looks like the -band image. A comparison of the FWHMs of the previous and our -band image shows that our data sets had better AO efficiency. Therefore our data reduction shows a “red” region at the outer north-east region. This phenomenon demonstrates that a possibility of “a directional shadow” is plausible; namely, when we observed this system, an inner object occasionally partially veiled starlight and cast a shadow onto the north-east region of the disk. We consider a clump-like object moving in the very inner region. If the orbit of the object is highly misaligned with the outer disk, we can explain the change of outer morphology over the 3 months. The orbital separation is expected to be very near (1 au) the central star. Regarding the possibility of there being an inner clump, we refer to CVSO 30 and “dipper” stars. CVSO 30 was reported to harbor a close-in protoplanet candidate based on transit observations [89, CVSO 30 b;]. However, follow-up observations suggested that the companion candidate is a clump rather than a planet [68]. Dipper YSOs revealed by the K2 survey suggest the existence of occulting structures located at quite small separations [6]. Particularly, [6] reported RX J1604.3-2130A to be a dipper star. This YSO has a face-on disk with a large gap [63, e.g.,]. Therefore an inner clump-like object with an orbit highly misaligned to the outer disk is a possible scenario.
Another possible mechanism of casting shadow in the outer disk is the existence of an inner disk. Previous disk observations have revealed shadows on the protoplanetary disks induced by inner objects [41, 72, 17, 82, 83, 9, 26]. If LkH 330 has an inner disk that can cast shadows on the outer disk, non-axisymmetric structures can be observed [37]. From the models presented in [59], we consider that the difference of the inclination between the inner and the outer disks is as small as in order to produce the azimuthal features observed in -band. Given that our -band image, which was taken just 3 months after the -band image, however, this rapid change of the shadow feature can hardly be explained by the change of the orientation of the inner disk because we do not expect rapid (on the timescale comparable to Kepler timescale) precession of the inner disk. The inner disk should have a particular extinction property to let -band wavelength transmit. As multi-band observations of HD 100453 [9] did not show clear difference of the shadow structures, we consider that the shadowing by the inner disk is unlikely.
In order to investigate this scenario follow-up observations are required. If the PI signal is detected again as reported in [1], a clump-like object scenario is plausible. However, if follow-up observations fail to detect a PI signal, other scenarios should be considered, such as asymmetric dust distribution or difference of dust properties between the outer and inner disks.
References
- [1] Akiyama, E., Hashimoto, J., Liu, H. B., et al. 2016, AJ, 152, 222
- [2] Alexander, R. D., Clarke, C. J., & Pringle, J. E. 2006, MNRAS, 369, 229
- [3] Allard, F., Homeier, D., & Freytag, B. 2011, in Astronomical Society of the Pacific Conference Series, Vol. 448, 16th Cambridge Workshop on Cool Stars, Stellar Systems, and the Sun, ed. C. Johns-Krull, M. K. Browning, & A. A. West, 91
- [4] ALMA Partnership, Brogan, C. L., Pérez, L. M., et al. 2015, ApJ, 808, L3
- [5] Andrews, S. M., Wilner, D. J., Espaillat, C., et al. 2011, ApJ, 732, 42
- [6] Ansdell, M., Gaidos, E., Rappaport, S. A., et al. 2016, ApJ, 816, 69
- [7] Armitage, P. J. 2011, ARA&A, 49, 195
- [8] Baraffe, I., Chabrier, G., Barman, T. S., Allard, F., & Hauschildt, P. H. 2003, A&A, 402, 701
- [9] Benisty, M., Stolker, T., Pohl, A., et al. 2017, A&A, 597, doi:10.1051/0004-6361/201629798
- [10] Berardo, D., Cumming, A., & Marleau, G.-D. 2017, ApJ, 834, 149
- [11] Birnstiel, T., Andrews, S. M., & Ercolano, B. 2012, A&A, 544, A79
- [12] Boehler, Y., Ricci, L., Weaver, E., et al. 2018, ApJ, 853, 162
- [13] Bohren, C. F., & Huffman, D. R. 1983, Absorption and scattering of light by small particles
- [14] Brandt, T. D., McElwain, M. W., Turner, E. L., et al. 2014, ApJ, 794, 159
- [15] Brown, J. M., Blake, G. A., Qi, C., Dullemond, C. P., & Wilner, D. J. 2008, ApJL, 675, L109
- [16] Brown, J. M., Blake, G. A., Dullemond, C. P., et al. 2007, ApJ, 664, L107
- [17] Canovas, H., Hardy, A., Zurlo, A., et al. 2017, A&A, 598, doi:10.1051/0004-6361/201629145
- [18] Canovas, H., Montesinos, B., Schreiber, M. R., et al. 2018, A&A, 610, doi:10.1051/0004-6361/201731640
- [19] Clarke, C. J., Gendrin, A., & Sotomayor, M. 2001, MNRAS, 328, 485
- [20] Cloutier, R., Currie, T., Rieke, G. H., et al. 2014, ApJ, 796, 127
- [21] Cohen, M., & Kuhi, L. V. 1979, ApJS, 41, 743
- [22] Crida, A., & Morbidelli, A. 2007, MNRAS, 377, 1324
- [23] Currie, T., Cloutier, R., Brittain, S., et al. 2015, ApJ, 814, L27
- [24] Currie, T., Lada, C. J., Plavchan, P., et al. 2009, ApJ, 698, 1
- [25] Currie, T., Burrows, A., Itoh, Y., et al. 2011, ApJ, 729, 128
- [26] Debes, J. H., Poteet, C. A., Jang-Condell, H., et al. 2017, ApJ, 835, doi:10.3847/1538-4357/835/2/205
- [27] Dong, R., & Fung, J. 2017, ApJ, 835, 146
- [28] Dong, R., Fung, J., & Chiang, E. 2016a, ApJ, 826, 75
- [29] Dong, R., Zhu, Z., Fung, J., et al. 2016b, ApJ, 816, L12
- [30] Dong, R., Zhu, Z., Rafikov, R. R., & Stone, J. M. 2015a, ApJ, 809, L5
- [31] Dong, R., Zhu, Z., & Whitney, B. 2015b, ApJ, 809, 93
- [32] Dong, R., Rafikov, R., Zhu, Z., et al. 2012, ApJ, 750, 161
- [33] Dong, R., van der Marel, N., Hashimoto, J., et al. 2017, ApJ, 836, 201
- [34] Enoch, M. L., Young, K. E., Glenn, J., et al. 2006, ApJ, 638, 293
- [35] Espaillat, C., D’Alessio, P., Hernández, J., et al. 2010, ApJ, 717, 441
- [36] Espaillat, C., Muzerolle, J., Najita, J., et al. 2014, Protostars and Planets VI, 497
- [37] Facchini, S., Juhász, A., & Lodato, G. 2018, MNRAS, 473, 4459
- [38] Fung, J. 2015, PhD thesis, University of Toronto, Canada
- [39] Gaia Collaboration, Brown, A. G. A., Vallenari, A., et al. 2018, ArXiv e-prints, arXiv:1804.09365
- [40] Gaia Collaboration, Prusti, T., de Bruijne, J. H. J., et al. 2016, A&A, 595, doi:10.1051/0004-6361/201629272
- [41] Garufi, A., Quanz, S. P., Schmid, H. M., et al. 2014, A&A, 568, doi:10.1051/0004-6361/201424262
- [42] Goldreich, P., & Tremaine, S. 1979, ApJ, 233, 857
- [43] Goto, M., Usuda, T., Dullemond, C. P., et al. 2006, ApJ, 652, 758
- [44] Grady, C. A., Muto, T., Hashimoto, J., et al. 2013, ApJ, 762, 48
- [45] Graham, J. R., Kalas, P. G., & Matthews, B. C. 2007, ApJ, 654, 595
- [46] Haisch, Karl E., J., Lada, E. A., & Lada, C. J. 2001, ApJ, 553, L153
- [47] Hashimoto, J., Tamura, M., Muto, T., et al. 2011, ApJ, 729, L17
- [48] Hashimoto, J., Dong, R., Kudo, T., et al. 2012, ApJ, 758, L19
- [49] Hashimoto, J., Tsukagoshi, T., Brown, J. M., et al. 2015, ApJ, 799, 43
- [50] Hayano, Y., Takami, H., Guyon, O., et al. 2008, in Society of Photo-Optical Instrumentation Engineers (SPIE) Conference Series, Vol. 7015, Society of Photo-Optical Instrumentation Engineers (SPIE) Conference Series, 10
- [51] Henyey, L. G., & Greenstein, J. L. 1941, ApJ, 93, 70
- [52] Herczeg, G. J., & Hillenbrand, L. A. 2014, ApJ, 786, 97
- [53] Hitchcock, T. in prep.
- [54] Isella, A., Pérez, L. M., Carpenter, J. M., et al. 2013, ApJ, 775, 30
- [55] Jang-Condell, H. 2017, ApJ, 835, 12
- [56] Kwon, J., Tamura, M., Hough, J. H., Nagata, T., & Kusakabe, N. 2016, AJ, 152, 67
- [57] Lafreniere, D., Marois, C., Doyon, R., Nadeau, D., & Artigau, E. 2007, ApJ, 660, 770
- [58] Laor, A., & Draine, B. T. 1993, ApJ, 402, 441
- [59] Long, Z. C., Fernandes, R. B., Sitko, M., et al. 2017, ApJ, 838, 62
- [60] Marley, M. S., Fortney, J. J., Hubickyj, O., Bodenheimer, P., & Lissauer, J. J. 2007, ApJ, 655, 541
- [61] Marois, C., Lafreniere, D., Doyon, R., Macintosh, B., & Nadeau, D. 2006, ApJ, 641, 556
- [62] Marsh, K. A., & Mahoney, M. J. 1992, ApJ, 395, L115
- [63] Mayama, S., Hashimoto, J., Muto, T., et al. 2012, ApJ, 760, L26
- [64] Mermilliod, J. C. 1987, Astronomy and Astrophysics Supplement Series, 71, 413
- [65] Momose, M., Morita, A., Fukagawa, M., et al. 2015, PASJ, 67, 83
- [66] Muto, T., Grady, C. A., Hashimoto, J., et al. 2012, ApJ, 748, L22
- [67] Okuzumi, S., Momose, M., Sirono, S.-i., Kobayashi, H., & Tanaka, H. 2016, ApJ, 821, 82
- [68] Onitsuka, M., Fukui, A., Narita, N., et al. 2017, PASJ, 69, L2
- [69] Owen, J. E., Ercolano, B., & Clarke, C. J. 2011, MNRAS, 412, 13
- [70] Pecaut, M. J., & Mamajek, E. E. 2013, ApJS, 208, 9
- [71] Pérez, L. M., Carpenter, J. M., Andrews, S. M., et al. 2016, Science, 353, 1519
- [72] Pinilla, P., de Boer, J., Benisty, M., et al. 2015, A&A, 584, doi:10.1051/0004-6361/201526981
- [73] Pohl, A., Sissa, E., Langlois, M., et al. 2017, A&A, 605, A34
- [74] Quanz, S. P., Amara, A., Meyer, M. R., et al. 2013, ApJ, 766, L1
- [75] Reggiani, M., Quanz, S. P., Meyer, M. R., et al. 2014, ApJ, 792, L23
- [76] Reggiani, M., Christiaens, V., Absil, O., et al. 2017, ArXiv e-prints, arXiv:1710.11393
- [77] Ribas, Á., Bouy, H., & Merín, B. 2015, A&A, 576, doi:10.1051/0004-6361/201424846
- [78] Rice, W. K. M., Armitage, P. J., Wood, K., & Lodato, G. 2006, MNRAS, 373, 1619
- [79] Rice, W. K. M., Wood, K., Armitage, P. J., Whitney, B. A., & Bjorkman, J. E. 2003, MNRAS, 342, 79
- [80] Sakon, I., Sakon, I., Honda, M., et al. 2014, in TMT in the Astronomical Landscape of the 2020s, Thirty Meter Telescope Science Forum, held 16-19 July, 2014 in Tucson Arizona. Online at ¡A href=”http://conference.ipac.caltech.edu/tmtsf2014/”¿ http://conference.ipac.caltech.edu/tmtsf2014/¡/A¿, id. 22
- [81] Sallum, S., Follette, K. B., Eisner, J. A., et al. 2015, Nature, 527, 342
- [82] Stolker, T., Dominik, C., Avenhaus, H., et al. 2016, A&A, 595, doi:10.1051/0004-6361/201528039
- [83] Stolker, T., Sitko, M., Lazareff, B., et al. 2017, ApJ, 849, doi:10.3847/1538-4357/aa886a
- [84] Suzuki, R., Kudo, T., Hashimoto, J., et al. 2010a, in Proc. SPIE, Vol. 7735, 30
- [85] Suzuki, T. K., Muto, T., & Inutsuka, S.-i. 2010b, ApJ, 718, 1289
- [86] Tamura, M. 2009, 1158, 11
- [87] Tognelli, E., Prada Moroni, P. G., & Degl’Innocenti, S. 2011, A&A, 533, A109
- [88] Uyama, T., Hashimoto, J., Kuzuhara, M., et al. 2017, AJ, 153, 106
- [89] van Eyken, J. C., Ciardi, D. R., von Braun, K., et al. 2012, ApJ, 755, 42
- [90] Wagner, K., Apai, D., Kasper, M., & Robberto, M. 2015, ApJ, 813, L2
- [91] Wagner, K., Dong, R., Sheehan, P., et al. 2018, ApJ, 854, 130
- [92] Wells, M., Pel, J.-W., Glasse, A., et al. 2015, PASP, 127, 646
- [93] Whitney, B. A., Robitaille, T. P., Bjorkman, J. E., et al. 2013, ApJS, 207, 30
- [94] Whitney, B. A., Wood, K., Bjorkman, J. E., & Wolff, M. J. 2003, ApJ, 591, 1049
- [95] Zacharias, N., Finch, C. T., Girard, T. M., et al. 2012, VizieR Online Data Catalog, 1322
- [96] Zhu, Z., Dong, R., Stone, J. M., & Rafikov, R. R. 2015, ApJ, 813, 88
- [97] Zhu, Z., Nelson, R. P., Dong, R., Espaillat, C., & Hartmann, L. 2012, ApJ, 755, 6
- [98] Zhu, Z., Nelson, R. P., Hartmann, L., Espaillat, C., & Calvet, N. 2011, ApJ, 729, doi:10.1088/0004-637X/729/1/47
Appendix A Error Map of Polarization Angle
Figure 15, which is made from Figure 2, shows angle error maps in the - and -bands. These maps are used for calculating noise profiles of the PI images and details are explained in Section III. Yellow corresponds to larger difference from a centro-symmetric pattern of the polarization vectors and causes larger noise in the PI image.


|
Appendix B Comparison of Our results with the Previous HiCIAO Image
Figure 16 compares our HiCIAO observations with the previous HiCIAO observation that was originally presented in [1]. Our data sets achieved better AO efficiency and are explained in Section II.


|