Highest-frequency detection of FRB 121102 at 48 GHz using the Breakthrough Listen Digital Backend at the Green Bank Telescope
Abstract
We report the first detections of the repeating fast radio burst source FRB 121102 above 5.2 GHz. Observations were performed using the 48 GHz receiver of the Robert C. Byrd Green Bank Telescope with the Breakthrough Listen digital backend. We present the spectral, temporal and polarization properties of 21 bursts detected within the first 60 minutes of a total 6-hour observations. These observations comprise the highest burst density yet reported in the literature, with 18 bursts being detected in the first 30 minutes. A few bursts clearly show temporal sub-structures with distinct spectral properties. These sub-structures superimpose to provide enhanced peak signal-to-noise ratio at higher trial dispersion measures. Broad features occur in GHz wide subbands that typically differ in peak frequency between bursts within the band. Finer-scale structures ( MHz) within these bursts are consistent with that expected from Galactic diffractive interstellar scintillation. The bursts exhibit nearly 100% linear polarization, and a large average rotation measure of 9.3590.012 104 rad m-2 (in the observer’s frame). No circular polarization was found for any burst. We measure an approximately constant polarization position angle in the 13 brightest bursts. The peak flux densities of the reported bursts have average values (0.20.1 Jy), similar to those seen at lower frequencies ( GHz), while the average burst widths (0.640.46 ms) are relatively narrower.
I Introduction
Fast Radio Bursts (FRBs) are a class of radio transients with inferred extragalactic origin due to their anomalously high dispersion measures (DMs) relative to the contribution expected from the Galactic electron distribution [19]. This inference was proven for one source, FRB 121102, when repeated bursts at the DM of 557 pc cm-3 were localized by interferometry to be unambiguously associated with a dwarf galaxy at redshift [4, 22, 32]. Bursts from FRB 121102 have isotropic apparent radio energies of erg, several orders of magnitude higher than for any other radio transient on millisecond timescales [16].
FRB 121102 is the only FRB known to repeat and for which a position is known to sub-arcsecond precision. This has facilitated extensive follow-up observational campaigns. While the burst cadence is irregular, there appear to be epochs in which the source is more active and multiple bursts are detected. For example, [28] reported 6 bursts within a 10-minute interval while several other long observing sessions resulted in non-detections (e.g. Price et al. 27). These bursts have so far only been detected between GHz (Spitler et al. 31, Scholz et al. 28, Law et al. 16, Michilli et al. 25; Spitler et al. 2018 in prep). Additionally, [16] reported the non-detection of bursts at 70 MHz, 4.5 GHz, and 15 GHz, during epochs in which bursts were detected at 1.4 and 3 GHz, indicating that some bursts are not likely to be broadband.
Propagation effects, such as scintillation and plasma lensing, can significantly alter the observed radio emission from impulsive radio sources [21, 7]. Estimates of the FRB burst rate have taken into account the observed bursts (e.g. Lawrence et al. 17); however the observed radio emission could be affected by these propagation effects. Disentangling the intrinsic emission from propagation effects is thus an important goal in FRB science. Detection of bursts at different frequencies and over wider bandwidths is helpful for studying the frequency dependence of potential propagation effects. Measurement of burst polarization can also shed light on emission physics and the source’s local environment. Recently, [25] reported a very high and variable Faraday rotation measure of rad m-2 for FRB 121102, suggesting that this source is embedded in an extreme and dynamic magneto-ionic environment.
Here we report the detection of 21 bursts from FRB 121102—all of which occurred within an hour—using the GHz receiver on the Robert C. Byrd Green Bank Telescope (GBT) and the Breakthrough Listen backend. These are the highest-frequency detections of bursts from any FRB to date11 1 Fifteen of these detections were announced briefly in [11]. Here we are reporting more detailed analysis..
The remainder of this paper is structured as follows. In Section II, we describe our observations. In Section III.1 we highlight issues with finding a true DM for the bursts, followed by a discussion on the spectro-temporal structures in a subset of bursts in Section III.2. We confirm and extend the results of [25] by performing polarimetry on baseband voltage data in Section III.3. Our wide instantaneous bandwidth reveals these bursts to be band-limited, with dynamic structure varying on short timescales, which are further discussed in Section III.4. A brief discussion of our findings is in Section IV along with a summary in Section V.
II Observations
Observations of FRB 121102 were conducted with the GBT as part of the Breakthrough Listen (BL) project [36]. BL is a comprehensive search for extraterrestrial intelligence (SETI) employing both optical and radio telescopes; the BL target list includes nearby stars and nearby galaxies, as well as other anomalous astronomical sources broadly classified as “exotica” [13]. As a component of the latter category, BL is conducting a targeted SETI search towards known FRB positions to investigate any associated artificial signals and/or underlying modulation pattern, hypothesizing that one or more FRBs may be deliberate artificial beacons or other manifestations of technology (e.g., Lingam & Loeb 18)22 2 However, we emphasize here that it is unlikely that the bursts we detected were transmitted from an intelligent civilization..
Observations using the GHz (C-band) receiver on the GBT were conducted on 2017 August 26 during a 6-hour BL observing block. The initial hour (with scans numbered from 0 to 10) was used for configuration of various telescope settings and calibration procedures. The calibrator 3C 161 and an off-source position were observed for one minute each, along with a calibration noise diode, and used for flux and polarization calibration using the pac tool in PSRCHIVE. A 5-minute observation of the bright pulsar PSR B0329+54 was also performed as a diagnostic to verify polarization and flux density measurements. The remaining five hours of the session were divided into ten 30-minute scans of FRB 121102, identified with scan numbers ranging from 11 to 20.
Observations were conducted with the BL digital backend [20], which recorded 8-bit baseband voltage data across the entire 4 GHz receiver bandwidth. The GBT analog downconversion system provided four 1500 MHz wide tunable passbands to cover the GHz band, configured with central on-sky frequencies of 4625.0, 5937.5, 7250.0, and 8562.5 MHz. These frequencies were chosen such that the signal at the edges of each passband’s intermediate frequency (IF) filter overlapped the adjacent passband by 187.5 MHz.
Each dual-polarization passband was Nyquist-sampled using 8-bit digitizers, polyphase channelized to 512 ‘coarse’ frequency channels, requantized to 8 bits, and then distributed to a cluster of compute nodes that recorded these data to disk. Directly after observations, the coarsely-channelized voltage data were further channelized (to 366 kHz resolution), integrated (with a sampling time of 350 sec) using a custom GPU-accelerated spectroscopy code, and finally written toSIGPROC33 3 http://sigproc.sourceforge.net filterbank files as total intensity (Stokes I) dynamic spectra with 4096 spectral channels.
These dynamic spectra were searched using the Heimdall package [1] for dispersed pulses within the DM range of 500 to 700 pc cm-3, using a DM interval of 0.1 pc cm-3. We detected 21 bursts above a threshold signal-to-noise ratio (S/N) of six. A section of raw voltages (of total 1.5 seconds) around each detected burst was extracted for further processing and coherently dedispersed to a DM of 565.0 pc cm-3 (see Section III.1) using the DSPSR package [34]. The coherently dedispersed PSRFITS data products have temporal and spectral resolutions of 10.1 s and 183 kHz, respectively44 4 PSRFITS data for all these bursts are publicly available to download at seti.berkeley.edu/frb121102/. We have discarded lower part of the frequency band (4 to 4.5 GHz) in further analysis due to spurious radio frequency interferences.
| Pulse | MJD (57991+) | S/N | DMS/N (pc cm-3) | Speak (mJy) | Width (ms) | F(Jy ms) | RMobs (rad m-2) | PA (deg) | PA∞ (deg) |
|---|---|---|---|---|---|---|---|---|---|
| 11A | 0.409904044 | 55.7 | 60118 | 380.5 | 1.740.01 | 0.62 | 9355918 | 63.90.4 | 6 |
| 11B | 0.412764720 | 7.1 | 5874 | 51.9 | 0.390.16 | 0.02 | |||
| 11C | 0.413019871 | 9.9 | 57415 | 85.2 | 0.420.08 | 0.03 | |||
| 11D | 0.413458764 | 37.0 | 58333 | 314.8 | 0.680.08 | 0.23 | 9350353 | 79.20.3 | 4 |
| 11E | 0.413706653 | 28.2 | 59118 | 126.8 | 1.150.08 | 0.14 | 9357743 | 80.90.8 | 6 |
| 11F | 0.413837058 | 29.2 | 58849 | 157.5 | 0.920.08 | 0.13 | 93836160 | 86.50.7 | 5 |
| 11G | 0.416436793 | 7.6 | 57410 | 52.9 | 0.310.08 | 0.02 | |||
| 11H | 0.416633362 | 58.0 | 57533 | 699.9 | 0.270.01 | 0.18 | 9346735 | 76.40.3 | 8 |
| 11I | 0.417714722 | 13.4 | 56910 | 125.5 | 0.340.08 | 0.04 | 9364859 | 77.21.2 | 4 |
| 11J | 0.417865553 | 9.9 | 57319 | 118.6 | 0.390.08 | 0.04 | |||
| 11K | 0.418627200 | 13.9 | 59132 | 105.2 | 0.810.08 | 0.06 | 93567248 | 77.91.3 | 5 |
| 11L | 0.419449885 | 8.4 | 5905 | 0.70 | |||||
| 11M | 0.421212904 | 11.1 | 5606 | 94.7 | 0.410.08 | 0.04 | |||
| 11N | 0.421712667 | 12.4 | 5677 | 256.7 | 0.190.01 | 0.04 | 9351360 | 81.80.8 | 5 |
| 11O | 0.422939456 | 12.1 | 58414 | 139.9 | 0.410.08 | 0.04 | 93802224 | 76.91.2 | 2 |
| 11P | 0.424270656 | 6.4 | 60131 | 1.79 | |||||
| 11Q | 0.426552515 | 20.9 | 56223 | 400.2 | 0.180.01 | 0.07 | 9350262 | 79.50.4 | 5 |
| 11R | 0.430427904 | 7.4 | 5828 | 0.27 | |||||
| 12A | 0.431974007 | 13.6 | 57256 | 132.2 | 0.720.08 | 0.07 | 93452111 | 80.40.4 | 5 |
| 12B | 0.439360677 | 20.6 | 63611 | 331.4 | 1.680.01 | 0.45 | 9364362 | 61.80.6 | 7 |
| 12C | 0.448427650 | 10.7 | 58040 | 118.8 | 0.680.08 | 0.07 | 93593101 | 73.50.7 | 11 |
III Analysis
PSRCHIVE [35] and custom Python scripts were used to measure the properties of the detected bursts. Table 1 lists various parameters determined for each burst. Among the ten recorded scans, all reported detections occurred in the first hour, i.e. from scans 11 and 12. We assigned the bursts identifiers 11A through 11R, and 12A through 12C, according to their scan number and order of arrival.
III.1 DM Optimization
The DM of FRB 121102 has been previously reported to range between pc cm-3 [30, 31, 28, 16] from lower frequency observations. For each burst detected here, we measured the S/N as a function of DM, and found that individual bursts show slightly different peak S/N-maximizing DMs (Table 1). To investigate further, we coherently dedispersed raw voltages from burst 11A across a range of DMs with a DM step of 5 pc cm-3. This investigation lead to the discovery of detailed spectro-temporal structures (components, see Figure 1 and Section III.2). It is likely that the differences between the DMs originate from how these components superimpose for different trial values of DM. Figure 1 shows burst 11A dedispersed and detected at three different DMs. While it is not clear if these components are intrinsic to the emission mechanism or due to propagation effects, their peculiar alignment provides enhanced S/N at higher DMs compared to previously reported DMs [30, 31, 28, 16].
Assuming these components to be intrinsic, we optimized the S/N of individual components by maximizing the average absolute rate-of-change of total flux density, which we call here a structure parameter, across the pulse window defined as,
| (1) |
Here, is the number of on–pulse bins while is the flux at the bin and is the time resolution. This structure-parameter-maximizing DM differs significantly from the S/N-maximizing DM (see Figure 1). Similar techniques have also been explored and will be reported in detail in Hessels et al. (2018, in prep) at lower frequencies. Although an analysis of this type was not possible for most of our detected pulses due to either low S/N, fewer components, or both, we assumed a structure-maximizing DM of 565.0 pc cm-3 to be consistent for all our bursts and used that value in coherent dedispersion. We note that this estimate can be off by our DM resolution in Figure 1 from a ‘true’ DM (i.e. 5 pc cm-3).

III.2 Spectro-temporal components
We found highly variable temporal and spectral features in many of the bursts. Figure 2 shows dynamic spectra of all bursts after coherent dedispersion at a DM of 565 pc cm-3. Bursts 11A and 12B exhibit distinct components, while bursts such as 11E, 11K, and 11O show some indication of unresolved components. For bursts 11D and 11F, such components are not clearly visible but likely give rise to the slanted or curved features seen in the dynamic spectra. Each burst was modeled as a sum of multiple Gaussian components using the PSRCHIVE utility paas. The model was then used to derive average widths and fluences for all bursts (see Table 1). We note that burst widths found here are relatively narrow compared to burst widths seen at lower frequencies (¡3 GHz) - as also noted for the Arecibo sample of 4.5-GHz bursts presented by [25].
![[Uncaptioned image]](1804.04101v1/montage_7x3.png) Figure 2: Dynamic spectra of all 21 detected bursts, coherently dedispersed at the DM of
565 pc cm-3. Waterfall data are frequency (Y-axis) vs. time (X-axis) with units
of MHz and ms, respectively, with intensity indicated on a linear scale. The gray
scales are different and scaled according to individual pulse S/N. Top
panels show flux density (mJy), and for twelve
bursts circular (blue) and linear (red) polarization and position angle (PA)
referenced to infinite frequency. The dashed horizontal
blue lines are frequency boundaries as the profile for each burst was
obtained after adding frequencies between these boundaries to enhance S/N.
Figure 2: Dynamic spectra of all 21 detected bursts, coherently dedispersed at the DM of
565 pc cm-3. Waterfall data are frequency (Y-axis) vs. time (X-axis) with units
of MHz and ms, respectively, with intensity indicated on a linear scale. The gray
scales are different and scaled according to individual pulse S/N. Top
panels show flux density (mJy), and for twelve
bursts circular (blue) and linear (red) polarization and position angle (PA)
referenced to infinite frequency. The dashed horizontal
blue lines are frequency boundaries as the profile for each burst was
obtained after adding frequencies between these boundaries to enhance S/N.
As 11A and 12B clearly exhibit distinct components, we measured the component widths separately. We identify four components in burst 11A integrated across GHz, with individual widths of 0.18, 0.10, 0.25, and 0.32 ms from the leading component to the trailing component, respectively. These components show varying spectral extent, with the first two limited to higher frequencies and the last two at lower frequencies. Additionally, components three and four show a very sharp rise and gradual decay of the burst energy. Component four exhibits a gradual increase in burst width towards lower frequencies. To compare with the expected scaling from a power-law scattering model ( where is the frequency of observations), we modeled the increase in the width as a function of frequency for the fourth component. We extracted dynamic spectra with widths of 200 MHz centered around 6200, 5980, 5780, and 5460 MHz. An integrated profile of the fourth component at these frequencies was found to have widths of 0.19, 0.49, 0.55 and 0.65 ms, respectively. We did not find width variations to follow a power-law trend, which is expected from scattering. More detailed analyses of the progressive drift in pulse profile components, as seen at other radio frequency bands, are presented in Hessels et al. (2018, in prep).
Burst 12B also exhibits two resolved components with widths of 0.29 and 0.30 ms, separated by 2 ms. As with 11A, the leading component spans higher frequencies, while the trailing component spans lower frequencies. In contrast to 11A, the trailing component of 12B does not show an increase in width at lower frequencies. While there may be a third component on the leading edge of the second component, the burst S/N is not sufficient for verification.
III.3 Faraday Rotation
We determined the Faraday rotation measure (RM) of the bursts by performing a brute-force search of the linear polarization fraction at different RM trials with the rmfit tool from PSRCHIVE. We developed a custom routine to correct for the initial RM values from rmfit and fit a quadratic function to the complex angles determined by the Stokes parameters. This technique refines the initial RMs and computes a polarization angle (PA) for each burst. A detailed description of this technique can be found in [25]. This approach was motivated by the extremely variable spectral properties of the bursts. From the 13 brightest bursts that could be analyzed using this technique, we find a mean RM of rad m-2. The RMs found here differ by rad m-2 from the RMs of the bursts detected from Arecibo at 4.5 GHz by [25]. After de-rotating the Stokes Q and U using the best-fit value of RM, all 13 bursts show linear polarization fraction and uniform polarization angles across the burst (Figure 2). We have only considered PAs from the phase bins with linear polarization above 3 sigma. The weighted mean PA for each burst, measured after weights calculated empirically from the variance in PAs across these phase bins, is listed in Table 1. The uncertainty on the weighted PA was measured as a sum of all weights for each burst. It should be noted that the PA is roughly uniform across the pulse phase, however, there are apparently significant variations in the average PA between all observed bursts at the level. For example, bursts 11A and 12B show slightly lower PAs compared to rest of the reported bursts. These differences in PAs could possibly arise from our uncertainties in the RM measurements, as these two quantities are covariant. No circular polarization was found for any burst and any undetected circular polarization is less than a few percent.
III.4 Burst-to-burst spectral variation


Figure 3 shows measured flux density as a function of observing frequency and time for the 17 brightest bursts. The peak flux frequency is not constant within the observed frequency band; similar spectral variation between bursts has also been reported by previous studies [31, 29, 16, 25]. These large-scale frequency features are approximately of the order of GHz in extent. To estimate the average number of discrete large-scale structures, we divided the spectrum from each burst into multiple bins, each 94 MHz wide, and then calculated the total amount of spectral energy in each bin (Figure 4). The overall spectral energy distribution shows two approximately GHz-wide peaks around 6 GHz and 7.2 GHz, with a possible trough in the spectral energy between 6.5 to 7 GHz. It should be noted that this spectral behavior is based on our detections of only 21 bursts. It is possible that the detection of a larger sample of bursts might fill this trough.
Figure 3 shows that bursts exhibit marked differences in their spectral extent and spectral peaks. Some bursts, such as 11A, show emission across the entire observed band; others, such as 11C, 11H and 11K, show emission only at the highest frequencies. Bursts 11G, 11N, and 12A show a concentration of emission in the lower half of the band. Bursts 11A to 11F exhibit a spectral peak around 7 GHz, which appears to then shift to lower frequencies in later bursts.
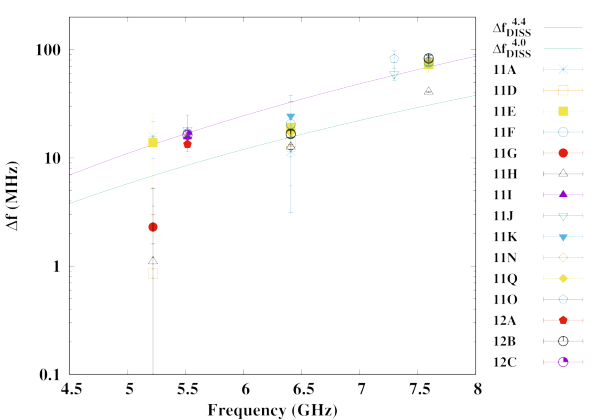
In order to assess the origin of large- and finer-scale frequency structures seen in Figure 2 and 3, we calculated the Galactic scintillation bandwidth across the observed band. We used the NE2001 model [6], and estimated a Galactic scattering timescale towards the direction of FRB 121102 ( is the observing frequency in GHz while is the scaling parameter). Assuming a frequency scaling for a Kolmogorov spectrum with scaling parameter between 4 to 4.4 [6, 3], we estimate the expected diffractive interstellar scintillation bandwidth as [15]
| (2) |
For the observed band (4.5 to 8 GHz), the predicted varies from 7 MHz to 87 MHz (assuming a scaling parameter of 4.4). Thus, the large-scale frequency structures ( GHz wide) are likely to be intrinsic to the source and/or due to propagation effects in the source’s local environment.

To compare these predicted values for with fine-scale frequency structures from the detected bursts, we obtained spectra for each burst by selecting an appropriate on-pulse window. Following the procedure of [8] and [5], we then computed auto-correlation functions (ACFs) for these spectra (Figure 5). As the spectral extent of a few bursts were significantly broad—spanning over 3 GHz—the ACFs over the entire spectra produce a multi-featured ACF with multiple widths. To measure the characteristic bandwidth for a given burst, we divided each spectrum into two or three parts, depending upon the spectral extent. We then fitted a Gaussian function to the ACF to obtain the half width at half maximum (HWHM) as a characteristic bandwidth for the given sub-spectra for each burst.
| Burst | Frequency (GHz) | (MHz) |
|---|---|---|
| 11A | 7.595 | 84.25.3 |
| 6.407 | 11.51.2 | |
| 5.220 | 15.85.9 | |
| 11D | 7.595 | 74.82.2 |
| 6.407 | 14.11.0 | |
| 11E | 7.595 | 73.111.7 |
| 6.407 | 19.113.6 | |
| 5.220 | 13.911.7 | |
| 11F | 7.595 | 76.74.9 |
| 6.407 | 20.517.4 | |
| 11G | 5.220 | 2.30.7 |
| 11H | 7.595 | 40.70.5 |
| 6.407 | 12.70.7 | |
| 11I | 5.517 | 15.71.9 |
| 11J | 7.298 | 59.67.8 |
| 5.517 | 18.16.7 | |
| 11K | 6.407 | 24.48.8 |
| 11N | 5.517 | 15.11.2 |
| 11O | 7.298 | 82.415.1 |
| 5.517 | 17.11.1 | |
| 11Q | 6.407 | 17.00.4 |
| 12A | 5.517 | 13.30.5 |
| 12B | 7.595 | 83.14.6 |
| 6.407 | 16.71.2 | |
| 12C | 5.517 | 16.30.9 |
We found that the ACFs showed different characteristic bandwidths in different sub-spectra in the 4.5 to 8 GHz band. Table 2 shows these characteristic bandwidths from 15 stronger bursts. The measured characteristic bandwidth follows the expected across the 4.5 to 8 GHz band (see Figure 6) suggesting that the fine-scale frequency structures seen in each of these bursts are likely due to Galactic interstellar scintillation, with a few exceptions. For example, burst 11H does not appear to show characteristic bandwidth matching with the at higher frequencies. However, this could be a statistical fluctuation given the small number of scintles in the burst.
IV Discussion
IV.1 Instantaneous Burst Rate
Our detection of 21 bursts within 60 minutes represents the highest number of bursts detected within a short interval (i.e. hour timescale), with 18 bursts occurring in the first 30 minutes. We did not detect any bursts during the following 4 hours of observations, which supports the idea that FRB 121102’s bursting behavior is episodic. This could be due to intrinsic changes in the emission conditions or due to more favorable ‘plasma lensing’ conditions [7] during the first hour, potentially enhancing observed burst energies by an order of magnitude.
Our observations highlight the advantages afforded by wider instantaneous bandwidth. If our 4 GHz instantaneous bandwidth were halved, we would only have detected 10 to 12 bursts, mainly as the band-limited spectral structures they exhibit would have fallen out of band (Figure 2). [16] have also pointed out similar limitations of narrow bandwidth observations.
The spectral peak variation of each burst and apparent band-limited characteristics indicate that further bursts may be detected by searching for pulses over subbands, particularly in observations over large fractional bandwidths. The existence of spectral structure may also impact the performance of single-pulse search pipelines, which are generally designed to search for broadband pulses.
IV.2 Average spectral and temporal properties across 1 – 8 GHz


We compared the average peak flux densities of all our bursts with previously reported observations at various lower frequencies, as shown in Figure 7. We found that, statistically, the distribution of peak flux densities across frequency is consistent with being flat across GHz. It should be noted that these measurements were obtained from different telescopes at very different epochs which might affect their intrinsic absolute scaling. The different sensitivities of different telescopes at various frequencies are also highlighted in Figure 7. We also compared the burst widths at various frequencies (Figure 7) and highlight that bursts are relatively narrower at higher frequencies ( GHz).
The apparently flat spectrum of FRB 121102 stands in contrast to the steep spectral indices observed for most neutron star emission. Giant pulses from the Crab pulsar, for instance, typically exhibit a very steep spectrum with a power-law index and with a steep power-law distribution of rates at a fixed fluence [24]. Ordinary pulsars also show very steep spectra with a mean index [2]. An important exception is the radio to millimeter spectrum of magnetars. The Galactic Center magnetar, SGR J17452900, has been observed to have a flat spectrum up to 291 GHz [33]. The similarity in spectral index between FRB 121102 and radio magnetars suggests a common emission mechanism. It is likely that further high frequency observations with better sensitivity, enabling the detection of weaker bursts, may provide better constraints on the steepness of the spectral index.
If the apparently flat spectral behavior of FRB 121102 is a common property for other FRBs, we suggest that future FRB surveys could be conducted effectively at higher frequencies, utilizing either fly’s eye mode or multiple beams to compensate for a smaller field of view. Higher-frequency observations may also have lower terrestrial radio interference and larger instantaneous receiver bandwidth — potentially beneficial for detecting more of these spectrally-limited bursts. Similar suggestions were also made by [16].
IV.3 Frequency structures
The large-scale frequency structures are unlikely to be instrumental in nature and are likely intrinsic to the progenitor or propagation effects imparted in the source’s local environment. We note the similarity of these structures to the banded structures seen for the Crab giant pulses (GPs) at similar higher radio frequencies reported by [12] and [14]. We also found that burst-to-burst spectral properties change on the order of tens of seconds. If bursts from FRB 121102 have a physical origin similar to Crab GPs, then such changes are comparable to similar spectral feature variations between Crab GPs, although these manifest at a shorter timescale (few microseconds).
IV.4 High Faraday Rotation Measure
The high RM found here for FRB 121102 is almost 500 times more than RMs reported for any other FRB (e.g. Masui et al. 23) and somewhat larger than the RM of the Galactic center magnetar SGR J17452900 [10]. Our measured RM is about 10% lower than the RM from bursts detected at GHz, from data obtained seven months prior to the observations reported here. This change in the RM is already highlighted in [25]. This is a significant change in the RM and further justifies regular monitoring to clarify how the RM varies with time. SGR J17452900 also shows changes in the RM of similar scale over four years of regular monitoring [9].
The high RM suggests an intense magnetic field, of order 1 mG, in the progenitor’s environment. As noted in [25], plausible scenarios that could produce this RM include: the source being in vicinity of a intermediate mass or supermassive black-hole, like SGR J17452900 [10]; inside a powerful pulsar wind nebula, or a supernova remnant. [26] suggested that an expanding supernova shell could also cause the RM to decrease with time as reported here. However, such changes can also cause the corresponding DM to decrease with time by a similar factor, which was not observed. Other FRBs might have similar high RMs; however, measuring large RMs requires higher frequency resolution at lower frequencies (e.g. GHz) to avoid intra-channel depolarization. For example, to search for RM up to 105 rad m-2, the required channel resolution is of order tens of kHz at 1 GHz. This again highlights the utility of high-frequency observations of FRBs as intra-channel depolarization is inversely proportional to observational frequency to the third power.
V Conclusion
We have reported, for the first time, that FRB 121102 is active above 5.2 GHz. The 21 bursts detected over 60 minutes represent the highest instantaneous burst-rate yet observed. We have confirmed that bursts from FRB 121102 are highly linearly polarized, that the source shows a large RM of rad m-2, and that the diverse and variable spectral and temporal properties seen at lower frequencies are also exhibited above 5 GHz. As at lower frequencies [31, 28, 16], we also found that the source exhibits large-scale frequency structures that could be intrinsic, imparted by its local environment. These structures vary between bursts and can bias the estimation of burst properties, such as dispersion measure and pulse width as they superimpose to provide enhanced S/N at higher trial DMs. We found fine-scale structure consistent with Galactic interstellar scintillation. Future observations of this source will help to answer some of the questions yet outstanding, including whether the source exhibits any periodicity, at what frequency the apparently flat spectral index transitions and how the event rate varies as a function of frequency.
Acknowledgements
VG thanks A. Noutsos for useful comments on the draft. We would like to thank our referee, J. I. Katz for a critical review of the paper and for suggesting several improvements to the manuscript. VG would like to acknowledge NSF grant 1407804 and the Marilyn and Watson Alberts SETI Chair funds. CJL is supported by the NSF award 1611606. DM and JWTH acknowledge support from the European Research Council under the European Union’s Seventh Framework Programme (FP/2007-2013) / ERC Grant Agreement nr. 337062. JWTH also acknowledges funding from an NWO Vidi fellowship. L.G.S. acknowledges financial support from the ERC Starting Grant BEACON under contract number 279702, as well as the Max Planck Society. MAM and SBS are supported by NSF awards NSF-OIA award number 1458952. SBS, SC, JMC, TJWL, MAM, SMR, and AS are members of the NANOGrav Physics Frontiers Center supported by NSF award PHY-1430284. NG is supported by HOU for her current sabbatical leave. Breakthrough Listen is managed by the Breakthrough Initiatives, sponsored by the Breakthrough Prize Foundation (breakthroughinitiatives.org). The Green Bank Observatory is a facility of the National Science Foundation operated under cooperative agreement by Associated Universities, Inc.
References
- [1] Barsdell, B. R., Bailes, M., Barnes, D. G., & Fluke, C. J. 2012, MNRAS, 422, 379
- [2] Bates, S. D., Lorimer, D. R., & Verbiest, J. P. W. 2013, MNRAS, 431, 1352
- [3] Bhat, N. D. R., Cordes, J. M., Camilo, F., Nice, D. J., & Lorimer, D. R. 2004, ApJ, 605, 759
- [4] Chatterjee, S., Law, C. J., Wharton, R. S., et al. 2017, Nature, 541, 58
- [5] Cordes, J. M. 1986, ApJ, 311, 183
- [6] Cordes, J. M., & Lazio, T. J. W. 2002, ArXiv Astrophysics e-prints, astro-ph/0207156
- [7] Cordes, J. M., Wasserman, I., Hessels, J. W. T., et al. 2017, ApJ, 842, 35
- [8] Cordes, J. M., Weisberg, J. M., & Boriakoff, V. 1985, ApJ, 288, 221
- [9] Desvignes, G., Eatough, R. P., Pen, U. L., et al. 2018, ApJ, 852, L12
- [10] Eatough, R. P., Falcke, H., Karuppusamy, R., et al. 2013, Nature, 501, 391
- [11] Gajjar, V., Siemion, A. P. V., MacMahon, D. H. E., et al. 2017, The Astronomer’s Telegram, 10675
- [12] Hankins, T. H., & Eilek, J. A. 2007, ApJ, 670, 693
- [13] Isaacson, H., Siemion, A. P. V., Marcy, G. W., et al. 2017, PASA, 129, 054501
- [14] Jones, G. E. 2010, PhD thesis, California Institute of Technology
- [15] Lambert, H. C., & Rickett, B. J. 1999, ApJ, 517, 299
- [16] Law, C. J., Abruzzo, M. W., Bassa, C. G., et al. 2017, ArXiv e-prints, arXiv:1705.07553
- [17] Lawrence, E., Vander Wiel, S., Law, C., Burke Spolaor, S., & Bower, G. C. 2017, AJ, 154, 117
- [18] Lingam, M., & Loeb, A. 2017, ApJL, 837, L23. http://stacks.iop.org/2041-8205/837/i=2/a=L23
- [19] Lorimer, D. R., Bailes, M., McLaughlin, M. A., Narkevic, D. J., & Crawford, F. 2007, Science, 318, 777
- [20] MacMahon, D. H. E., Price, D. C., Lebofsky, M., et al. 2017, ArXiv e-prints, arXiv:1707.06024
- [21] Macquart, J.-P., & Johnston, S. 2015, MNRAS, 451, 3278
- [22] Marcote, B., Paragi, Z., Hessels, J. W. T., et al. 2017, ApJ, 834, L8
- [23] Masui, K., Lin, H.-H., Sievers, J., et al. 2015, Nature, 528, 523
- [24] Meyers, B. W., Tremblay, S. E., Bhat, N. D. R., et al. 2017, ApJ, 851, 20
- [25] Michilli, D., Seymour, A., Hessels, J. W. T., et al. 2018, Nature, 553, 182. http://www.nature.com/doifinder/10.1038/nature25149
- [26] Piro, A. L. 2016, ApJ, 824, L32
- [27] Price, D. C., Gajjar, V., Rosenthal, L., et al. 2018, ArXiv e-prints, arXiv:1802.04446
- [28] Scholz, P., Spitler, L. G., Hessels, J. W. T., et al. 2016, ApJ, 833, 177
- [29] Scholz, P., Bogdanov, S., Hessels, J. W. T., et al. 2017, ApJ, 846, 80
- [30] Spitler, L. G., Cordes, J. M., Hessels, J. W. T., et al. 2014, ApJ, 790, 101
- [31] Spitler, L. G., Scholz, P., Hessels, J. W. T., et al. 2016, Nature, 531, 202
- [32] Tendulkar, S. P., Bassa, C. G., Cordes, J. M., et al. 2017, ApJ, 834, L7
- [33] Torne, P., Desvignes, G., Eatough, R. P., et al. 2017, MNRAS, 465, 242
- [34] van Straten, W., & Bailes, M. 2011, PASA, 28, 1
- [35] van Straten, W., Demorest, P., & Oslowski, S. 2012, Astronomical Research and Technology, 9, 237
- [36] Worden, S. P., Drew, J., Siemion, A., et al. 2017, Acta Astronautica, 139, 98 . http://www.sciencedirect.com/science/article/pii/S0094576517303144