Spatially modulated susceptibility in thin film La2-xBaxCuO4
Abstract
The high critical temperature superconductor Lanthanum Barium Copper Oxide (La2-xBaxCuO4 or LBCO) exhibits a strong anomaly in critical temperature at 1/8th doping, nematicity, and other interesting properties. We report here Scanning Superconducting Quantum Interference Device (SQUID) imaging of the magnetic fields and susceptibility in a number of thin film LBCO samples with doping in the vicinity of the 1/8th anomaly. Spatially resolved measurements of the critical temperatures of these samples do not show a pronounced depression at 1/8th doping. They do, however, exhibit strong, nearly linear modulations of the susceptibility (“striae”) of multiple samples with surprisingly long periods of m. Counterintuitively, vortices trap in positions of largest diamagnetic susceptibility in these striae. Given the rich interplay of different orders in this material system and its known sensitivity to epitaxial strain, we propose phase separation as a possible origin of these features and discuss scenarios in which that might arise.
pacs
Valid PACS appear hereI Introduction
Since the discovery of high temperature superconductivity in Lanthanum Barium Copper Oxide compounds (LBCO) in 1986,[1] the cuprate perovskites and other unconventional superconductors have attracted enormous interest, not only because of their technological promise but also as a laboratory for exploring concepts in condensed matter physics. Although much progress has been made in understanding high temperature superconductivity,[2, 3, 4, 5] further development demands the empirical exploration of the properties of these materials.
Here, we have probed the phase diagram of thin film La2-xBaxCuO4 over a nominal doping range of to . La2-xBaxCuO4 is a system of unconventional superconductors that exhibit -wave superconductivity[2] at temperatures up to 35 K.[1] Along with other unconventional properties, this renders the standard Bardeen-Cooper-Schrieffer theory insufficient to explain the underlying physics and emergent phenomena of such materials. In particular, a proper account of phenomena such as nematicity,[6] pair density wave “stripes”,[7] and the one-eighth anomaly[8] pose challenges to current theories of superconductivity. Here we studied six samples of thin film LBCO with thicknesses of approximately 20 nm (see Table 1), which were grown on a nearly lattice matched substrate. We used scanning SQUID microscopy[9] to measure the magnetic fields and susceptibilities of the samples over a range of temperatures. We observed striking oscillations (“striae”) in the superconducting susceptibility and correlated the behaviors of these striae with other properties of the films.
II Experimental Methods


Our microscope implements a D.C. SQUID with small pickup loops integrated into the body of the SQUID through well-shielded coaxial superconducting leads, allowing for high spatial resolution magnetometry measurements.[11] The addition of a field coil, which is geometrically arranged on the SQUID chip such that it applies a controlled amount of magnetic flux to the sample but zero net flux to the SQUID, allows us to also simultaneously measure the samplefls magnetic response to an applied magnetic field – i.e., its magnetic susceptibility.[12]
To explore the local superconducting properties of thin film LBCO, we used a SQUID with a 0.1 m inner and 0.3 m outer pickup loop radius, and inner and outer field coil radii of 0.5m and 1.0m respectively.[13] This enabled us to spatially resolve the diamagnetism of our samples with submicron spatial resolution, thus resolving the micron-scale oscillations in the susceptibility of our samples.
The thin films of La2-xBaxCuO4 were grown using shuttered layer-by-layer[14] deposition on (100) LaSrAlO4 single crystal substrates in a reactive GENxplor VEECO molecular-beam epitaxy system. A substrate temperature of 750∘ C and an oxygen plasma background partial pressure of Torr, which was kept constant until the temperature of the substrate dropped below 150∘C, were used. Ba was evaporated using a low temperature effusion cell, and Cu and La were evaporated using high temperature effusion cells. The flux of each element was measured by a quartz crystal monitor (QCM) before the growth, and these measurements were used to determine the nominal doping. Attempts to confirm the doping with XPS led to inconsistent values, possibly due to the difficulty of making XPS measurements on such thin films. Reflection high-energy electron diffraction (RHEED)[14] was used to monitor both the phase purity and the stoichiometry during film growth. RHEED oscillations taken during fabrication of the films indicate that the samples have a smooth surface. Atomic Force Microscopy (AFM) measurements (see Fig. 2) reveal that the samples are flat except for 20 nm thick bumps dispersed over the surface. The measured samples are shown in Table 1.
We used a liquid helium scanning SQUID microscope system to image the magnetic fields and susceptibilities at different locations on our samples.[15] This microscope allowed us to vary the sample temperature over a wide range while keeping the SQUID sensor superconducting.[16]
| Sample | T | Period (m) | ||
| AC 201 | 0.090 | 22.91.1 | 0.020.005 | 2.6-2.7 |
| AC 202 | 0.098 | 5 | - | - |
| AC 173 | 0.115 | 23.70.2 | 0.230.01 | 3.4-3.8 |
| AC 174 | 0.125 | 29.20.2 | 0.260.01 | 1.0-2.6 |
| AC 200 | 0.125 | 29.71.4 | 0.020.005 | - |
| AC 175 | 0.135 | 27.80.3 | 0.170.01 | 1.2 |
III Results
III.1 Pearl length
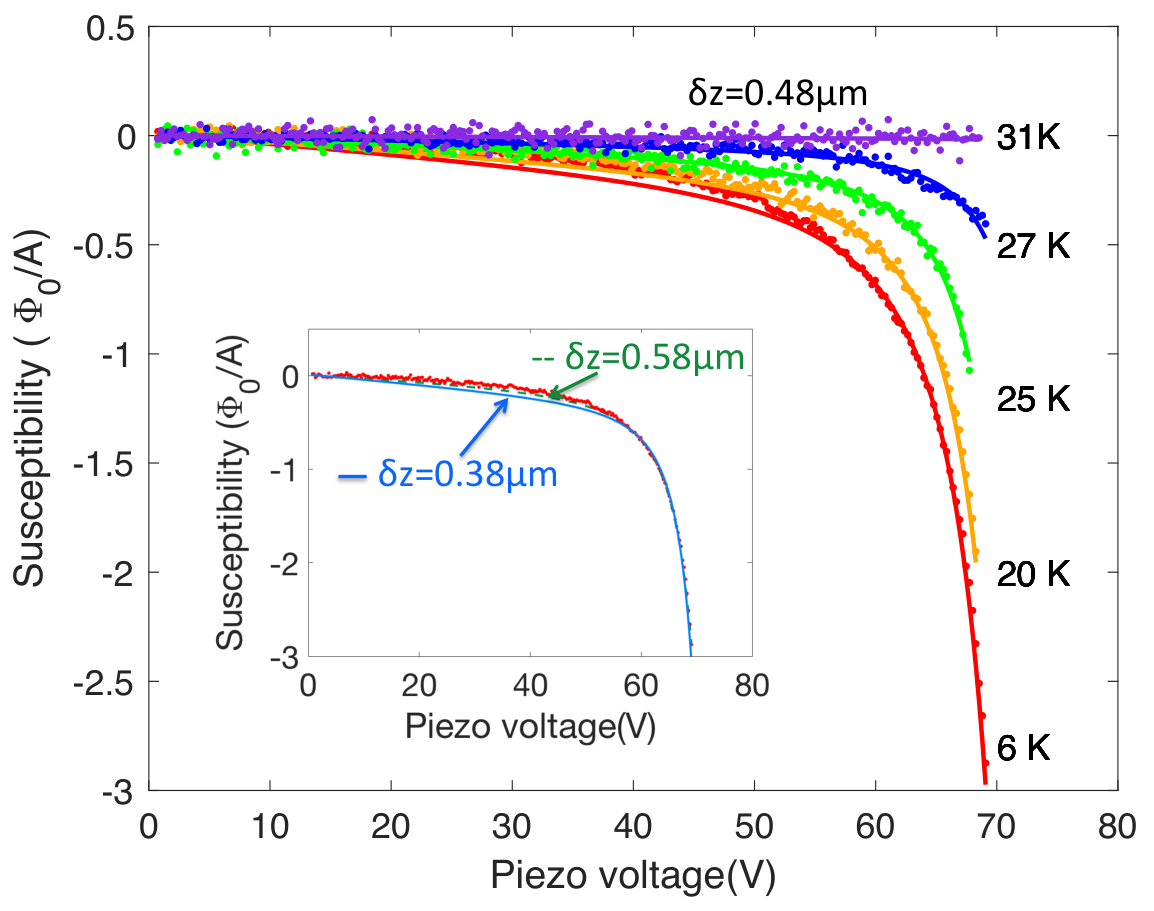
We determined the local Pearl length and critical temperature of a sample by moving it towards the SQUID using a z-piezo scanner until contact was reached while measuring the SQUID susceptibility. An example for sample AC174 (see Table 1) is shown in Fig. 3. Here a 1 mA, 928 Hz A.C. current was passed through the field coil. The resultant in-phase flux signal , where is the flux through the SQUID and is the current through the field coil, was phase sensitively detected and plotted vs. the z-piezo scanner voltage as the dots in Fig. 3. The solid lines in Fig. 3 are fits to the data using an expression appropriate for a homogeneous thin film diamagnet:[10]
| (1) |
where is a constant offset in the susceptibility, due to e.g. a mismatch in the mutual inductance between the two pairs of field coils/pickup loops, is a coefficient of a small linear slope in the approach curves, is the position of the sample when it is in direct mechanical contact with the SQUID substrate, is the mutual inductance between one field coil and one pickup loop, is the effective radius of the field coil, is the Pearl length of the thin film, and , where is the physical spacing between the sample surface and the plane of the pickup loop when the sample and SQUID surface are in contact.[10] We estimate that . The solid lines in the main panel in Fig. 3 are fits assuming . The inset of Fig. 3 shows how the fit quality changes when is varied between 0.38 and 0.58 .
The fitting parameters for the five samples which showed measurable diamagnetic shielding at 5 K are plotted as the symbols in Fig. 4. The dashed curves in Fig. 4 are guides to the eye. Estimates for and are in Table 1. Since for a homogeneous thin film and in the absence of fluctuations the Pearl length , where is the London penetration depth and is the film thickness, and the superfluid density is given by , where is the mass and is the charge of the superconducting charge carriers, it follows that , and the fitting parameter is a measure of the superfluid density .
An initially surprising result is that, although the low temperature Pearl length varies significantly from sample to sample, the measured critical temperatures of our samples do not, even though their nominal dopings span the range where a sharp drop in critical temperature is observed in bulk LBCO samples. Previous critical temperature measurements on thin film LBCO samples grown on LSAO similarly did not show a 1/8th doping anomaly.[17]
III.2 Striae in susceptibility
Our susceptibility imaging results are also surprising: we find periodic “striae” of modulated diamagnetism in the susceptibility images of multiple samples. Examples for the five samples with observable diamagnetic susceptibility at 4K are displayed in Fig. 5.

These striae are modulations of the SQUID susceptibility with amplitudes of of the total susceptibility and periods from m. In the four samples in which they are observed, they are seen in all regions of the samples imaged, but with varying orientations, periods, and amplitudes. Individual striae appear to be continuous over distances of at least 81 m (see e.g. Fig. 5d). The striae persist, with little variation in period, as the temperature is increased, up to close to the critical temperature. An example is shown in Fig. 6. In this figure simultaneously taken magnetometry images are in the left column, and susceptibility images are in the right column. The data were taken by cooling in a field of 46 T, then imaged at successively higher temperatures as labeled. The dashed lines in the susceptibility images show the positions of cross-sections displayed in Fig. 7a.

Cross-sections through the data of Fig. 6, displayed in Fig. 7a, show that although there are large, temperature dependent background features in the susceptibility, and the amplitude of the striae fall off as Tc is approached, there is little dependence of the striae periods with temperature. In an effort to better quantify the temperature dependence, we performed two-dimensional Fourier transforms of our susceptibility images. As demonstrated in Fig. 7b, these transformed images display sharp peaks corresponding to the striae. Fig. 7c plots the amplitudes, and Fig. 7d plots the periods, of these peaks as a function of temperature. A comparison with the temperature dependence of the Pearl lengths displayed in Fig. 4 shows that the striae amplitudes and periods are less sensitive to temperature than the Pearl lengths.

Although the striae periods depend weakly on temperature, there is a strong relation between striae period and low temperature Pearl length. In sample AC 174 (nominal =0.125) the critical temperature, striae period, and low temperature Pearl length all vary from position to position on the sample. An example is displayed in Fig. 8. Fig. 8a plots the Pearl lengths at two positions separated by 1 mm. Figure 8b plots the stripe period vs R/ fit values for four positions, covering a range of 0.7 mm on the sample. This figure shows that there is a nearly linear relation between the stripe period and the low temperature inverse Pearl length. This is at first surprising, since the temperature dependent measurements of e.g. Fig. 7 show little dependence of the stripe period on temperature, while our touchdown data e.g. Fig. 4 shows that the Pearl length varies strongly with temperature. This may imply that whatever controls the period, e.g. strain, also modulates the carrier density.

A final clue to the mechanism for striae formation in these samples is their orientation. We found that the stripes do not necessarily align with the crystalline axes, the orientations of the striae vary smoothly from position to position on the sample, and we have never observed boundaries between striae with different orientations.


III.3 Vortex trapping
Another surprising result is that simultaneous magnetometry and susceptibility images show that superconducting vortices trap on local maxima of the diamagnetic susceptibility. An example of this is shown in Fig. 9. The white dots in the magnetometry image in this figure are superconducting vortices trapped when the sample AC 174 (nominal =0.125) is cooled in a field of approximately 23 T. The vortex images are elongated by the point spread function of the susceptometer used.[10] Superimposed on the false-color susceptibility images are contour plots of the magnetometry data, which show that the peaks in the vortex magnetic fields line up with the most diamagnetic regions in the susceptibility images.
This striking effect occurs independently of the cooling field used. An example is shown in Fig. 10. In this figure the left column shows magnetometry data, and the right column shows susceptibility data. Each row in this figure corresponds to simultaneously acquired data, taken after the sample is cooled in fields as labeled. The centers of the vortices are labeled with white dots in both the magnetometry images and the susceptibility images, showing that the vortices are trapped where the diamagnetic susceptibility is largest, for fields from zero up to 1000 T.
IV Discussion
We report here stripe-like modulations (striae) in the susceptibility of four samples (out of five measured) of thin film La2-xBaxCuO4 with nominal dopings of . The striae have periods between one and four microns, approximately a thousand times larger than the periods of stripe phases such as the spin and charge density waves that have been measured in bulk samples using neutron and x-ray diffraction techniques.[18, 19, 20] The striae periods are, however, comparable to the Pearl lengths in our films. The observed modulations in susceptibility are up to eight percent of the full scale. Strikingly, we found that magnetic vortices tend to pin on the diamagnetic maxima of the striae, rather than the minima. The orientation of the striae relative to the crystal axes vary from sample to sample, and from position to position in the same sample.
What causes the striae? We do not believe that they are caused by modulations in film thicknesses, which would cause oscillations in our observed Pearl lengths. Room temperature AFM measurements (Fig. 2b show that the films are flat on the nm scale aside from randomly scattered 20 nm high bumps. However, our measurements are at low temperature. We know that there is a phase transition between the two temperatures, so buckling is possible. Even so, an oscillation in film thickness would not be expected to cause the vortices to trap on maxima of the diamagnetic susceptibility.
Stripe-like patterns have been observed in many systems, such as materials that undergo martensitic phase transitions and thin film type I superconductors. Martensitic phase transitions are diffusionless structural transformations of crystalline materials into highly strained lattice structures. Structural changes result from homogeneous lattice deformations, which are commonly driven by quenching or applied stress.[21] To minimize the net strain over large length scales, martensites form elaborate morphologies, such as tweed microstructures, which have domains of unilateral strain along distinct crystal axes.[22] Tetragonal tweed phases have been observed in cuprate superconductors such as YBCO single crystals.[23] Since experiments have shown that epitaxial strain can enhance local superconductivity in cuprates,[24] periodic, stripe-like domains of uniaxial strain in a martensite may induce the modulations in the Pearl length that characterize the striae. Moreover, similar stripe-like domains of alternating superconducting and normal regions have been observed in thin film type I superconductors.[25] In this case, applied magnetic fields drive the the structural separation of superconducting and normal phases.
Based on numerous previous studies on the pinning of superconducting vortices, particularly in cuprate superconductors, our observation that the vortices pin in the regions where the diamagnetic susceptibility is higher is surprising. In general, the total energy of the vortex is the energy of the superfluid part plus the energy of the core.[26] The energy of the superfluid part of the vortex must be higher in a region with higher diamagnetism,[27, 28] and generally one would expect this to be true for the core energy as well. Since we expect that vortices would be attracted to regions of reduced superfluid density, the vortex core energy in our samples must be different than expected. Given the rich competition of order parameters in the superconducting phase of La2-xBaxCuO4, it is plausible that energy contributions from sources such as strain and pair density waves to the free energy of the system render it energetically favorable for the vortices to pin on diamagnetic maxima. One model for pair density waves in superconducting vortex halos proposes that the order parameter of a pair density wave peaks at vortex cores.[29] If, for example, the condensation energy that is gained from a pair density wave is close to the condensation energy that is lost by superconductivity, the vortex core energies could be minimized at peaks of superfluid density.
V Acknowledgements
This work was primarily supported by the Department of Energy, Office of Basic Energy Sciences, Division of Materials Sciences and Engineering, under Contract No. DE-AC02-76SF00515. The AFM measurements were done by Andrey V. Malkovskiy and the XPS measurements by Chuck Hitzman at the Stanford Nano Shared Facilities (SNSF), supported by the National Science Foundation under award ECCS-1542152. The scanning SQUID microscope and sensors used in this experiment were developed with support by an NSF IMR-MIP Grant No. DMR-0957616. C.A. was supported by an Air Force Office of Scientific Research grant No. FA9550-09-1-0583.
References
- [1] J.G. Bednorz and K.A. Muller, “Possible High Tc Superconductivity in the Ba–La–Cu–O system,” Z. Phys. B Condensed Matter 64, 189–193 (1986).
- [2] C. C. Tsuei and J. R. Kirtley, “Pairing symmetry in cuprate superconductors,” Rev. Mod. Phys 72, 3377–3395 (2000).
- [3] MR Norman and C Pepin, “The electronic nature of high temperature cuprate superconductors,” Reports on Progress in Physics 66, 1547 (2003).
- [4] Patrick A Lee, “From high temperature superconductivity to quantum spin liquid: Progress in strong correlation physics,” Reports on Progress in Physics 71, 012501 (2007).
- [5] B.S. Lee, T.L. Yoon, and R. Abd-Shukor, “Theory of d-wave high temperature superconductivity in the cuprates involving non-linear lattice modes,” Journal of Superconductivity and Novel Magnetism 30, 3377–3395 (2017).
- [6] Laimei Nie, Gilles Tarjus, and Steven Allan Kivelson, “Quenched disorder and vestigial nematicity in the pseudogap regime of the cuprates,” Proceedings of the National Academy of Sciences 111, 7980–7985 (2014).
- [7] Erez Berg, Eduardo Fradkin, and Steven A Kivelson, “Charge-4e superconductivity from pair-density-wave order in certain high-temperature superconductors,” Nat. Phys. 5, 830 (2009).
- [8] M Fujita, H Goka, K Yamada, and M Matsuda, “Competition between Charge-and Spin-Density-Wave Order and Superconductivity in La1.875Ba0.125-xSrxCuO4,” Physical Review Letters 88, 167008 (2002).
- [9] JR Kirtley, “Fundamental studies of superconductors using scanning magnetic imaging,” Rep. Prog. Phys. 73, 126501 (2010).
- [10] JR Kirtley, B Kalisky, JA Bert, C Bell, M Kim, Y Hikita, HY Hwang, JH Ngai, Y Segal, FJ Walker, et al., “Scanning SQUID susceptometry of a paramagnetic superconductor,” Physical Review B 85, 224518 (2012).
- [11] JR Kirtley, MB Ketchen, KG Stawiasz, JZ Sun, WJ Gallagher, SH Blanton, and SJ Wind, “High-resolution scanning SQUID microscope,” Applied Physics Letters 66, 1138–1140 (1995).
- [12] Brian W Gardner, Janice C Wynn, Per G Björnsson, Eric WJ Straver, Kathryn A Moler, John R Kirtley, and Mark B Ketchen, “Scanning superconducting quantum interference device susceptometry,” Review of Scientific Instruments 72, 2361–2364 (2001).
- [13] John R Kirtley, Lisa Paulius, Aaron J Rosenberg, Johanna C Palmstrom, Connor M Holland, Eric M Spanton, Daniel Schiessl, Colin L Jermain, Jonathan Gibbons, Y-K-K Fung, et al., “Scanning SQUID susceptometers with sub-micron spatial resolution,” Review of Scientific Instruments 87, 093702 (2016).
- [14] J.H. Haeni, C.D. Theis, and D.G. Schlom, “RHEED Intensity Oscillations for the Stoichiometric Growth of SrTiO3 Thin Films by Reactive Molecular Beam Epitaxy,” J. Electroceram. 4, 385–391 (2000).
- [15] “Attocube scanning SQUID platform,” http://www.attocube.com/attomicroscopy/microscopy-solutions/squid/, [Accessed: 28-January-2018].
- [16] JR Kirtley, CC Tsuei, KA Moler, VG Kogan, JR Clem, and AJ Turberfield, “Variable sample temperature scanning superconducting quantum interference device microscope,” Applied Physics Letters 74, 4011–4013 (1999).
- [17] H. Sato, A. Tsukada, M. Naito, and A. Matsuda, “Absence of 1/8 anomaly in strained thin films of La2-xBaxCuO4+δ,” Physical Review B 62, R799 (2000).
- [18] M. Fujita, H. Goka, K. Yamada, J. M. Tranquada, and L. P. Regnault, “Stripe order, depinning, and fluctuations in La1.875Ba0.125Cuo4 and La1.875Ba0.075Sr0.050CuO4,” Physical Review B 70, 104517 (2004).
- [19] M. Huecker, M. V. Zimmermann, G.D. Gu, Z. J. Xu, J. S. Wen, Guanyong Xu, H. J. Kang, A. Zheludev, and Tranquada J. M., “Stripe order in superconducting La2-xBaxCuo4 for 0.095 x 0.155,” Phys. Rev. B 83, 104506 (2011).
- [20] J. M. Tranquada, “Exploring intertwined orders in cuprate superconductors,” Physica B 460, 136–140 (2014).
- [21] “IUCr martensitic phase transformations: the memory of shape,” https://www.iucr.org/news/newsletter/volume-7/number-2/martensitic-transformations, accessed: 2018-03-15.
- [22] James P. Sethna, Entropy, Order Parameters, and Complexity (Clarendon Press, Oxford, 2017) p. 250.
- [23] W.Y. Liang, C.T. Lin, J. Chrosch, Y. Yan, and E.K.H. Salje, Advances in Superconductivity VII 1, 137–140 (1995).
- [24] J.-P. Locquet, J. Perret, J. Fompeyrine, E. Mächler, J. W. Seo, and G. Van Tendeloo, “Doubling the critical temperature of La1.9Sr0.1CuO4 using epitaxial strain,” Nature 394, 453–456 (1998).
- [25] Michael Seul and David Andelman, “Domain shapes and patterns: The phenomenology of modulated phases,” Science 267, 476–483 (1998).
- [26] Gianni Blatter, Mikhail V Feigel’man, Vadim B Geshkenbein, Anatoly I Larkin, and Valerii M Vinokur, “Vortices in high-temperature superconductors,” Reviews of Modern Physics 66, 1125 (1994).
- [27] J Pearl, “Current distribution in superconducting films carrying quantized fluxoids,” Applied Physics Letters 5, 65–66 (1964).
- [28] Gilson Carneiro and Ernst Helmut Brandt, “Vortex lines in films: Fields and interactions,” Physical Review B, volume=61, number=9, pages=6370, year=2000, publisher=APS .
- [29] Yuxuan Wang, Stephen Edkins, Mohammad H. Hamidian, J. C. Seamus Davis, Eduardo Fradkin, and Steven A. Kivelson, arXiv:1204.1234.