Supporting Material
Tunable Semiconductors: Control over Carrier States and Excitations in Layered Hybrid Organic-Inorganic Perovskites
Chi Liu
Affiliation: Department of Chemistry, Duke University, Durham, North Carolina 27708, USA
William Huhn
Affiliation: Department of Mechanical Engineering and Materials Science, Duke University, Durham, North Carolina 27708, USA
Ke-Zhao Du
Affiliation: Department of Mechanical Engineering and Materials Science, Duke University, Durham, North Carolina 27708, USA
Alvaro Vazquez-Mayagoitia
Affiliation: Argonne Leadership Computing Facility, 9700 S. Cass Avenue, Lemont IL 60439, USA
David Dirkes
Affiliation: Department of Chemistry, University of North Carolina, Chapel Hill, North Carolina 27599, USA
Wei You
Affiliation: Department of Chemistry, University of North Carolina, Chapel Hill, North Carolina 27599, USA
Yosuke Kanai
Affiliation: Department of Chemistry, University of North Carolina, Chapel Hill, North Carolina 27599, USA
David B. Mitzi
Affiliation: Department of Mechanical Engineering and Materials Science, Duke University, Durham, North Carolina 27708, USA
Affiliation: Department of Chemistry, Duke University, Durham, North Carolina 27708, USA
Email: david.mitzi@duke.eduVolker Blum
Affiliation: Department of Mechanical Engineering and Materials Science, Duke University, Durham, North Carolina 27708, USA
Affiliation: Department of Chemistry, Duke University, Durham, North Carolina 27708, USA
Email: volker.blum@duke.edu
August 24, 2026
Short Description
This Supplemental Material includes: structural details of the perovskites in our
simulations; energetic impact of the supercell choice; impact of spin-orbit
coupling in the reported energy band structures; computational details (basis
sets and k-space grid convergence); validation of computational protocols by
comparing to experimental results for MAPbI3, for AE4TPbBr4 and for
AE4TPbI4; experimental details for the synthesis and characterization of a
new AE4TPbI4 crystal; and additional computed orbitals, energy band
structures, band curvature parameters, full and partial densities of states
supporting the general findings demonstrated in the actual paper.
Computational validation for MAPbI3 also includes comparison to a more
sophisticated many-body dispersion treatment.[1] Synthesis
details include Refs. [2, 3, 4]. All computational input
and output files (raw data) are available at the NOMAD repository.[5]
I (22) supercell of AE4TPbBr4
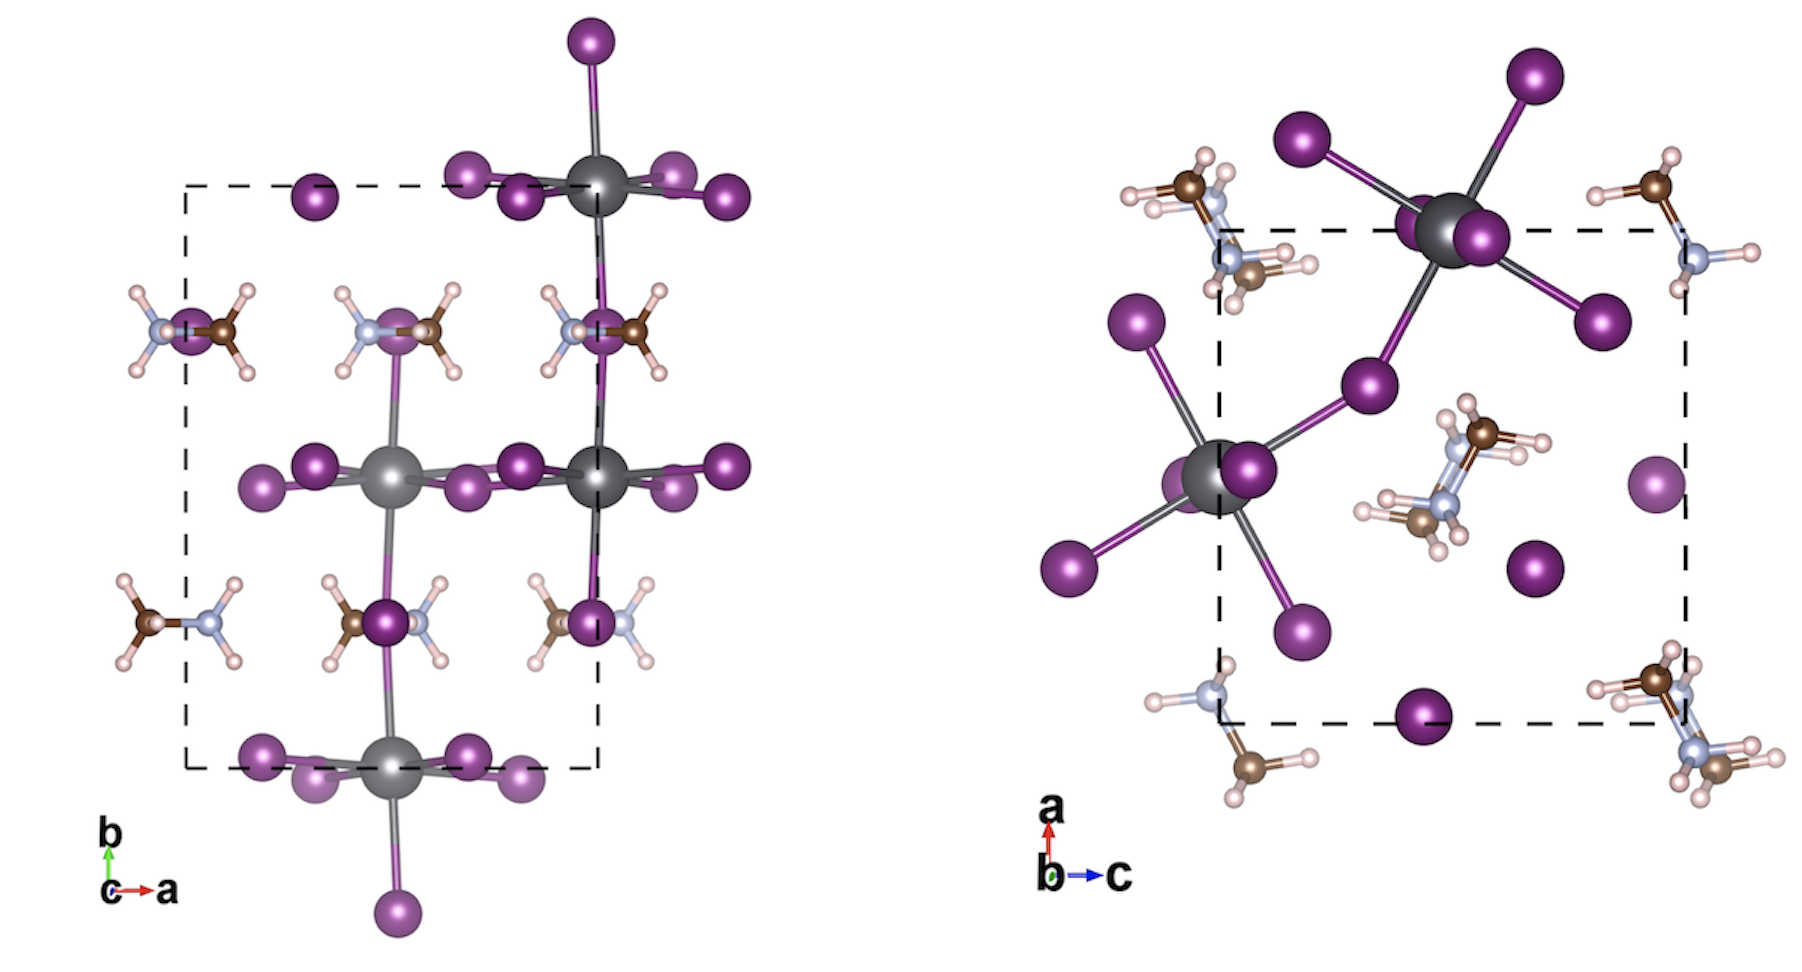
Figure S1: Experimental structure of AE4T viewed along the -axis direction, adapted from Ref. [6]. Only the framework and the are shown for clarity. Two different configurations for the lead bromide framework and the ammonium tail can be seen arranged in an alternating fashion. Solid lines indicate the (22) cell in units of the hypothetical basic perovskite unit cell dimension, which is used as the basic structural unit in all calculations reported in the present work. The dashed line delineates the (12) unit cell model (which contained split atomic positions) as used in the X-ray refinement of AE4T in Ref. [6].
II Comparison of (22) and (12) structure models relaxed by DFT-PBE+TS
II.1 Nomenclature of Pb-X-Pb bond angles (X = Cl, Br, I)
Figure S2: Illustration of the Pb-X-Pb (X = Cl, Br, I) angles
investigated in this paper for all hybrid compounds. The PBE+TS
relaxed structure of AE4T is viewed from the
direction. Only the Pb-X inorganic framework and the
tails are shown for clarity. All other hybrid compounds
discussed in this paper can be understood similarly. Two
distinct inorganic layers are identified [e.g., see
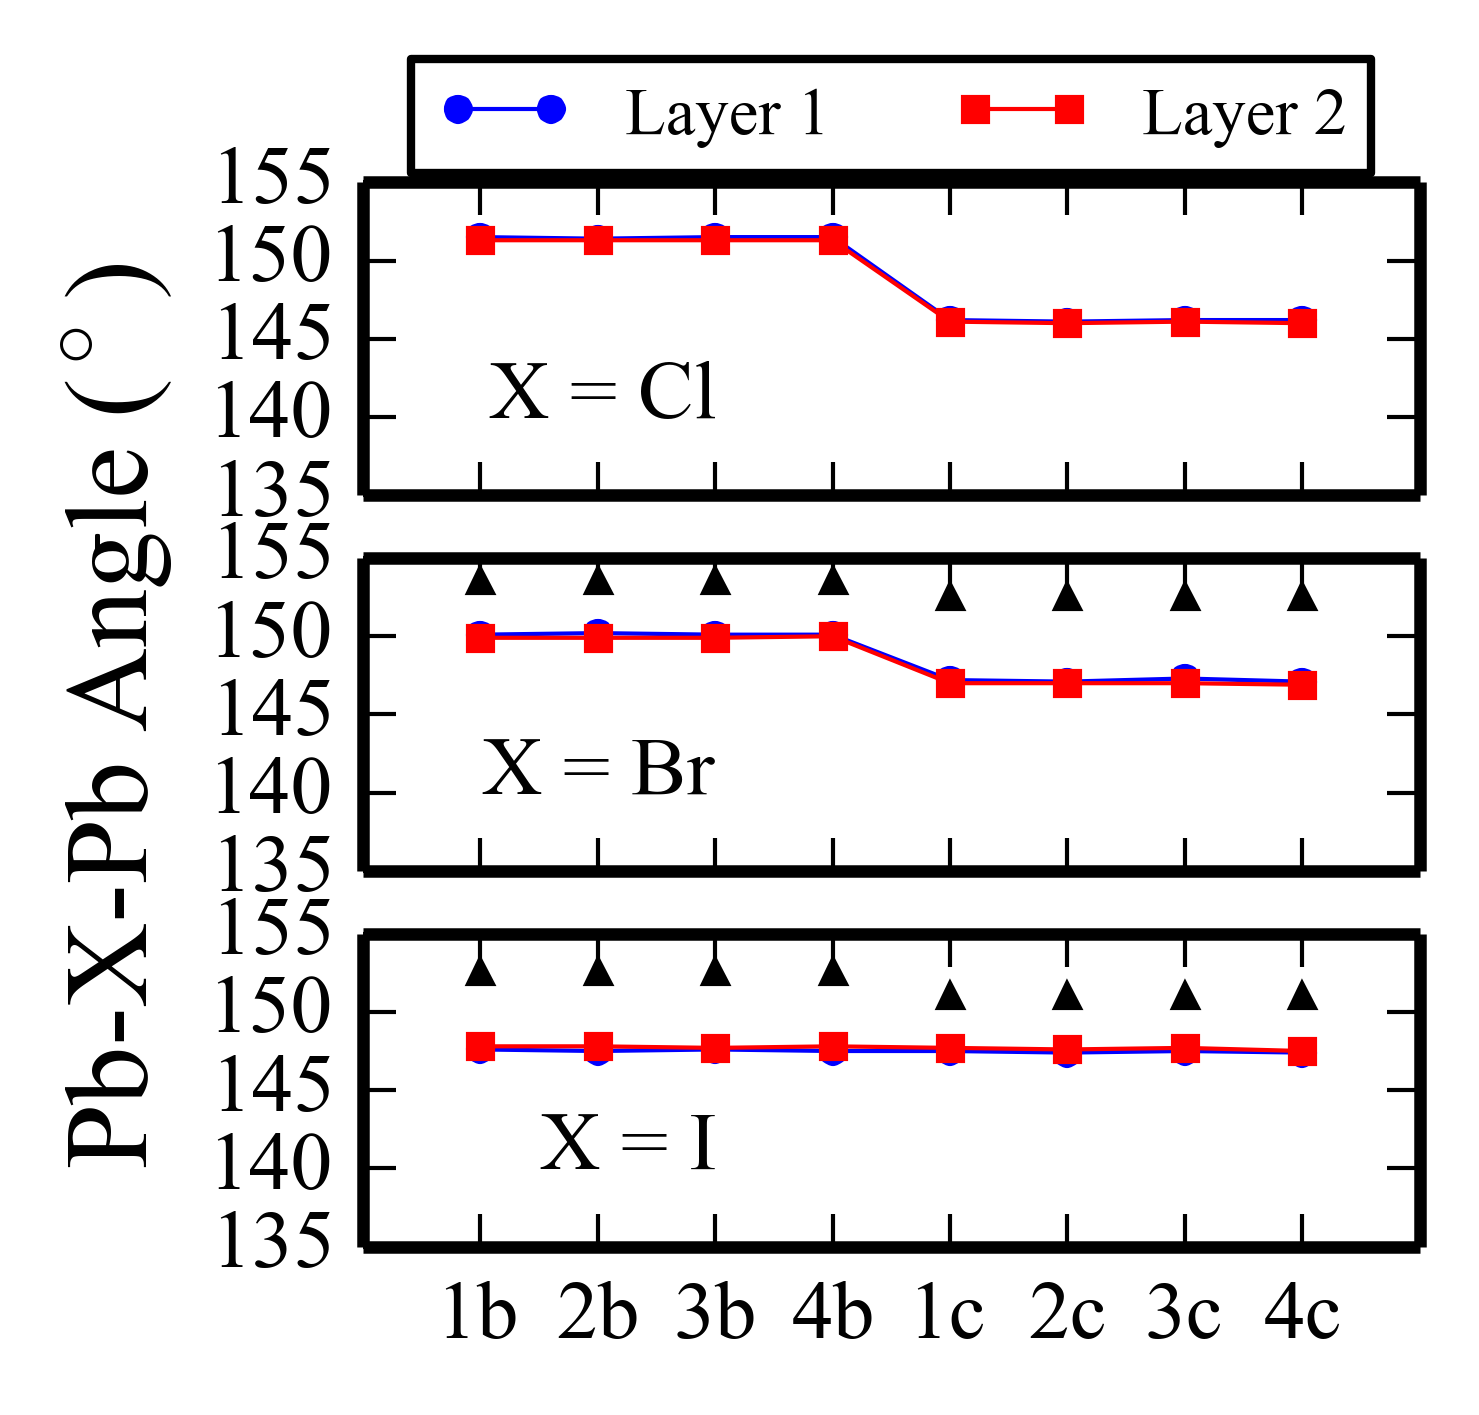
Fig. 1(a) in the main text] and labeled as layer 1 and layer 2. Each layer contains four octahedra (those inside the black solid line). There is one Pb-X-Pb angle along the direction and one along the direction for each octahedron. Therefore 8 distinct Pb-X-Pb angles exist for each inorganic layer, labeled as 1, 2, 3, 4 for and directions, respectively.Figure S3: Pb-X-Pb (X = Cl, Br, I) angles for AE4T(X = Cl, Br, I) HOIPs relaxed by DFT-PBE+TS using a (22) unit cell. The experimental angle values for AE4T and AE4T are indicated by black triangles. No experimental data are available for the X = Cl compound.Figure S4: Pb-X-Pb (X = Cl, Br, I) angles for AE4T(X = Cl, Br, I) HOIPs relaxed by DFT-PBE+TS using the (12) model unit cell. The experimental angle values for AE4T and AE4T are indicated by black triangles.
II.2 PBE+TS total energy
Table S1: The PBE+TS total energy difference (E(22) - E(12)) of the PBE+TS predicted structure using the (12) and (22) unit cells for the syn-anti-syn AE4T (X = Cl, Br, I) and the all-anti AEnT (n = 2, 3, 4, 5). K-point grids settings of 142 were used for the (12) calculation, whereas 122 k-point grids were used for the (22) calculation. The FHI-aims “tight” numerical defaults (Table S2) were used for both calculations. The total energy of the syn-anti-syn AE4T is 2.44 eV/cell lower than that of the all-anti AE4T compound (both in a (2x2) configuration).
Compounds
Energy Difference (eV)
AE4T
-2.49
AE4T
-2.70
AE4T
-2.73
AE2T
-3.76
AE3T
-0.79
all-anti-AE4T
-1.50
AE5T
-0.83
III Effect of spin orbit coupling
Figure S5: (a) and (b) show the electronic band structures of AE4T with the states of Pb-6p identified by Mulliken decompositions of the bands, calculated by DFT-HSE06+SOC and DFT-HSE06 without including SOC, respectively. The width of the colored lines is proportional to the Mulliken decomposition value of species or (in the case of Pb 6p) atomic orbitals of species they represent. Thus, wider colored lines correspond to bands having more contribution from the species or atomic orbitals of the species that the Mulliken decomposition is projected onto. The VBM and CBM are indicated by black arrows with the value of the band gap indicated.
IV Computational basis settings: tight
Table S2: Basis functions (radial functions) in the “tight” computational settings used for the DFT-PBE+TS relaxation for H, C, N, O, S, Cl, Br, I and Pb elements.
H
C
N
S
minimal
1s
[He]+2s2p
[He]+2s2p
[Ne]+3s3p
tier 1
H(2s,2.1)
H(2p,1.7)
H(2p,1.8)
S2+(3d)
H(2p,3.5)
H(3d,6.0)
H(3d,6.8)
H(2p,1.8)
H(2s,4.9)
H(3s,5.8)
H(4f,7)
S2+(3s)
tier 2
H(1s,0.85)
H(4f,9.8)
H(4f,10.8)
H(4d,6.2)
H(2p,3.7)
H(3p,5.2)
H(3p,5.8)
H(5g,10.8)
H(2s,1.2)
H(3s,4.3)
H(1s,0.8)
H(3d,7.0)
H(5g,14.4)
H(5g,16)
H(3d,6.2)
H(3d,4.9)
Cl
Br
I
Pb
minimal
[Ne]+3s3p
[Ar]+4s4p3d
[Kr]+5s5p4d
[Xe]+6s6p5d4f
tier 1
Cl2+(3d)
H(3d,4.6)
H(3d,4)
H(3p,2.3)
H(2p,1.9)
H(2p,1.7)
H(4f,6.4)
H(4f,7.6)
H(4f,7.4)
H(4f,7.6)
H(2p,1.6)
H(3d,3.5)
Cl2+(3s)
Br2+(4s)
I2+(5s)
H(5g,9.8)
H(5g,10.4)
H(3s,3.2)
tier 2
H(3d,3.3)
The first line (“minimal”) summarizes the free-atom radial functions used (noble-gas configuration of the core and quantum numbers of the additional valence radial functions). “H(nl, z)” denotes a hydrogen-like basis function for the bare Coulomb potential z/r, including its radial and angular momentum quantum numbers, n and l. X2+(nl) denotes a n, l radial function of a doubly positive free ion of species X. This nomenclature follows the convention employed in Table 1 of Ref. [7].
V K-grid convergence test
Table S3: DFT-PBE total energy convergence with different k-grid settings for reciprocal-space integrals of AE4T.
K-grid
(eV)
(meV/atom)
122
0*
0*
244
-0.066
-0.16
* reference value
VI Computational basis settings: intermediate
Table S4: Basis functions (radial functions) in the “intermediate” computational settings used for the DFT-HSE06+SOC calculation for H, C, N, O, S, Cl, Br, I and Pb elements.
H
C
N
S
minimal
1s
[He]+2s2p
[He]+2s2p
[Ne]+3s3p
tier 1
H(2s,2.1)
H(2p,1.7)
H(2p,1.8)
S2+(3d)
H(2p,3.5)
H(3d,6.0)
H(3d,6.8)
H(2p,1.8)
H(2s,4.9)
H(3s,5.8)
H(4f,7)
S2+(3s)
tier 2
H(1s,0.85)
H(4f ,9.8)
H(4f,10.8)
H(5g,10.8)aux
H(3d,7.0)aux
H(5g,14.4)aux
H(5g,16)aux
Cl
Br
I
Pb
Minimal
[Ne]+3s3p
[Ar]+4s4p3d
[Kr]+5s5p4d
[Xe]+6s6p5d4f
tier 1
Cl2+(3d)
H(3d,4.6)
H(3d,4)
H(3p,2.3)
H(2p,1.9)
H(2p,1.7)
H(4f,6.4)
H(4f,7.6)
H(4f,7.4)
H(4f,7.6)
H(2p,1.6)
H(3d,3.5)
Cl2+(3s)
Br2+(4s)
I2+(5s)
H(5g,9.8)aux
H(5g,10.4)
H(3s,3.2)
tier 2
H(3d,3.3)
H(5g,10.8)aux
H(5g,10.4)aux
H(5g,9.4)aux
The first line (“minimal”) summarizes the free-atom radial
functions used (noble-gas configuration of the core and quantum
numbers of the additional valence radial functions). “H(nl, z)”
denotes a hydrogen-like basis function for the bare Coulomb
potential z/r, including its radial and angular momentum quantum
numbers, n and l. X2+(nl) denotes a n, l radial
function of a doubly positive free ion of species X. This
nomenclature follows the convention employed in Table 1 of
Ref. [7]. The subscript “aux” denotes a
basis function that is not used to expand the actual,
generalized Kohn-Sham orbitals but that is used during the
creation of the auxiliary basis sets that expand the screened
Coulomb operator of the HSE06 functional, following the method
described in Ref. [8].
Figure S6: (a) Structure of the low-temperature orthorhombic phase of from two different perspectives, fully relaxed by DFT-PBE+TS. (b) Lattice parameters and unit cell volume relaxed at different levels of DFT (PBE[12], PBE+TS[13] and PBE+MBD[1]), their deviation from experiment (neutron powder diffraction at =100 K in Ref. [9]) and their impact on the predicted band gap by DFT-HSE06 including spin-orbit coupling (SOC) compared with the experimental value. The experimental band gap values shown reflect the apparent near-band-edge emission of orthorhombic observed at =10 K by time-resolved photoluminescence in Ref. [10] and the optical transient absorption peak attributed to near-band-edge emission of orthorhombic at =15 K in Ref. [11]. PBE+MBD stands for a more recent and more sophisticated many-body dispersion (MBD) scheme compared with PBE+TS to incorporate the vdW terms.[1] This comparison demonstrates that key parameters for remain unaffected by switching between the two different dispersion treatments.
VIII Optimized structures of AE4TPbX4 (X = Cl, Br, I)
Table S5: Computationally predicted unit cell parameters of AE4T(X = Cl, Br, I) relaxed by DFT-PBE+TS. The experimental structure refinements for AE4T[6] and AE4T(this work) are shown for comparison.
* see Section S8, “Experimental details for AE4T”, in this work.
IX Construction of the computational structure models of the HOIP compounds assessed in this work
We perform full relaxation of both unit cell parameters and cell-internal atomic coordinates on the initial input structure for all the HOIPs investigated. Initial models for the structure optimization were constructed as follows:
•
AE4T: Taken as the experimental structure in Ref. [6].
•
AE4T (X = Cl, I): Obtained by taking the experimental structure of AE4T and replacing the Br atoms with Cl and I. The lattice parameters and the atomic coordinates of non-halogen atoms were kept the same among the three hybrid compounds for the input structure. The initial configuration of AE4T molecules was kept to be syn-anti-syn as in the experimental structure of AE4T.
•
all-anti-AE4T: Obtained by taking the experimental structure of AE4T and changing the configuration of AE4T to all-anti. The inner two thiophene rings of the syn-anti-syn AE4T were rotated by 180∘ around the two C atoms labeled by red “+” as the rotation axis (Fig. S7). This rotation was performed for all the 8 AE4T molecules in the unit cell.
Figure S7: Structure of the AE4T molecule in the experimental structure of AE4T adopting the syn-anti-syn configuration.
•
AEnT (n = 1, 2, 3, 5): Obtained by taking the experimental structure of AE4T and replacing the AE4T organic part by all-anti AEnT molecules. Using AE3T- as an example, we start from the experimental structure of AE4T with syn-anti-syn AE4T molecules. The oligothiophene part (4T) is removed while the inorganic Pb-Br framework together with the tails are kept–i.e., the configuration of the Pb-Br framework together with the tails is not changed during the construction. The adjacent inorganic layers are then pushed towards each other to reduce the distance between them to the extent that it is suitable for the insertion of the 3T molecules (all-anti). We then place the optimized 3T molecules into those positions where the 4T molecules originally existed (for AE4T). This construction process preserves the configuration between the inorganic Pb-Br framework and the tails (Fig. S1) and keeps the two inorganic layers in each unit cell identical.
X Experimental details for AE4T
Figure S8: Crystal of AE4T
Chemical. (99.999% trace metal basis), HI (57 wt. % in , with hypophosphorous acid as stabilizer, assay 99.95%) and N,N-Dimethylformamide (anhydrous, 99.8%) were purchased from Sigma-Aldrich company. AE4THI was synthesized in the lab.[2, 3, 4] 2-butanol (99.5%) was purchased from VWR International.
Synthesis. 2 mg and 3 mg AE4THI were dissolved in 0.7 ml DMF with a drop of HI. Then, 2 ml 2-butanol was layered on the top of the solution (Figure S8a). The target crystals came out after several days (Figure S8b).
Characterization. Single crystal X-ray diffraction data were collected in a Bruker D8 ADVANCE Series II at room temperature. The unit cell parameters determined from this data are a = 38.779(3) Å, b = 6.0863(5) Å, c = 12.3306(10) Å, = 92.271(4), V = 2908.0(4) Å3, C2/c.
XI DFT-HSE06+SOC frontier orbitals for AE4TPbX4 (X=Cl, Br, I)
Figure S9: Frontier orbitals of the organic and inorganic components of
AE4T at the point, predicted by
DFT-HSE06+SOC. The real and imaginary parts of the spin up and spin
down channels of each spin-orbit coupled orbital are shown. Orbital
energy values are given with respect to the overall HOMO energy as
the energy zero. The Mulliken charge decomposition ratio of the
organic component (C, H, N, S) over the inorganic component (Pb, Cl)
is given. For each orbital type (organic/inorganic HOMO/LUMO), only
one of two or more degenerate orbitals is shown. Individual orbitals
can extend across equivalent parts of the structure in different
ways since they can be linearly combined with their degenerate
counterparts.Figure S10: Frontier orbitals of the organic and inorganic components of AE4T at the point, predicted by DFT-HSE06+SOC. The real and imaginary parts of the spin up and spin down channels of each spin-orbit coupled orbital are shown. Orbital energy values are given with respect to the overall HOMO energy as the energy zero. The Mulliken charge decomposition ratio of the organic component (C, H, N, S) over the inorganic component (Pb, Br) is given.Figure S11: Frontier orbitals of the organic and inorganic components of
AE4T at the point, predicted by DFT-HSE06+SOC. The
real and imaginary parts of the spin up and spin down channels of
each spin-orbit coupled orbital are shown. Orbital energy values are
given with respect to the overall HOMO energy as the energy
zero. The Mulliken charge decomposition ratio of the organic
component (C, H, N, S) over the inorganic component (Pb, I) is
given. For each orbital type (organic/inorganic HOMO/LUMO), only
one of two or more degenerate orbitals is shown. Individual orbitals
can extend across equivalent parts of the structure in different
ways since they can be linearly combined with their degenerate
counterparts.
XII DFT-HSE06+SOC band structures of AEnTPbBr4 (n = 1, 2, 3, 4, 5)
Figure S12: Band structures of AEnT (n = 1, 2, 3, 4, 5) with
all-anti configuration of oligothiophene calculated by HSE06+SOC
with the bands of Pb and Br (determined by Mulliken decompositions)
colored on the band plot. The VBM and CBM are indicated by black
arrows. For each orbital type (organic/inorganic HOMO/LUMO), only
one of two or more degenerate orbitals is shown. Individual orbitals
can extend across equivalent parts of the structure in different
ways since they can be linearly combined with their degenerate
counterparts.
XIII HOMO-LUMO Gaps of isolated oligothiophene molecules
Figure S13: Calculated HOMO and LUMO levels of the isolated oligothiophene molecules, =1-5, with unprotonated C2H5NH2 terminations.
XIV Effective Mass Parameters Derived from the Band Structures Computed in This Work
Table S6: Here and in Table S7, we provide anisotropic
band curvatures (in effective mass units, )
at the point, derived from the HSE06+SOC computed
energy band structures for all compounds addressed in this work.
For each material, separate band curvatures are given for the HOMO
and the LUMO of the organic and the inorganic component. The
absolute VBM and CBM of each material are marked with ∗ symbols
in the table. Corresponding band structure diagrams can be found in
Figure 2 (main paper) and in Figure S12 of this supporting
information. The curvature parameters were determined by parabolic
fits to individual bands at the
points, in the directions parallel to the coordinate axes
[see Figure 2(a) in the main paper], with small spacings of
the fitted points of 0.01 or 0.02 , where
is the Bohr radius. The curvature parameters thus correspond to
the diagonal elements of the effective mass tensor in this
coordinate system, without a diagonalization of the effective mass
tensor. Nevertheless, the diagonal elements give a clear qualitative
indication of the band curvatures in the organic and
inorganic components of each material considered. Large effective
mass values correspond to essentially flat bands at the
point and are unlikely to be meaningful in the context of band-like
transport; values above 20 are therefore not further detailed
in the table.
Material
Direction
HOMO (inorg.)
HOMO
(org.)
LUMO
(inorg.)
LUMO (org.)
AE4TPbCl4
-X
20
20∗
20∗
20
-Y
0.42
20∗
0.32∗
1.38
-Z
0.46
2.66∗
0.43∗
6.8
AE4TPbBr4
-X
20
20∗
20∗
20
-Y
0.31
20∗
0.26∗
1.57
-Z
0.33
2.23∗
0.31∗
15.9
AE4TPbI4
-X
17.3
20∗
20∗
20
-Y
0.27
20∗
0.22∗
7.6
-Z
0.27
11.4∗
0.22∗
9.0
Table S7: Here and in Table S6, we provide anisotropic
band curvatures (in effective mass units, )
at the point, derived from the HSE06+SOC computed
energy band structures for all compounds addressed in this work. See
caption of Table S6 for details.
Material
Direction
HOMO (inorg.)
HOMO
(org.)
LUMO (inorg.)
LUMO (org.)
AE1TPbBr4
-X
11.1∗
5.1
20∗
20
-Y
0.37∗
4.6
0.23∗
0.97
-Z
0.38∗
1.7
0.44∗
1.08
AE2TPbBr4
-X
20
20∗
20∗
6.9
-Y
0.33
7.5∗
0.23∗
16.9
-Z
0.37
1.2∗
0.36∗
2.9
AE3TPbBr4
-X
20
20∗
20∗
20
-Y
0.38
20∗
0.24∗
2.8
-Z
0.39
1.9∗
0.55∗
20
AE4TPbBr4 (all-anti)
-X
16.3
20∗
20∗
20
-Y
0.40
5.6∗
0.24∗
2.3
-Z
0.39
1.1∗
0.35∗
20
AE5TPbBr4
-X
20
20∗
20∗
20
-Y
0.55
7.3∗
0.24∗
5.5
-Z
0.54
1.2∗
0.55∗
2.8
XV Total and Partial Densities of States
Figure S14: Total densities of states (DOS) and element-projected DOS based on the DFT-HSE06+SOC for the HOIPs AE4T(X = Cl, Br, I). K-point grids settings of 333 were used in the DOS calculation. The Gaussian broadening parameter was 0.1 eV. The VBMs and CBMs are set to zero energy in each plot, with the actual band gap omitted. Band gap values are labeled in each subplot. The element-projected DOS is shown by different colors: magenta for Pb, green for halogens Cl, Br, I, and blue for organic component AE4T. The sum of all colored components is the total DOS, indicated by the outermost curve. in the Y axis label represents the volume of unit cell for each compound.Figure S15: Total densities of states (DOS) and element-projected DOS based on the DFT-HSE06+SOC for the HOIPs AEnT (n = 1, 2, 3, 4, 5) with all-anti AEnT molecules. See caption of Fig. S14 for details.