A systematic study of the condensation of the corona and the application for correlation in luminous active galactic nuclei
Abstract
In this paper, we explained the observed correlation in luminous active galactic nuclei within the framework of the condensation of the corona around a supermassive black hole (Liu et al., 2015; Qiao & Liu, 2017). Specifically, we systemically test the effects of black hole mass , the viscosity parameter , and the magnetic parameter (with magnetic pressure , ) on the structure of the accretion disc and the corona, as well as the corresponding emergent spectra. It is found that the hard X-ray photon index nearly does not change with changing black hole mass , or changing magnetic parameter . Meanwhile, it is found that the geometry of the accretion flow, i.e., the relative configuration of the disc and corona, as well as the emergent spectra can be strongly affected by changing the value of . By comparing with a sample composed of 29 luminous active galactic nuclei with well constrained X-ray spectra and Eddington ratios, it is found that the observed correlation can be well matched with a relatively bigger value of , i.e., , as previously also suggested by Narayan (1996) for luminous accreting black holes.
Keywords:
accretion, accretion discs – black hole physics – galaxies: active1 Introduction
The multi-band observations for the luminous active galactic nuclei (AGNs) support that the accretion flow around the central supermassive black hole exists in the form of a disc-corona structure (Haardt & Maraschi, 1991; Haardt & Maraschi, 1993; Svensson & Zdziarski, 1994; Stern et al., 1995, e.g.). The optical/ultraviolet (UV) emission is often explained to be from the cool disc extending down to the innermost stable circular orbits (ISCO) of the black hole, while X-ray emission is often explained to be from the inverse Compton scattering of the optical/UV photons from the disc in the hot corona above (Magdziarz et al., 1998; Gierliński & Done, 2004; Piconcelli et al., 2005; Vasudevan & Fabian, 2007; Vasudevan & Fabian, 2009; Fabian et al., 2015; Lusso & Risaliti, 2017, e.g.). In such a scenario, a long-standing problem is that how the hot corona is formed and heated. In the previous disc-corona models, it was often needed to assume a large fraction of the accretion energy to be released in the corona to explain the observed strong X-ray emissions in luminous AGNs, including the bright Seyfert galaxies and quasars (Haardt & Maraschi, 1991; Haardt & Maraschi, 1993; Svensson & Zdziarski, 1994; Stern et al., 1995; Dove et al., 1997, e.g.). Currently, a promising mechanism for the heating of the corona is the magnetic reconnection (Di Matteo, 1998; Merloni & Fabian, 2001; Liu et al., 2002; Liu et al., 2003; Kawanaka et al., 2005; Uzdensky & Goodman, 2008; Cao, 2009, e.g.). The electron distribution in the corona is very likely to have a non-thermal tail (i.e., to be hybrid) due to the magnetic reconnection (Poutanen & Coppi, 1998; Coppi, 1999; Poutanen & Veledina, 2014; Poutanen et al., 2017). By means of large-scale particle-in-cell (PIC) simulations in both 2D and 3D, Sironi & Spitkovsky (2014) believed that they have provided a definitive evidence for the non-thermal particle acceleration via magnetic reconnection, which has very important implications for understanding the generation of the hard particle spectra in relativistic astrophysical plasmas. So far, a great of very important progresses have been achieved to establish the disc and the corona via magnetohydrodynamic (MHD) simulations (Miller & Stone, 2000; Hirose et al., 2006; Loureiro et al., 2012; Bai & Stone, 2013; Fromang et al., 2013; Uzdensky, 2013; Takahashi et al., 2016, e.g.). However, it is still difficult to compare the results of MHD simulations with the observed spectra. Some papers, such as Jiang et al. (2014) estimated the fraction of the accretion energy dissipated in the coronal region above the accretion disc based on the three-dimensional radiation MHD simulations. They found that the maximum fraction of the accretion energy dissipated in the corona is only 3.4%, which can not explain the strong X-ray emissions observed in luminous AGNs (Elvis et al., 1994; Shang et al., 2005; Vasudevan & Fabian, 2007; Vasudevan & Fabian, 2009, e.g.).
In order to explain the origin of the strong X-ray emissions in luminous AGNs, and avoid the complicated processes of the magnetic reconnection, a hot accretion model was proposed by Liu et al. (2015). In this model, it is assumed that, initially, beyond the Bondi radius, a vertically extended hot coronal gas is supplied to the central black hole by capturing the interstellar medium and the hot stellar wind. In Liu et al. (2015), the hot corona is described as the self-similar solution of the advection-dominated accretion flows (ADAF) (Narayan & Yi, 1994) . The ADAF is a two-temperature hot accretion flow, in which the ions are directly heated by the general viscous heating, and the electrons are heated by the ions via Coulomb collision (Narayan & Yi, 1995) . Since the angular velocity of the ADAF solution is intrinsically sub-Keplerian, the viscous time scale is much shorter than that of the cooling time scale in ADAF solution (Narayan & McClintock, 2008; Yuan & Narayan, 2014, for review). In this case, generally the hot coronal gas will be accreted directly towards the central black hole instead of collapsing locally immediately. Specifically, there exists a critical mass accretion rate . For , the hot coronal gas flows towards the black hole until at a critical radius (in units of Schwarzschild radius , with ), a fraction of the hot coronal gas begins to condense to the equatorial plane of the black hole, forming an inner disc. Then these gases will be accreted in the form of a disc-corona structure extending down to the ISCO of the black hole, maintaining a relatively stronger X-ray emissions. For , the gases will be accreted in the form of a pure ADAF without condensation. The size of the inner disc increases with increasing . For clarity, one can refer to Fig. 1 in Qiao & Liu (2017) for the schematic description of the model. The model of the condensation of the hot corona predicts a very different geometry of the accretion flow, which preliminarily has been employed to explain the observed correlation between the X-ray slope and the Compton reflection scaling factor in luminous AGNs (Qiao & Liu, 2017). Meanwhile, it is shown that, although geometrically the size of the hot corona is very extended in the radial direction, more than of the hard X-rays are emitted in a very small region less than Schwarzschild radii from the view point of radiation, which is consistent with the X-ray mapping observations for estimating the size of the corona in luminous AGNs (Liu et al., 2017; Reis & Miller, 2013; Fabian et al., 2015, e.g.).
Observationally, it is found that there is an anti-correlation between the hard X-ray photon index and Eddington ratio (with ) for in low-luminosity AGNs, which is simply interpreted in the framework of ADAF solution (Gu & Cao, 2009; Younes et al., 2011; Emmanoulopoulos et al., 2012; Hernández-García et al., 2013; Hernández-García et al., 2014, e.g.). While separately it is found that there is a positive correlation between and for 11 1 Please note that in different literatures the authors use different methods to estimate the bolometric luminosity , which can have obvious effect on the slope of the correlation. One can refer to the references we list for details. in luminous AGNs, (Lu & Yu, 1999; Porquet et al., 2004; Wang et al., 2004; Shemmer et al., 2006; Saez et al., 2008; Sobolewska & Papadakis, 2009; Veledina et al., 2011, e.g.) which is often interpreted in the framework of the disc-corona model with the corona heated by magnetic reconnection (Cao, 2009; Liu et al., 2016, e.g.). We suggested that both the anti-correlation between and in low-luminosity AGNs and the positive correlation between and in luminous AGNs can be unified to be described within the framework of the condensation of the hot corona/ADAF. Based on our model, when , the condensation does not occur, the gas is accreted in the form of the pure ADAF. In the regime of ADAF solution with (with = ), the X-ray emission is dominated by the inverse Compton scattering of the synchrotron radiation and bremsstrahlung photons of the ADAF itself. In this case, the Compton scattering optical depth increases with increasing , while the electron temperature in the ADAF is nearly a constant, resulting in an increase of the Compton parameter with increasing (Mahadevan, 1997, e.g.). Then the X-ray spectra will become harder with increasing . More specifically, an anti-correlation between and will be predicted in the regime of ADAF solution (Qiao et al., 2013; Qiao & Liu, 2013; Yang et al., 2015, e.g.).
In this paper, we will focus on the positive correlation between and in luminous AGNs based on the model of the condensation of the corona/ADAF (Liu et al., 2015; Qiao & Liu, 2017). In the condensation model, an inner disc forms for . Both the outer boundary of the inner disc and the condensation rate of the corona increase with increasing . In this case, with an increase of , more soft photons from the disc will be scattered in the corona, which will result in a lower electron temperature in the corona, consequently predicting a softer X-ray spectrum. Specifically, a positive correlation between and will be predicted for . We systemically studied the effects of the parameters in the model, such as the black hole , the viscosity parameter , and the magnetic parameter on the structure of the disc and corona, as well as the corresponding emergent spectra around a supermassive black hole in AGNs. We compared the theoretical relation between and with the observations of a sample composed of 29 luminous AGNs (Vasudevan & Fabian, 2009). It is found that a bigger value of is required to match the observation, which is intrinsically consistent with the nature of the ADAF solution applied to luminous accreting black holes. The model is briefly introduced in Section 2. The numerical results and the comparisons with observations are shown in Section 3. Some discussions are in Section 4, and the conclusions are in Section 5.
2 The model
We consider that, initially, a vertically extended hot coronal gas is supplied to the central supermassive black by capturing the interstellar medium and stellar wind. Such a hot coronal gas is described as the self-similar solution of ADAF (Narayan & Yi, 1995). We study the interaction of the corona with a pre-existing, optically thick, cold disc in the vertical direction. The interaction between the disc and the corona results in either the matter in the corona to be condensed into the disc or the matter in the disc to be evaporated into the corona. Specifically, we study the energy balance including the thermal conduction in the vertical direction between the disc and corona, the radiation of the corona (involving the synchrotron radiation, bremsstrahlung and the corresponding self-Compton scattering of the synchrotron radiation and bremsstrahlung photons in the corona itself, as well as the soft photons from the disc to be scattered in the corona), and the illumination of the disc by the corona to self-consistently calculate the coronal temperature, density, and the mass-exchange rate between the disc and the corona. One can refer to Liu et al. (2015) or Qiao & Liu (2017) for the detailed model descriptions. The structure of the disc and corona can be derived by specifying the black hole mass (), initial mass accretion rate (), the viscosity parameter , magnetic parameter and the albedo (defined as the ratio of the reflected radiation from the surface of the inner disc to the incident radiation on it from the corona). Numerical simulations show that the albedo is often very lower, i.e., (Magdziarz & Zdziarski, 1995; Zdziarski et al., 1999; Nayakshin et al., 2000). In all the calculations below, we fix . With the derived structure of the disc and the corona, including the distribution of the electron temperature , the scattering optical depth of the corona, and the surface effective temperature of the disc in the radial direction, we calculate the emergent spectrum of the disc-corona system with Monte Carlo simulations. One can refer to Qiao & Liu (2012) for details.
3 Numerical results
3.1 The effect of black hole mass
In the panel (1) and panel (2) of Fig. 1, we plot the mass accretion rate in the corona (black line) and mass accretion rate in the disc (red line) as a function of radius with initial mass accretion rate and for black hole mass and respectively. It is found that the effects of the black hole mass on the distribution of the mass accretion rate in either corona or disc nearly can be neglected. The condensation radius and the condensation rate of the corona (with being the integrated condensation rate from the condensation radius to the ISCO of the black hole in units of . With ISCO being 3 assumed for a non-rotating Schwarzschild black hole) are also very similar for different black hole masses with a fixed initial mass accretion rate. One can refer to Table 1 for details. In the panel (3) and panel (4) of Fig. 1, we plot the electron temperature and the Compton scattering optical depth of the corona as a function of radius with mass accretion rate (blue line) and (black line) for black hole mass and respectively. It is also clear that the effects of the black hole mass on the distribution of the electron temperature and the Compton scattering optical depth nearly can be neglected. In the panel (1) and panel (2) of Fig. 2, we plot the corresponding emergent spectra (in units of ) with mass accretion rate and for black hole mass and respectively. The maximum effective temperatures of the disc are and with for black hole mass and respectively, and and with for black hole mass and respectively. As we expect, the emergent spectrum shifts rightward with decreasing . We plot the hard X-ray photon index as a function of for (blue line) and (black line) in the panel (3) of Fig. 2. It is shown that nearly does not change (a slight decrease) with increasing , which can be understood as follows. In our model, the power-law hard X-ray emission is produced by the inverse Compton scattering of the photons from the disc and corona itself (synchrotron radiation and bremsstrahlung) in the corona. As we know, the hard X-ray index is determined by the combination of and . Specifically, for the optically thin case of the corona, can be simply expressed as,
| (1) |
where (, with being the Boltzmann constant, being the mass of electron and being the speed of light) is the mean amplification factor in one scattering. As we show in the panel (3) and panel (4) of Fig. 1, and nearly do not change with increasing , consequently nearly does not change with increasing . By integrating the emergent spectra, we plot the correction factor (with ) as a function of for (blue line) and (black line) in the panel (4) of Fig. 2. Here, we show that intrinsically increases with increasing for a fixed mass accretion rate, which we expect to be compared with observations in detail in the future.


Panel (1): mass accretion rate in the corona (black line) and mass accretion rate in the disc (red line) as a function of radius with the initial mass accretion rate for different black hole masses. Panel (2): mass accretion rate in the corona (black line) and mass accretion rate in the disc (red line) as a function of radius with the initial mass accretion rate for different black hole masses. Panel (3): electron temperature in the corona as a function of radius with the initial mass accretion rate (blue line) and (black line) for different black hole masses. Panel (4): Compton scattering optical depth in the corona as a function of radius with the initial mass accretion rate (blue line) and (black line) for different black hole masses.


Panel (1): emergent spectra with the initial mass accretion rate for different black hole masses. Panel (2): emergent spectra with the initial mass accretion rate for different black hole masses. Panel (3): hard X-ray photon index as a function of black hole mass for (blue line) and (black line). Panel (4): as a function of black hole mass for (blue line) and (black line).
| () | () | / | ||||||
|---|---|---|---|---|---|---|---|---|
| 0.05 | 0.3 | 0.95 | 174 | 42.6% | 3.2 | 2.13 | ||
| 0.05 | 0.3 | 0.95 | 175 | 42.6% | 5.7 | 2.17 | ||
| 0.05 | 0.3 | 0.95 | 173 | 42.4% | 10.0 | 2.20 | ||
| 0.05 | 0.3 | 0.95 | 174 | 42.6% | 18.0 | 2.20 | ||
| 0.05 | 0.3 | 0.95 | 175 | 42.6% | 320.5 | 2.34 | ||
| 0.1 | 0.3 | 0.95 | 446 | 67.9% | 4.0 | 2.24 | ||
| 0.1 | 0.3 | 0.95 | 444 | 67.8% | 7.1 | 2.29 | ||
| 0.1 | 0.3 | 0.95 | 450 | 68.0% | 12.7 | 2.34 | ||
| 0.1 | 0.3 | 0.95 | 450 | 68.0% | 22.6 | 2.41 | ||
| 0.1 | 0.3 | 0.95 | 452 | 68.1% | 402.5 | 2.68 |
3.2 The effect of
In the panel (1) of Fig. 3, we plot the mass accretion rate in the corona (black line) and mass accretion rate in the disc (red line) as a function of radius with a fixed initial mass accretion rate for different . It is clear that the distribution of the mass accretion rate in the corona and the mass accretion rate in the disc are strongly affected by . As shown in Table 2, the corresponding condensation radius and the condensation rate of the corona are also strongly affected by . Specifically, for , the condensation radius is and the condensation rate is . With the increase of , as examples, for , the condensation radii are respectively, and the condensation rates are respectively. For , there is no condensation. We plot the corresponding emergent spectra in the panel (2) of Fig. 3. It is obvious that the emergent spectra are dramatically changed with changing , which can be generally understood as follows. First, we should keep in mind that the self-similar solution of ADAF is employed as the initial condition for describing the corona in our model. Then as we know, the luminosity of ADAF can be roughly expressed as, , which means that an increase of the value of will decrease the radiation of the ADAF for a fixed mass accretion rate (Mahadevan, 1997). If the radiation decreases, physically as we can imagine that the gas in ADAF is not easy to condense. Meanwhile, generally the cooling rate of the accretion flow (not only ADAF) is inversely proportional to the radius from the black hole. So for a bigger value of , the hot corona/ADAF will begin to condense at a relatively smaller radius from the black hole where the cooling is strong enough so that the condensation can occur. Extremely, for , as we show in the panel (1) of Fig. 3, at any radius beyond the ISCO of the black hole, the condensation doesn’t occur.
From Table 2, we can see, for , the ratio between the condensation rate and the initial mass rate is and the hard X-ray index is . With the increase of , as examples, for , are respectively, and are respectively. For the extreme case , there is no condensation and the hard X-ray index is . As the numerical results show, with the increase of , decreases dramatically. It means that, with the increase of , more and more initially accreted coronal gas will keep the hot condition, only a smaller fraction of the hot corona condenses downward forming the cool disc, which predicts a higher electron temperature in the corona, consequently resulting in a harder X-ray spectrum.
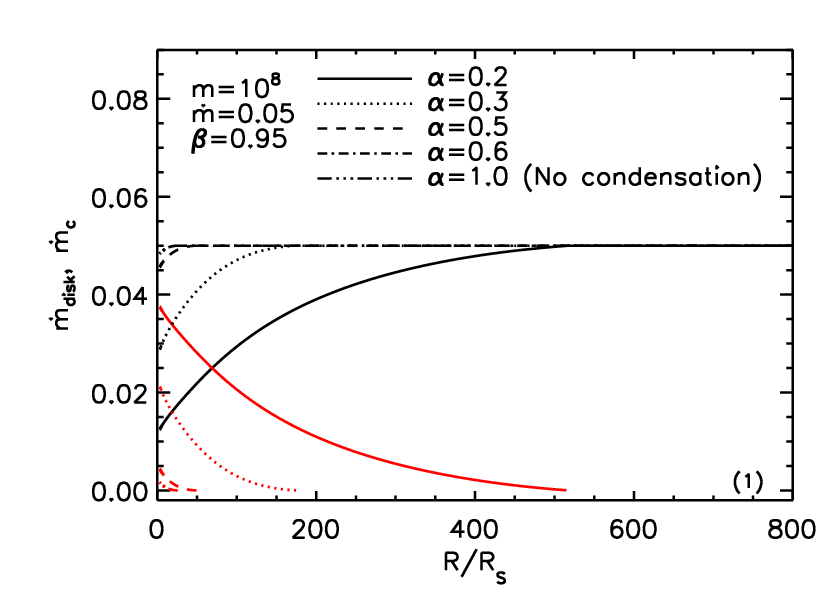
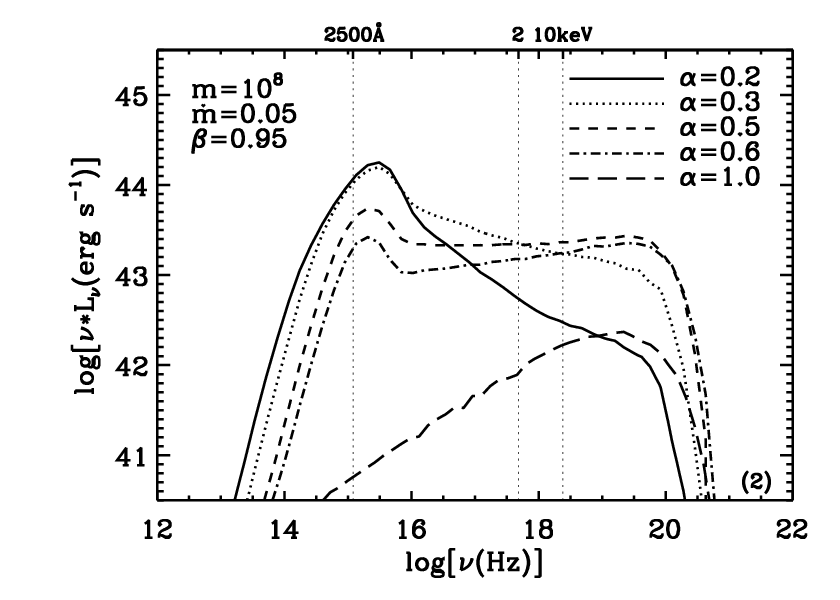
Panel (1): mass accretion rate in the corona (black line) and mass accretion rate in the disc (red line) as a function of radius for different viscosity parameter . Panel (2): corresponding emergent spectra for different viscosity parameter .
| () | () | / | ||||||
|---|---|---|---|---|---|---|---|---|
| 0.05 | 0.2 | 0.95 | 514 | 75.0% | 5.7 | 2.37 | ||
| 0.05 | 0.3 | 0.95 | 175 | 42.6% | 5.7 | 2.17 | ||
| 0.05 | 0.5 | 0.95 | 49 | 8.7% | 4.4 | 1.96 | ||
| 0.05 | 0.6 | 0.95 | 26 | 3.3% | 3.7 | 1.89 | ||
| 0.05 | 1.0 | 0.95 | - | - | - | - | 1.59 |
3.3 The effect of
In the panel (1) of Fig. 4, we plot the mass accretion rate in the corona (black line) and mass accretion rate in the disc (red line) as a function of radius with initial mass accretion rate for different . For , the condensation radius is , and the condensation rate is . With the decrease of , there is a slight change of the condensation radius and a slight increase of the condensation rate, i.e., for and , and respectively, and and respectively. The aforementioned results for the effects of on the condensation radius and the condensation rate can be roughly understood as follows. In both the current condensation model and the pure ADAF model, the magnetic field is responsible for the synchrotron radiation of the corona/ADAF. In the pure ADAF model, the synchrotron radiation is one of the most important soft-photon source for the Comptonization. In our condensation model, when the mass accretion rate is greater than the critical mass accretion rate , the condensation occurs, forming an inner disc. Generally, the energy density of the soft photons from the inner disc will dominate the soft photons from the synchrotron radiation of the corona itself for the Comptonization with the size of the inner disc greater than . With the increase of the mass accretion rate, the soft photons from the disc will completely dominate the soft photons from the synchrotron radiation for the Comptonization. So a change of the magnetic parameter , from 0.95 to 0.5, intrinsically will not significantly change the model results, such as the condensation radius and condensation rate.
We should also note that, indeed there is a slight increase of the condensation rate with decreasing , which we think can be understood from the hydrostatic equilibrium of the corona in the vertical direction. In the vertical direction, the gravity exerted on the corona is balanced by the total pressure gradient, (with , being the scaleheight of the corona). A decrease of means an increase of the magnetic filed, which leads to an increase of the magnetic pressure. In order to keep the hydrostatic equilibrium of the corona in the vertical direction, if the total pressure and the scaleheight do not change, an increase of the magnetic pressure means the gas pressure decreases. According to the equation of state of the corona, the gas pressure is (with being the ion temperature, being the electron temperature and being the density of the corona respectively). Generally, the ion temperature in the corona changes very slightly, which is close to the virial temperature. So when the gas pressure decreases, the density decreases. The mass accretion rate in the corona can be expressed as, . As our analysis above, when decreases, decreases, meanwhile, and nearly does not change, so decreases, which means that the condensation rate increases. We address that the analysis above is very simple, one can refer to Table 3 for the detailed numerical results.
In the panel (2) of Fig. 4, we plot the corresponding emergent spectra with for different . As we can see, there is no obvious change of the hard X-ray spectra, e.g., for and , the hard X-ray indices between 2-10keV are and respectively.
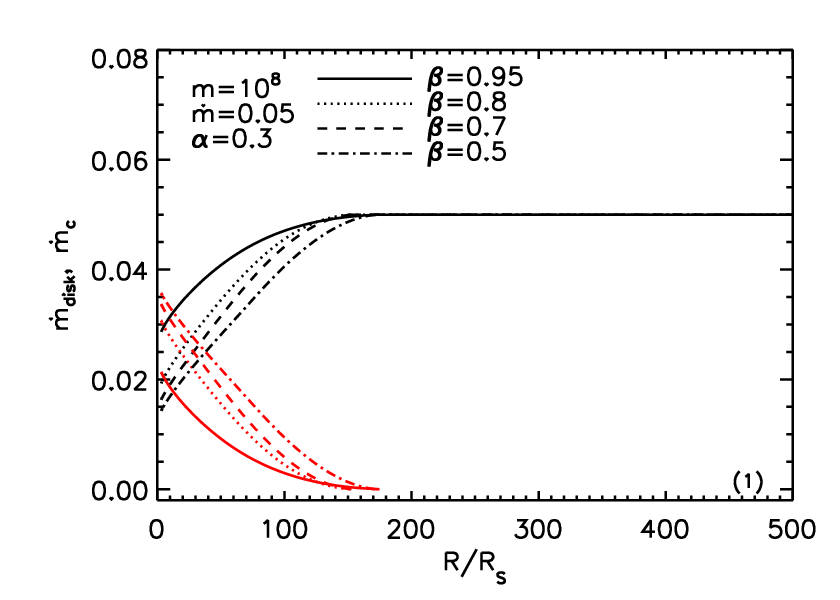
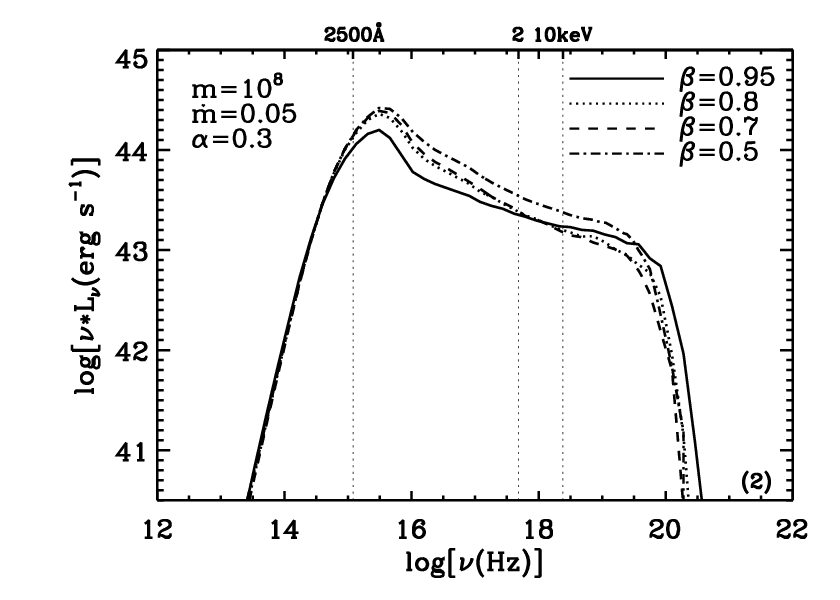
Panel (1): mass accretion rate in the corona (black line) and mass accretion rate in the disc (red line) as a function of radius for different magnetic parameter . Panel (2): corresponding emergent spectra for different magnetic parameter .
| () | () | / | ||||||
|---|---|---|---|---|---|---|---|---|
| 0.05 | 0.3 | 0.95 | 175 | 42.6% | 5.7 | 2.17 | ||
| 0.05 | 0.3 | 0.8 | 151 | 61.4% | 6.4 | 2.26 | ||
| 0.05 | 0.3 | 0.7 | 153 | 67.4% | 6.6 | 2.28 | ||
| 0.05 | 0.3 | 0.5 | 171 | 71.4% | 6.9 | 2.22 |
3.4 Comparison with observations for the correlation in luminous AGNs—the effect of
As shown in Section 3.1, 3.2 and 3.3, we studied the effects of the black hole mass , viscosity parameter and the magnetic parameter on the structure of the disc and the corona, as well as the corresponding emergent spectra respectively. Specifically, it is found that the effects of and on the hard X-ray photon index are very little, which nearly can be neglected. In the current paper, we will focus on the effect of on correlation. In the calculation, we fix black hole mass , magnetic parameter to calculate the emergent spectra with by assuming a value of . Specifically, for , and are adopted to calculate the emergent spectra respectively . For , and are adopted respectively. For , and are adopted respectively. For , and are adopted respectively. For , and are adopted respectively. The hard X-ray photon index can be directly got from the theoretical X-ray spectra. The bolometric luminosity can be got by integrating the emergent spectra. We plot the hard X-ray photon index as a function of in Fig. 5 for different . The symbol ’+’, , , , and refer to the theoretical results for and respectively. As shown in Fig. 5, it is clear that there is positive correlation between and by assuming a fixed value of , which can be roughly understood as our general picture of the condensation model. With an increase of the initial mass accretion rate, both the condensation radius and the condensation rate increases, then more photons in the disc to be scattered in the corona, which will lead to a lower electron temperature in the corona, consequently predicting a softer X-ray spectrum.
We collected a sample composed of 29 luminous AGNs with well constrained X-ray spectra and Eddington ratios for comparisons (Vasudevan & Fabian, 2009). The black hole masses of the sources in the sample are estimated by the reverberation mapping (RM) method, which is believed to be a proven and powerful technique for the estimation of the black hole mass in AGNs (Peterson et al., 2004). The bolometric luminosity of the sources in the sample are calculated by integrating the spectral energy distributions (SEDs) of the sources with simultaneous X-ray/optical/UV data of the XMM-Newton European Photon Imaging Camera (EPIC-pn) and Optical Monitor (OM) archives (Vasudevan & Fabian, 2009). The X-ray spectra are fitted by the bknpower model, and the model of zwabs was allowed for treating the absorptions (Vasudevan & Fabian, 2009). One can refer to the red-triangle in Fig. 5 for the observational data between and . The red-dashed line in Fig. 5 refers to the best-fitting linear regression of the observational data, which can be expressed as,
| (2) |
It is obvious that the theoretical correlation derived by assuming a bigger , i.e., is more close to the observations.

Hard X-ray photon index as a function of Eddington ratio . The red-triangle is a sample composed of 29 luminous AGNs from Vasudevan & Fabian (2009). The red-dashed line refers to the best-fitting linear regression of the observational data. The symbol ’+’, , , , and refer to the theoretical results for and respectively. In all the calculations, and are adopted.
4 Discussions
4.1 On black hole mass
As has been shown in 3.1, the effects of black hole mass on the distribution of the mass accretion rate in the corona and mass accretion rate in the disc, the electron temperature in the corona, the Compton scattering optical depth of the corona can nearly be neglected. Meanwhile, since the effective temperature of the disc for a higher mass black hole is intrinsically lower than that of the case for a lower black hole mass (Mitsuda et al., 1984; Makishima et al., 1986), the emergent spectrum nearly shifts rightward horizontally with decreasing black hole mass, as shown in the panel (1) and panel (2) of Fig. 2. We note that, in the current paper, the thermal conduction between the disc and corona in the vertical direction is considered , which finally results in the formation of the inner disc. Because of the feedback between the corona and the disc, the distribution of the electron temperature in the corona and the Compton scattering optical depth of the corona as a function of radius are different from the results predicted by the pure ADAF (Narayan & Yi, 1995). However, since the corona in our model intrinsically is optically thin, the results predicted by our model for supermassive black holes in AGNs theoretically can be scaled down to stellar mass black holes, which is similar to the case of pure ADAF solution applied to both supermassive black holes and stellar mass black hole (Yuan & Narayan, 2014, for review). A detailed study of the application of the condensation of the corona to high mass black hole X-ray binaries (such as Cyg X-1) will be in the next paper, which is believed to be fuelled by the wind loss from the bright companion star.
4.2 On and
The viscosity parameter and magnetic parameter are two very important parameters in both our current model of the condensation of the corona and the pure ADAF model. A great of very important progresses have been done for investigating the value of and or the relationship between and for different types of the accretion flows or for the accretion flow with different magnetic structure. (Pessah et al., 2007; Blackman et al., 2008; Guan et al., 2009; Hawley et al., 2011; McKinney et al., 2012; Bai & Stone, 2013, e.g.). Since we employed the pure ADAF solution as the initial condition for describing the property of the corona in the current model, we will focus on the value of and in the framework of the ADAF solution.
The viscosity is one of the most important processes to be considered in the accretion physics, which basically controls how the angular momentum is transported and accreted gas is heated. Shakura & Sunyaev (1973) proposed a very simple description for the viscosity, which was expressed as follows,
| (3) |
where refers to the kinematic viscosity, refers to the sound speed, and refers to the thickness of the disc. The value of was expected (e.g. Frank et al., 2002, for detailed discussions). Such a dimensionless description for the viscosity was widely applied to nearly all types of the semi-analytical study of the accretion flows around a black hole, such as the slim disc with a higher mass accretion rate by Abramowicz et al. (1988), the ADAF with a lower mass accretion rate by Narayan & Yi (1994); Narayan & Yi (1995). Currently, it is widely believed that the physical mechanism of the viscosity for the angular momentum transport in the ionized accretion flows is the magnetorotational instability (MRI) (Balbus & Hawley, 1991; Balbus & Hawley, 1998). So far a great of MHD numerical simulations have been done for the viscosity parameter , however, it is still uncertain, depending strongly on how the numerical simulations are considered (Yuan & Narayan, 2014, for review). Previously, in some numerical simulations, the author generally found a lower value of , such as, by Stone et al. (1996), by Hirose et al. (2006), and by Hawley et al. (2011). Reversely, some numerical simulations found a relatively bigger value of , sometimes even greater than unity (Machida et al., 2000; Bai & Stone, 2013).
Observationally, the value of is also diverse. Starling et al. (2004) estimated the value of by measuring the optical variability of AGNs from months to years. By analysing a two-folding time-scale observational data in the optical band, they suggested that in the disc is in the range of for . Starling et al. (2004) also reminded that such a value of is only a lower limit since the data sampling may miss the shorter time-scales. King et al. (2007) summarized the value of in different kinds of objects, including Dwarf nova outburst, X-ray transients outburst, AGNs, proto-stellar accretion discs, FU Orionis outbursts. They suggested that the value of is in the range of . Based on the disk-evaporation model, Qiao & Liu (2009) studied the effect of on the transition luminosity between the low/hard spectral state and high/soft spectral state in black hole X-ray binaries. Specifically, they found that . By comparing with a sample of black hole X-ray binaries with well constrained transitional luminosities (ranging from ), the authors suggested that the value of is in the range of .
Although the ADAF solution was originally proposed for the low-luminosity accreting black holes, it was suggested that ADAF can also be employed to describe the high-luminosity accreting black holes, providing a larger , e.g., was adopted in Narayan (1996). As we know, theoretically there is a critical mass accretion rate , i.e., , above which the ADAF solution can not exist. It is clear that the critical mass accretion rate increases with increasing . So the ADAF solution can be applied to the black hole with a higher luminosity. Xie & Yuan (2016) employed the coupled ADAF-jet model to explain the radio/X-ray correlation of in black hole X-ray transients GX339-4 and V404 Cyg for , in which the X-ray emission is dominated by ADAF with a relatively bigger value of adopted and the radio emission is dominated by jet.
In many numerical simulations, it is found that there is a tight correlation between and , i.e., (with , different from the previous definition for the magnetic parameter as, ) (Blackman et al., 2008; Hawley et al., 2011; Sorathia et al., 2012, e.g.). For example, Hawley et al. (2011) found that is in the range of , corresponding to a lower value of , i.e., . However, we should note that, as far as ADAF solution, MHD simulations usually give (corresponding to ), which means a relatively weak magnetic field in the ADAF solution. Qiao et al. (2013) estimated the value of in the ADAF solution by comparing with a sample composed 10 low-luminosity AGNs with well observed SEDs. They also found that a weaker magnetic field, i.e., is required to fit the observed SEDs. In the current paper, as has been shown in section 3.3, the effects of on the X-ray spectra are very little, so we simply fix in section 3.4 to compare with observations.
5 Conclusions
In this paper, we systemically studied the effects of the black hole , viscosity parameter , and the magnetic parameter on the structure of the disc and corona, as well as the emergent spectra based on the model of the condensation of the corona. It is found that the slope of the hard X-ray spectra nearly does not change with changing or . Meanwhile, it is found that the geometry of the accretion flow, the structure of the disc and the corona, as well as the corresponding emergent spectrum completely changes with changing . By comparing with a sample composed of 29 luminous AGNs with well constrained X-ray spectra and Eddington ratios , it is found that the observed correlation between and can be well matched by taking in our model, which has been proposed to explain the spectral features of luminous accreting black holes in the framework of ADAF solution, e.g., Narayan (1996).
Acknowledgments
We thank Professor R.E. Taam from ASIAA for very useful discussions. This work is supported by the National Natural Science Foundation of China (Grants 11773037 and 11673026), the gravitational wave pilot B (Grants No. XDB23040100), and the National Program on Key Research and Development Project (Grant No. 2016YFA0400804).
References
- Abramowicz et al. (1988) Abramowicz M. A., Czerny B., Lasota J. P., Szuszkiewicz E., 1988, ApJ, 332, 646
- Bai & Stone (2013) Bai X.-N., Stone J. M., 2013, ApJ, 767, 30
- Balbus & Hawley (1991) Balbus S. A., Hawley J. F., 1991, ApJ, 376, 214
- Balbus & Hawley (1998) Balbus S. A., Hawley J. F., 1998, Reviews of Modern Physics, 70, 1
- Blackman et al. (2008) Blackman E. G., Penna R. F., Varnière P., 2008, New Astron., 13, 244
- Cao (2009) Cao X., 2009, MNRAS, 394, 207
- Coppi (1999) Coppi P. S., 1999, in Poutanen J., Svensson R., eds, Astronomical Society of the Pacific Conference Series Vol. 161, High Energy Processes in Accreting Black Holes. p. 375 (arXiv:astro-ph/9903158)
- Di Matteo (1998) Di Matteo T., 1998, MNRAS, 299, L15
- Dove et al. (1997) Dove J. B., Wilms J., Maisack M., Begelman M. C., 1997, ApJ, 487, 759
- Elvis et al. (1994) Elvis M., et al., 1994, ApJS, 95, 1
- Emmanoulopoulos et al. (2012) Emmanoulopoulos D., Papadakis I. E., McHardy I. M., Arévalo P., Calvelo D. E., Uttley P., 2012, MNRAS, 424, 1327
- Fabian et al. (2015) Fabian A. C., Lohfink A., Kara E., Parker M. L., Vasudevan R., Reynolds C. S., 2015, MNRAS, 451, 4375
- Frank et al. (2002) Frank J., King A., Raine D. J., 2002, Accretion Power in Astrophysics: Third Edition
- Fromang et al. (2013) Fromang S., Latter H., Lesur G., Ogilvie G. I., 2013, A&A, 552, A71
- Gierliński & Done (2004) Gierliński M., Done C., 2004, MNRAS, 349, L7
- Gu & Cao (2009) Gu M., Cao X., 2009, MNRAS, 399, 349
- Guan et al. (2009) Guan X., Gammie C. F., Simon J. B., Johnson B. M., 2009, ApJ, 694, 1010
- Haardt & Maraschi (1991) Haardt F., Maraschi L., 1991, ApJ, 380, L51
- Haardt & Maraschi (1993) Haardt F., Maraschi L., 1993, ApJ, 413, 507
- Hawley et al. (2011) Hawley J. F., Guan X., Krolik J. H., 2011, ApJ, 738, 84
- Hernández-García et al. (2013) Hernández-García L., González-Martín O., Márquez I., Masegosa J., 2013, A&A, 556, A47
- Hernández-García et al. (2014) Hernández-García L., González-Martín O., Masegosa J., Márquez I., 2014, A&A, 569, A26
- Hirose et al. (2006) Hirose S., Krolik J. H., Stone J. M., 2006, ApJ, 640, 901
- Jiang et al. (2014) Jiang Y.-F., Stone J. M., Davis S. W., 2014, ApJ, 784, 169
- Kawanaka et al. (2005) Kawanaka N., Mineshige S., Iwasawa K., 2005, ApJ, 635, 167
- King et al. (2007) King A. R., Pringle J. E., Livio M., 2007, MNRAS, 376, 1740
- Liu et al. (2002) Liu B. F., Mineshige S., Shibata K., 2002, ApJ, 572, L173
- Liu et al. (2003) Liu B. F., Mineshige S., Ohsuga K., 2003, ApJ, 587, 571
- Liu et al. (2015) Liu B. F., Taam R. E., Qiao E., Yuan W., 2015, ApJ, 806, 223
- Liu et al. (2016) Liu J. Y., Qiao E. L., Liu B. F., 2016, ApJ, 833, 35
- Liu et al. (2017) Liu B. F., Taam R. E., Qiao E., Yuan W., 2017, ApJ, 847, 96
- Loureiro et al. (2012) Loureiro N. F., Samtaney R., Schekochihin A. A., Uzdensky D. A., 2012, Physics of Plasmas, 19, 042303
- Lu & Yu (1999) Lu Y., Yu Q., 1999, ApJ, 526, L5
- Lusso & Risaliti (2017) Lusso E., Risaliti G., 2017, A&A, 602, A79
- Machida et al. (2000) Machida M., Hayashi M. R., Matsumoto R., 2000, ApJ, 532, L67
- Magdziarz & Zdziarski (1995) Magdziarz P., Zdziarski A. A., 1995, MNRAS, 273, 837
- Magdziarz et al. (1998) Magdziarz P., Blaes O. M., Zdziarski A. A., Johnson W. N., Smith D. A., 1998, MNRAS, 301, 179
- Mahadevan (1997) Mahadevan R., 1997, ApJ, 477, 585
- Makishima et al. (1986) Makishima K., Maejima Y., Mitsuda K., Bradt H. V., Remillard R. A., Tuohy I. R., Hoshi R., Nakagawa M., 1986, ApJ, 308, 635
- McKinney et al. (2012) McKinney J. C., Tchekhovskoy A., Blandford R. D., 2012, MNRAS, 423, 3083
- Merloni & Fabian (2001) Merloni A., Fabian A. C., 2001, MNRAS, 321, 549
- Miller & Stone (2000) Miller K. A., Stone J. M., 2000, ApJ, 534, 398
- Mitsuda et al. (1984) Mitsuda K., et al., 1984, PASJ, 36, 741
- Narayan (1996) Narayan R., 1996, ApJ, 462, 136
- Narayan & McClintock (2008) Narayan R., McClintock J. E., 2008, New Astron. Rev., 51, 733
- Narayan & Yi (1994) Narayan R., Yi I., 1994, ApJ, 428, L13
- Narayan & Yi (1995) Narayan R., Yi I., 1995, ApJ, 452, 710
- Nayakshin et al. (2000) Nayakshin S., Kazanas D., Kallman T. R., 2000, ApJ, 537, 833
- Pessah et al. (2007) Pessah M. E., Chan C.-k., Psaltis D., 2007, ApJ, 668, L51
- Peterson et al. (2004) Peterson B. M., et al., 2004, ApJ, 613, 682
- Piconcelli et al. (2005) Piconcelli E., Jimenez-Bailón E., Guainazzi M., Schartel N., Rodríguez-Pascual P. M., Santos-Lleó M., 2005, A&A, 432, 15
- Porquet et al. (2004) Porquet D., Reeves J. N., O’Brien P., Brinkmann W., 2004, A&A, 422, 85
- Poutanen & Coppi (1998) Poutanen J., Coppi P. S., 1998, Physica Scripta Volume T, 77, 57
- Poutanen & Veledina (2014) Poutanen J., Veledina A., 2014, Space Sci. Rev., 183, 61
- Poutanen et al. (2017) Poutanen J., Veledina A., Zdziarski A. A., 2017, preprint, (arXiv:1711.08509)
- Qiao & Liu (2009) Qiao E., Liu B. F., 2009, PASJ, 61, 403
- Qiao & Liu (2012) Qiao E., Liu B. F., 2012, ApJ, 744, 145
- Qiao & Liu (2013) Qiao E., Liu B. F., 2013, ApJ, 764, 2
- Qiao & Liu (2017) Qiao E., Liu B. F., 2017, MNRAS, 467, 898
- Qiao et al. (2013) Qiao E., Liu B. F., Panessa F., Liu J. Y., 2013, ApJ, 777, 102
- Reis & Miller (2013) Reis R. C., Miller J. M., 2013, ApJ, 769, L7
- Saez et al. (2008) Saez C., Chartas G., Brandt W. N., Lehmer B. D., Bauer F. E., Dai X., Garmire G. P., 2008, AJ, 135, 1505
- Shakura & Sunyaev (1973) Shakura N. I., Sunyaev R. A., 1973, A&A, 24, 337
- Shang et al. (2005) Shang Z., et al., 2005, ApJ, 619, 41
- Shemmer et al. (2006) Shemmer O., Brandt W. N., Netzer H., Maiolino R., Kaspi S., 2006, ApJ, 646, L29
- Sironi & Spitkovsky (2014) Sironi L., Spitkovsky A., 2014, ApJ, 783, L21
- Sobolewska & Papadakis (2009) Sobolewska M. A., Papadakis I. E., 2009, MNRAS, 399, 1597
- Sorathia et al. (2012) Sorathia K. A., Reynolds C. S., Stone J. M., Beckwith K., 2012, ApJ, 749, 189
- Starling et al. (2004) Starling R. L. C., Siemiginowska A., Uttley P., Soria R., 2004, MNRAS, 347, 67
- Stern et al. (1995) Stern B. E., Poutanen J., Svensson R., Sikora M., Begelman M. C., 1995, ApJ, 449, L13
- Stone et al. (1996) Stone J. M., Hawley J. F., Gammie C. F., Balbus S. A., 1996, ApJ, 463, 656
- Svensson & Zdziarski (1994) Svensson R., Zdziarski A. A., 1994, ApJ, 436, 599
- Takahashi et al. (2016) Takahashi H. R., Ohsuga K., Kawashima T., Sekiguchi Y., 2016, ApJ, 826, 23
- Uzdensky (2013) Uzdensky D. A., 2013, ApJ, 775, 103
- Uzdensky & Goodman (2008) Uzdensky D. A., Goodman J., 2008, ApJ, 682, 608
- Vasudevan & Fabian (2007) Vasudevan R. V., Fabian A. C., 2007, MNRAS, 381, 1235
- Vasudevan & Fabian (2009) Vasudevan R. V., Fabian A. C., 2009, MNRAS, 392, 1124
- Veledina et al. (2011) Veledina A., Vurm I., Poutanen J., 2011, MNRAS, 414, 3330
- Wang et al. (2004) Wang J.-M., Watarai K.-Y., Mineshige S., 2004, ApJ, 607, L107
- Xie & Yuan (2016) Xie F.-G., Yuan F., 2016, MNRAS, 456, 4377
- Yang et al. (2015) Yang Q.-X., Xie F.-G., Yuan F., Zdziarski A. A., Gierliński M., Ho L. C., Yu Z., 2015, MNRAS, 447, 1692
- Younes et al. (2011) Younes G., Porquet D., Sabra B., Reeves J. N., 2011, A&A, 530, A149
- Yuan & Narayan (2014) Yuan F., Narayan R., 2014, ARA&A, 52, 529
- Zdziarski et al. (1999) Zdziarski A. A., Lubiński P., Smith D. A., 1999, MNRAS, 303, L11