Coronal properties of the Seyfert 1 galaxy 3C 120 with NuSTAR
Abstract
We present measurement of the cut-off energy, a proxy for the temperature of the corona in the nuclear continuum of the Seyfert 1 galaxy 3C 120 using 120 ks of observation from NuSTAR. The quality broad band spectrum from 379 keV has enabled us to measure the Compton reflection component (R) and to constrain the temperature of the coronal plasma. Fitting one of the advanced Comptonization models, compPS to the observed broad band spectrum we derived the kinetic temperature of the electrons in the corona to be keV with Compton y parameter of for a slab geometry and keV with a of assuming a spherical geometry. We noticed excess emission from 1035 keV arising due to Compton reflection and a broad Fe line at 6.43 keV with an equivalent width of 60 5 eV. The variations in count rates in the soft (310 keV) band is found to be more compared to the hard (1079 keV) band with mean fractional variability amplitudes of 0.0650.002 and 0.0520.003 for the soft and hard bands respectively. 3C 120 is known to have a strong jet, however, our results indicate that it is either dormant or its contribution if any to the X-ray emission is negligible during the epoch of NuSTAR observation.
Subject headings
galaxies: active galaxies: Seyfert (galaxies:) quasars: individual (3C120)I. Introduction
Active galactic nuclei (AGN) are energetic extragalactic sources believed
to be powered by a complex physical process, namely, the accretion of matter
on to supermassive black holes (SMBHs) residing at the centres of galaxies
[53]. The matter accreted by the SMBH forms an
optically thick, geometrically thin accretion disk
[57], with a temperature of about
104105 K for a SMBH of mass 106 to 109 M⊙, and that emits
predominantly in the optical/UV region of the electromagnetic spectrum.
The components of an AGN therefore include an accretion disk surrounding the
central SMBH, an X-ray emitting corona, an obscuring torus
surrounding the accretion disk and a relativistic jet in about
15% of AGN [63]. While the accretion disk emits in the
optical/UV bands, the observed hard X-ray continuum is believed to
be caused by thermal Comptonization of
the accretion disk photons in a hot (109 K) optically thin
corona [27, 28, 29]
in the radio-quiet category (those without radio jets) of
AGN. This Comptonization process gives rise to the observed
power-law X-ray spectrum in AGN and the shape of this observed spectrum
depends on the seed photon field, the kinetic temperature of the plasma
, the optical depth and the geometry of the corona. Arguments
in literature indicate the corona to lie between 3 10 Rg above the
central SMBH [21]. Here, is the
gravitational radius
of a SBMH with mass MBH. In addition to
the primary power law continuum, the X-ray spectrum also contains
a Fe K line at 6.4 keV. The origin of this line, unambiguously
detected for the first time in the source MCG-6-30-15
[59] is attributed
to the reflection of the power law photons from the hot corona by the
relatively cold accretion disk [23]. This line
is now observed in many AGN [45].
Therefore, X-ray observations of AGN provide very important clues to the
physical processes that happen close to the SMBH.
A feature in the hard X-ray spectra of AGN that arises from the thermal Comptonization process is the presence of a high energy cut off () which is related to the plasma electron temperature () of the corona that is found to range between 50 to 100 keV. Measurements of for about hundred AGN [49, 42, 13] are available as of today based on observations using older observatories such as the CGRO [74], BeppoSAX [48] and the currently operating satellite INTEGRAL [41]. For example, [13] using BeppoSAX data in the energy range 2 100 keV has provided measurements for 34 sources and lower limits for another 54 sources. Also, [41] using data from XMM, INTEGRAL and Swift has provided values for 26 AGN and lower limits for 11 others. Most of these measurements have large error bars, which may be due to the quality of the data itself as well as the degeneracy that is known to prevail between and other physical properties of the sources such as the slope of the primary X-ray power law, and the amount of radiation that are Compton up scattered by the circumnuclear material [42].
One of the important physical prameters of the Comptonizing corona in an AGN is its plasma temperature . The value of in many instances is indirectly obtained by fitting simple phenomnological models such as the cut-off power law to the observed X-ray spectrum to find and subsequently is deduced using certain approximations. However, values are available for many AGN based on physical model fits to AGN spectra [49, 40]. Disentangling the different spectral components that are present in the X-ray spectra of AGN and constraining their characteristic parameters require high S/N data covering a wide energy range. These limitations are now overcome to a large extent owing to the availability of the focussing hard X-ray telescope, the Nuclear Spectroscopic Telescope Array, NuSTAR [32], due to its high sensitivity and wide energy coverage from 3 79 keV. However, NuSTAR too can provide precise measurements only for sources with 150 keV [41]. Measurements beyond this from NuSTAR will not be reliable due to its own lack of effective area beyond 79 keV. Using NuSTAR, as well as the more physical coronal plasma temperature has been measured in about a dozen AGN [9, 43, 6, 5, 44, 38, 62, 35, 47, 39, 36] and also summarized by [42]. Though NuSTAR observations have enabled us to characterise the coronal properties of about a dozen AGN, to have a complete knowledge of the geometrical and physical properties of the X-ray corona in AGN, there is a need to extend such studies on the X-ray properties to a large sample of AGN.
In this paper, we present the results of our analysis of X-ray data on 3C 120 observed by NuSTAR for a total duration of about 120 ks. 3C 120 is a X-ray bright Seyfert 1 galaxy at = 0.033 [11] and having a black hole mass of M⊙ [8]. It is also classified as a broad line radio galaxy (BLRG) by [67]. It has a radio morphology similar to the FRI category of AGN [22]. Its one sided jet has an inclination to the line of sight of 14∘ [18] which is based on the apparent superluminal speed reported by [75]. The jet is known to extend on scales up to 100 kpc [67]. It has been found to be variable in X-rays. A broad Fe K line well fitted by a Gaussian with a of 0.8 keV and having an equivalent width of 400 eV has been found from ASCA observations [30]. It has not been detected in -rays by the Compton Gamma Ray Observatory (CGRO,Lin et al. 37). However, using data from the Oriented Scintillation Spectroscopy Experiment (OSSE,Johnson et al. 34) on board CGRO, [70] found the presence of a spectral break in 3C 120 between X-rays and soft -rays. 3C 120 was detected in Fermi using the first 15 months of data [1], but not detected in the second Fermi-LAT catalog (2FGL, Nolan et al. 46) and the third Fermi-LAT catalog (3FGL, Acero et al. 2) indicating that the source is variable in the high energy -rays. Using 180 and 365 days binning on the data obtained between August 2008 - December 2013, [55] found -ray flux variations. Using 5 days binned light curve [60] noticed that 3C 120 was detected only at certain epochs.
In this work, we focus on both the timing and broad band (379 keV) spectral analysis. Though 3C 120 has been studied for flux variability as part of the analysis of a large sample of AGN by [52], analysis of the broad band X-ray data to constrain its coronal properties using NuSTAR has been carried out for the first time. However, from BeppoSAX observations, [71] have estimated a of 100300 keV. Also, [70] using the average OSSE spectrum together with ASCA data reported a of 130 keV. Using data from several telescopes [40] obtained a value of keV. This paper is organised as follows. In Section 2 we report on the NuSTAR observations and data reduction. In Section 3 we present the analysis of the NuSTAR data. The results are discussed in Section 4 followed by the summary in the final section.
II. Observation and Data reduction
3C 120 was observed by NuSTAR [32] on 6th February 2013 (ObsID 60001042003) for 127 ks in the 379 keV band. The data was reduced using the NuSTAR Data Analysis Software package NuSTARDAS v.1.6.0 distributed by the High Energy Astrophysics Archive Research Center (HEASARC). We generated the cleaned and screened event files taking also into account the passage of the satellite through the South Atlantic Anomaly using the nupipeline task and using CALDB 20161207. A circular region of radius was taken centered on the peak of the source image to extract the source spectrum and light curve. To extract the background spectrum and light curve we again selected a circular region of radius away from the source on the same detector. Light curves were generated with 300 seconds binning in the 379 keV band for both the focal plane modules, FPMA and FPMB. They were further divided into soft (310 keV) and hard (1079 keV) bands. To get the final light curves, the count rates from the two modules FPMA and FPMB were combined using the lcmath task in FTOOLS V6.19.
We generated the source and background spectra and response files in the energy range of 379 keV in each focal plane module FPMA and FPMB using the nuproducts package available in NuSTARDAS. Instead of combining the spectra or responses from FPMA and FPMB, we fitted them simultaneously, allowing the cross normalization for both modules to vary freely in all fits. We used XSPEC (version 12.9.0; Arnaud 4) for all spectral analysis. During the various model fits in XSPEC, we used [3] set of solar abundances and the [7] photoelectric cross sections. The minimization technique in XSPEC was used to get the best model description of the data and all errors were calculated using =2.71 criterion, i.e., 90% confidence level.
To check for any possible effects on our choice of the background region used to get the light curves and the source spectrum, we also used a background found in an annular region around the source having an inner radius of 50 pixels and an outer radius of 80 pixels (1 pixel = 2.46 arcsec). The mean count rates of the source light curve in the 379 keV band using the background taken from the circular region away from the source and using the annular region surrounding the source are 3.88 0.20 and 3.84 0.20 respectively. The choice of the background thus has neglible effect on the light curves presented here. Similarly, the average fluxes of the source in the 379 keV band obtained from a simple power law fit to the spectrum are (1.372 0.007) 10-10 and (1.237 0.007) 10-10 erg s-1 cm-2 respectively using the background taken from the circular region away from the source and the annular region surrounding the source. The difference in the fluxes deduced from the spectra using two choices of the background selection is less than 10%. Thus, the selection of background region has no significant impact on the spectral and timing analysis carried out on 3C 120.
III. Analysis of the data
III.1. Flux variability
In Figure 1 we show the light curves in two energy bands 310 keV and 1079 keV as well the hardness ratio (HR) curve. The HR is evaluated as the ratio between the count rates in the 1079 keV to 310 keV bands. The source is found to show variations in both the soft and hard bands. To characterise the flux variations from observed count rates, we used the fractional root mean square variability amplitude (Fvar) which gives an estimate of the intrinsic variability amplitude relative to the mean count rate [17, 66]. We found Fvar values of 0.065 0.002 and 0.052 0.003 respectively for the soft and hard bands. To characterise the presence of spectral variations if any, we calculated the HR and show in Figure 2 the plot of HR against flux variations (in the units of counts/sec) in the total (379 keV) band. Fit of a linear function of the form HR = m counts/sec (379) keV + c, that also takes into consideration the errors in both HR and the 379 keV count rates, gave values of 0.019 0.005 and 0.465 0.022 for m and c respectively. The spectrum is thus found not to change with the brightness of the source.

. The variation of HR is shown on the bottom panel.

in the 379 keV band. The solid blue line is the linear least squares fit to the data.
III.2. Spectral analysis
Analysis of the spectrum of 3C 120 along with model fittings was carried out using the XSPEC package. To find the best fit models, the minimization technique in XSPEC was used.
Analysis of X-ray spectra are generally attempted by fitting simple phenomenlogical models such as the simple power law model as well as the power law with exponential cut-off. Using power law fits, [51] obtained a value of = 1.85 0.01. Similarly, using the pexrav model, the same authors obtained value of the high energy cut-off () to be 83 keV. However, these models are too simplistic. Also, the power law with an exponential cut off that is incorporated in pexrav has limitations in its approximation of the steep decline of the true high energy cut off [73, 20, 40]. Thus, both the models are too simplistic to apply to the good quality of the data from NuSTAR that is analysed here. Therefore, the following more physical models were fit to the data.
III.2.1 CompTT model
We used the Comptonization model (CompTT;
Titarchuk 61) convolved with a reflection component so as to
get the coronal parameters.
This model has the form TBabs zTBabs
(zgaussCompTTrefl(CompTT)).
The first component of this model TBabs [68]
includes galactic absorption, with
the galactic neutral hydrogen column density frozen to the value of
cm-2 obtained from [14]
using the nH tool in HEASARC11
1
https://heasarc.gsfc.nasa.gov/cgi-bin/Tools/w3nh/w3nh.pl and the second component
zTBabs represents absorption intrinsic to the host galaxy of the source.
Redshift was fixed to and the column density zTBabs was kept as a free parameter
in the fitting.
The CompTT component in this model assumes
a geometry for the corona (a slab or spherical) and models the intrinsic
coronal continuum, and refl convolves it with reflection features
[6].
For slab geometry the reduced
was 0.986 () and for spherical
geometry too it was 0.986 (). For the slab
geometry,
we found the mean value of keV and considering
primary and reflected emission.
at the 90% confidence. For the spherical geometry
the best fit yielded the mean value of keV
and for
primary and reflected emission at the 90% confidence. The CompTT model
gave huge error bars in the normalization constant.
The observed spectrum along with the
fit and residuals are shown in
Figure 3 for the spherical geometry
and Figure 4 for the slab
geometry.
The best fit parameters and their errors at
90% confidence levels are given in Table 1.
The 210 keV flux determined from the fit is (5.19 0.01)
10-11 erg cm-2 sec-1.
This gives an unabsorbed luminosity of
(1.29 0.01) 1044 erg sec-1. Using the
bolometric correction of 20.6 0.1 found by
[65] we obtained a bolometric luminosity of
(26.656 0.001) 1044 erg sec-1. For a BH mass
of 5.6 107 M⊙ [8],
the calculated Eddington accretion rate is
= = 0.353, where the Eddington luminosity, =
1.36 1038 (MBH/M erg sec-1. This is similar to the value of = 0.352
found by [40] using data from many telescopes including INTEGRAL.
III.2.2 CompPS
Though CompTT model well represents the observed spectrum, this has limitations such as its simplistic treatment of the seed photons that participate in the Comptonization process. We therefore fit the spectrum using one of the most advanced Comptonization models available in XSPEC namely CompPS [50]. CompPS that produces the continuum through thermal Comptonization processes incorporates proper treatment of the Comptonization process through exact numerical solution of the radiative transfer equations. It also offers several choices for the geometries. In the fitting process, when all the parameters were kept free, the fitting failed to converge. Therefore, to avoid non-convergence owing to the presence of many free parameters in CompPS fitting, we fixed the centroid energy and deviation of the Fe K line to be 6.43 keV and 0.29 keV respectively obtained from CompTT for a slab geometry. The parameters obtained from the fit along with their associated errors including the Compton y parameter (, where is the Thomson optical depth [74] and the normalization (NCompPS) are given in Table 1. To compare our results with CompTT, we used CompPS model only for slab and spherical geometries. The seed photons were assumed to be 10 eV. The observed spectra along with the fit and residuals are shown in Figure 5 for the spherical and the slab geometries. For slab geometry we obtained a reduced () of 0.996, whereas, for the spherical geometry the reduced () was 0.998. For slab and spherical geometry, we found R values of 0.80 and 0.430.06 respectively. We found that the values obtained from CompPS model is larger than that obtained from CompTT for both spherical and slab geometries.
III.2.3 EQPAIR
The models used above to fit the NuSTAR data of 3C 120 assumes that the electrons involved in the Comptonization process are thermal electrons with a Maxwellian energy distribution. However, hybrid models for the corona that involves the contribution of both thermal and non-thermal electrons have been applied to AGN. For example, in NGC 4151, the contribution of non-thermal electrons is found to be less than 15% [72, 33]. The non-thermal fraction can also be as large as 30% [19]. 3C 120 is known to have a jet emission [18] and it is likely the observed X-ray emission is a combination of various components. We therefore model the spectrum with the EQPAIR model [12], the most advanced Comptonization model in XSPEC. This model evaluates the emission spectrum resulting from Comptonization, Coulomb collisions and pair production. This model can treat the Comptonization for a different nature of plasma (thermal, non-thermal and hybrid plasma) and even incorporates Compton hump from cold reflection. This is because in EQPAIR, only electrons with optical depth () are accelerated with total power characterised by the compactness parameter (such that , where is the luminosity or the power supplied to the electrons in the Comptonization region and R the size of the Comptonization region [15] that is split between thermal distribution with power () and non-thermal distribution with power and . These electrons then cool either through Compton scattering of soft photons or through Coulomb collisions. The parameter that plays an important role in characterising the overall spectral shape in EQPAIR is the parameter /. The soft compactness parameter () refers to the luminosity of the soft photons that is injected into the corona and the hard compactness parameter refers to the power supplied to the accelerated electrons in the source. To model the observed spectrum with EQPAIR, we fixed the centroid energy of the Fe K emission line to the best fit value found from CompTT above for a slab geometry. However, in EQPAIR model the geometry is spherical and the photons are induced homogeneously throughout the spherical cloud. We assumed that the input source of soft photons in EQPAIR is diskpn, a black body spectrum [25] with a peak temperature of 10 eV . The seed photon distribution can be modified in the model by changing which for this model fitting was fixed to 10. The inclination was fixed to 17 degrees and the iron abundance was taken to be solar. For the purpose of this modelling we considered the accelerated particles to be electrons from the thermal pool. The best fit parameters are given in Table 1. The observed and fitted spectra along with the residuals are given in Figure 5. Similar to CompPS and CompTT models, the fit of the data with EQPAIR model too provides a good description of the data with a reduced of 1.047(). However, the temperature is not among the default output parameters returned by EQPAIR though it is calculated in the model. We therefore used the chatter command (chatter level = 15) [12] and obtained = 23. The error in was obtained using minimization technique at the 90 % significance level. Thus, using the EQPAIR model we found = 23 keV. We found the best fit ratio of the hard to the soft compactness parameter, = . This points to similar power in the irradiating soft photons that enter the source region and in the heating of the electrons. The EQPAIR model yields the value of ionization parameter of the reflector to be 5.14 11.15. The electron optical depth obtained by the fit was = . The ratio , which gives the fraction of power supplied to energetic particles that goes into accelerating non-thermal particles was found to be . The value of is zero for a purely thermal model, while it is unity for a purely non-thermal model. Though obtained from the fit deviates much from zero, the detection of a high energy cutoff in the NuSTAR spectrum not much beyond the sensitivity of NuSTAR [51] and the non-detection of the source in rays suggest that Comptonization by non-thermal electrons if any is non-significant. The from EQPAIR model fit is poorer compared to CompPS and CompTT, though, the value from EQPAIR model fit agrees to that obtained from CompPS. Thus, it is likely that in 3C 120, for the observations analysed here, the electrons involved in the Comptonization process are predominantly thermal.
| Model Name | Parameter | Parameter | |
|---|---|---|---|
| Name (units) | Values | ||
| CompTT | |||
| TBabs*zTbabs*(zgauss+CompTT+refl(CompTT)) | (keV) | 6.43 0.06 | 0.986 |
| (Spherical geometry) | (keV) | 0.29 | |
| Nzgauss 10-5 | 5.50 | ||
| mean (keV) | 16 | ||
| mean | 5.1 | ||
| NCompTT 106 | 3.58 | ||
| 0.29 0.07 | |||
| Nrefl(CompTT) 10-2 | 2.82 | ||
| CompTT | |||
| TBabs*zTbabs*(zgauss+CompTT+refl(CompTT)) | (keV) | 6.43 0.06 | 0.986 |
| (Slab geometry) | (keV) | 0.29 | |
| Nzgauss 10-5 | 5.41 | ||
| mean (keV) | 9 | ||
| mean | 2.4 | ||
| NCompTT 107 | 1.17 | ||
| 0.30 | |||
| Nrefl(CompTT) 10-2 | 2.79 | ||
| CompPS | |||
| TBabs*zTbabs*(zgauss+CompPS) | (keV) | 6.43∗ | 0.996 |
| (Slab geometry) | (keV) | 0.29∗ | |
| (keV) | 25 2 | ||
| Compton parameter | 2.2 0.1 | ||
| 0.80 | |||
| 2.36 10-3 | |||
| NCompPS 10+8 | 3.23 0.03 | ||
| CompPS | |||
| TBabs*zTbabs*(zgauss+CompPS) | (keV) | 6.43∗ | 0.998 |
| (Spherical geometry) | (keV) | 0.29∗ | |
| (keV) | 26 | ||
| Compton parameter | 2.99 | ||
| 0.43 0.06 | |||
| 2.13 10-3 | |||
| NCompPS 10+7 | 5.26 | ||
| EQPAIR | |||
| TBabs*zTbabs*(zgauss+EQPAIR) | 0.90 0.32 | 1.047 | |
| 0.78 0.10 | |||
| (keV) | 23 | ||
| 0.60 0.08 | |||
| 0.19 0.03 | |||
| 5.14 11.15 | |||
| NEQPAIR 10-3 | 0.69 0.03 |


| Name | type | (keV) | log (MBH) | Reference | |||
|---|---|---|---|---|---|---|---|
| 3C 382 | BLRG/Sy 1 | 214 | 330 30 | 1.68 | 9.2 0.5 | 0.109 | 1 |
| 3C 390.3 | BLRG/Sy 1 | 116 | 16 | 1.70 0.01 | 8.4 0.1 | 0.240 | 2 |
| IC 4329A | Sy 1.2 | 186 | 50 | 1.73 0.01 | 6.8 0.2 | 0.082 | 3 |
| MCG-5-23-16 | NELG/Sy 2 | 116 | 25 2 | 1.85 0.01 | 7.8 0.2 | 0.031 | 4 |
| NGC 5506 | Sy 1.9 | 720 | — | 1.91 0.03 | 8.0 0.2 | 0.013 | 5 |
| J2127.4+5654 | NLSy1 | 108 | 53 | 2.08 0.01 | 7.2 0.0 | 0.090 | 6 |
| GRS 1734-292 | Sy 1 | 53 | 12.1 | 1.65 0.05 | 8.5 0.1 | 0.033 | 7 |
| 4C 74.26 | BLRG/Sy 1 | 183 | 46 | 1.84 | 9.6 0.5 | 0.037 | 8 |
| Ark 564 | NLSy1 | 42 | 15 | 2.27 0.08 | 6.4 0.5 | 1.10 | 9 |
| QSO B2202-209 | RQQ | 153 | 42 3 | 1.82 0.05 | 9.1 0.2 | 1.15 | 10 |
| NGC 5273 | Sy 1.5 | 143 | 57 | 2.27 0.08 | 6.4 0.5 | 1.1 | 11 |
| 3C 120 | BLRG/Sy 1 | 83 | 26 | 1.87 0.02 | 7.7 0.1 | 0.353 | This work |


IV. Discussion
IV.1. Coronal properties
The availability of high quality NuSTAR data from observations of about 120 ks has enabled the determination of the coronal properties of 3C 120. The time averaged spectrum covering the 379 keV band, when fitted with the phenomenological power law model gave the continuum power law index of = 1.85 0.01 [51]. However, values of 1.70 and 2.08 were found from XMM [65] and INTEGRAL [40] observations. From BeppoSAX observations, [71] found the continuum to be well described by a power law with 1.85 0.05, which is in close agreement with what is found from NuSTAR data by [51]. The difference in the photon index values obtained from different sets of observations acquired from different telescopes could point to spectral variations in the source.
Using the pexrav model with the inclusion of a Gaussian component to account for the presence of the Fe K line in the spectrum, [51] found values of = 1.87 0.02 and Ecut = 83 keV. 3C 120 has been observed before by BeppoSAX and OSSE. By modelling the BeppoSAX data with an e-folded power law or a thermal Comptonization model, [71] found a value of Ecut = 150 keV. Using ASCA observation that was contemporaneous with an OSSE observation, and modelling the spectra with a broken power law multiplied by an exponential factor, [70] found Ecut = 110 keV. Within error bars, the value of Ecut obtained from NuSTAR data using simple model fits matches with that known from BeppoSAX and OSSE data, however, has improved precision, with a manifold reduction in the errors. As these observations were taken at different epochs, it is also likely the Ecut is variable, but, this cannot be ascertained because of the large error bars in its values from earlier observations. The Fe K line is well fit by a Gaussian incorporated in CompTT with of 0.29 keV and 0.29 keV respectively for the slab and spherical geometry. This is much narrower than the value of = 0.8 keV obtained from ASCA observations [26].
In this work, we applied physical models to the data in contrast to the simple phenomenological models used earlier to understand the spectral characteristics of 3C 120 [51, 71]. We fitted CompTT, to the observed spectrum and used it to characterise the temperature and optical depth of the electrons in the corona for two geometries, namely a sphere and a slab. The goodness of the fit (with a nearly identical chi-square per degree of freedom of ) is found to be insensitive to the assumption of the coronal geometry as assumption of both the slab and spherical geometry fit the data equally well and we obtained keV for slab geometry and keV for the spherical geometry. These two model assumptions about the geometry of the corona gave different values of the optical depth with and for the slab and spherical geometry. This is expected because the optical depth for a slab geometry is measured vertically while for a sphere it is measured radially. Using CompPS an advanced Comptonization model available in XSPEC, we found values of 25 2 and 26 for the slab and spherical geometry. Within errors, these values of matches with that obtained from the fit of the EQPAIR model to the NuSTAR data that returned a value of = 23 keV. This value of is much lower than the value of of 176 keV obtained by [40]. This discrepancy might be attributed to the presence of a significant jet contribution during the epoch of observations done from INTEGRAL. Considering CompPS model, the derived value of is nearly identical for both the slab and sphere geometry of the corona. This could mean that the shape of the X-ray spectra emerging out of these two geometries is quite similar and the available spectral data from NuSTAR is not sufficient to distinguish between these two geometries.
IV.2. Nature of the corona in 3C 120
3C 120 is classified as a Seyfert 1 galaxy [11] and is also identified as a BLRG by [67]. It has an one sided jet and is also known to be a -ray emitter in Fermi data [55, 60], which provides additional evidence for the presence of a powerful relativistic jet, already seen in radio observations [31]. It is known that BLRGs have harder X-ray spectra in comparison to radio-quiet Seyfert galaxies [71]. However, spectral fits to the NuSTAR data analysed here by [51] using pexrav model gave a photon index of 1.87 0.02. This value is similar to that known for non-jetted Seyfert 1 galaxies and different from the X-ray spectrum of AGN with relativistic jets (blazars) that have 1.5 [56, 24]. Though the derived X-ray spectral index points to negligible contribution of the jet emission we checked for the signature of jets in our data by looking at the multi-wavelength properties during the epoch of NuSTAR observations. Using the light curves taken in the optical from the Catalina Realtime Transient Survey (CRTS; Drake et al. 16) and in the 15 GHz band in the radio from the Owens Valley Radio Observatory (OVRO, Richards et al. 54), we found that 3C 120 was in a moderately low flux state during the time of NuSTAR observation analysed here. The optical and radio light curves are given in Figure 6 with the epoch of NuSTAR observations indicated as a blue dashed line. Also, during the epoch of the NuSTAR observations used here, the source was not detected in -rays by Fermi [60]. The for 3C 120 in the soft and hard bands are 0.065 0.002 and 0.052 0.003 respectively. This is much lower than the average Fvar in X-rays shown by the blazar class of AGN [58, 52] Also, the variations seen in the NuSTAR data is similar to that of Seyfert galaxies and not blazars [52]. Model fits to the observed spectrum using CompPS that considers thermal Comptonization gave a value of = 26 keV for a spherical geometry. On the other hand, fits to the observed spectrum using EQPAIR that treats Comptonization from hybrid plasma gave = 23 keV. Comparing CompTT and CompPS models for a spherical geometry using F-test we find a F-value of 1.013. The test does not rule out the null hypothesis that the two chi-square distributions are the same at the 90% confidence level. Between CompPS and EQPAIR model fits for a spherical geometry we find a F-value of 1.0637, larger than the Fcritical value for a 90% confidence, rejecting the null hypothesis that the two chi-square distributions are the same. As the chi-square value of CompPS matches close to unity compared to EQPAIR, we consider CompPS model better represents the spectrum of 3C 120. Therefore, based on both spectral (presence of X-ray high energy cut-off and the X-ray photon index being close to that known for Seyfert galaxies) and timing analysis (non-detection of the source in -rays during the epoch of NuSTAR observations), it is clear that the X-rays observed by NuSTAR from 3C 120 is similar to that found in non-jetted Seyfert 1 galaxies considering a model of a thermal Comptonizing corona producing the X-ray in 3C 120. We note that the strength of the reflection component obtained here showed significant differences between various model fits, which might the due to the low S/N of the data beyond 30 keV.
IV.3. Comparison with the coronal properties of other AGN
Because of the degeneracies involved in the evaluation of the properties of the corona from the observed X-ray spectrum, it is needed to simultaneously measure the power law slope and the cut off energy. Measurements of this demands high quality X-ray spectra. Measurements of were known for several AGN from observatories such as BeppoSAX and INTEGRAL. However, most of these measurements have large error bars. Recently, observations from NuSTAR have started to provide reliable estimates of in few AGN, even though it might not be sensitive to sources with much larger that its spectral coverage.
To compare the coronal measurements reported here for 3C 120 with that of other AGN, we searched the literature for the availability of coronal properties of AGN based on observations either from NuSTAR alone or NuSTAR observations coupled with other telescopes. Focussing only on those sources that have measurements (with out lower limits) we arrived at a sample of twelve sources including 3C 120. They are given in Table 2. Also, the sources listed in Table 2 belong to different types of AGN that includes both radio-quiet Seyferts and BLRGs (3C 390.3 and 3C 120, 3C 282 and 3C 390.3). Analysis of a larger sample of AGN do indicate differences between BLRGs and radio-quiet Seyfert 1 galaxies, with BLRGs having, on average lesser Compton reflection, weaker Fe K line and harder hard X-ray spectra compared to radio-quiet Seyfert 1 galaxies [70]. These differences between BLRGs and radio-quiet Seyfert 1 galaxies are further confirmed by [71],however, the authors state that the distribution of these parameters in these two populations of sources is not distinct. [71] obtained mean values of = 1.74 0.04 and 1.95 0.05 for BLRGs and radio-quiet Seyferts respectively. The value of obtained for 3C 120 by [51] is closer to what is known for radio-quiet Seyfert 1 galaxies and is steeper than the other two BLRGs 3C 282 and 3C 390.3. This also supports the dormant state of the jet of 3C 120 during the epoch of NuSTAR observations reported here. Though the values of 3C 120 and 3C390.3 agree within a factor of two, the value of obtained for 3C 382 another BLRG is much larger. Therefore, based on existing data from NuSTAR, it is very difficult to say if the coronal properties of radio-loud AGN (BLRGs) and radio-quiet AGN (radio-quiet Seyfert 1 galaxies) are similar or different. Understanding the connection between radio-emission and coronal properties if any needs observations on a large number of sources of both types analysed in a homogeneous manner. For this modest sample of sources with NuSTAR observations culled from literature, we looked for correlation of with other physical parameters of the sources such as and the black hole mass. No correlation could be established (Figure 7). Therefore, more and more measurement of on a large sample that comprises both radio-loud and radio-quiet AGN are needed to know for the existence or absence of such correlations and largely to better understand the nature of the corona in AGN.

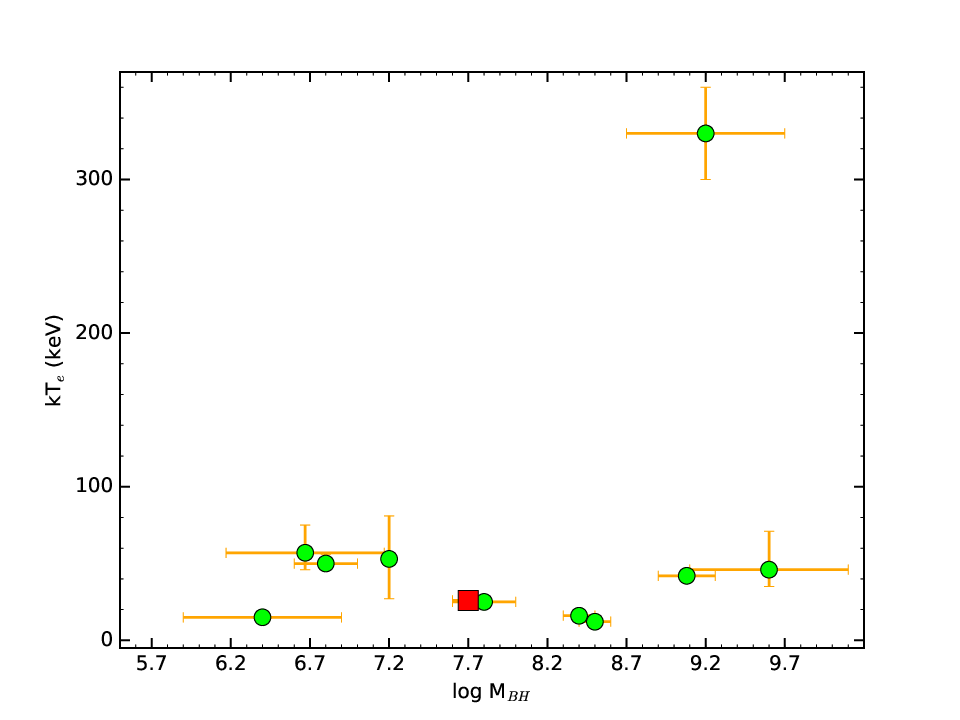
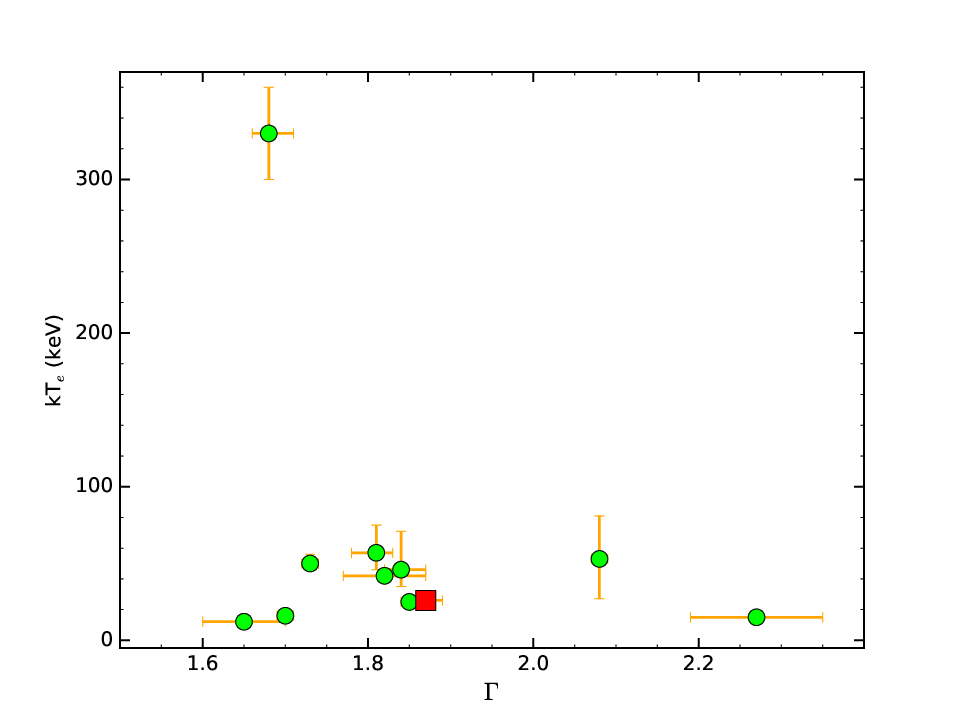
V. Summary
We have carried out timing and spectral analysis of the Seyfert 1 galaxy 3C 120 using 120 ks observations from NuSTAR. The results of our analysis are summarized below:
- 1.
The source showed variations in the count rates during the duration of the X-ray observations. The amplitude of count rate variations characterized by Fvar are found to be 0.065 0.002 and 0.052 0.003 for the soft (3 10) keV and the hard () keV bands respectively, thus showing more variations in the soft band relative to the hard band
- 2.
The X-ray spectrum characterised by HR is found not to show a correlation with the flux variations in the total band, indicating the spectrum was non-variable during the epoch of NuSTAR observation.
- 3.
From fit of CompTT model to the time averaged spectrum we found evidence for the presence of weak Fe K line in the data at 6.4 keV with an equivalent width of 60 5 eV. The line is best fit by a Gaussian with a of 0.29 keV
- 4.
Using the Comptonization model CompPS to fit the observed spectrum, we derived the kinetic temperature of the coronal electrons to be = 25 2 keV with a Compton y parameter of = 2.2 0.2 for a slab geometry. This is similar to the value of the kinetic temperature of = 26 keV obtained for a spherical geometry with a of 2.99. Also, fitting the observed spectrum with EQPAIR gave a best fit value of = 23 keV. Thus, fits to the data with the two most advanced Comptonization models available in XSPEC namely CompPS and EQPAIR gave similar values of coronal temperature. It is likely that the electrons participating in the comptonization process is predominantly thermal. Comptonization by non-thermal electrons if any is in-significant as (i) the source is not detected in -rays during the epoch of NuSTAR observations and (ii) the X-ray photon index is similar to that known for Seyfert galaxies
- 5.
3C 120 is known to have a large scale radio jet and is also a -ray emitter. However, NuSTAR data analysed here has made possible the detection of coronal spectral signatures, constrain and the reflection features, which are found similar to that known for radio-quiet Seyfert galaxies. This indicates that the contribution of jet emission to the X-ray is negligible in the NuSTAR data and is likely to be weak during the epoch of NuSTAR observations. Additional support to this is provided by similar value of obtained by both CompPS and EQPAIR model fits to NuSTAR observations. This is also supported by the low/moderate radio and optical flux states as well as non-detection by Fermi during the epoch of NuSTAR observations. To constrain the contribution of jet emission if any to the X-ray emission from 3C 120 requires observations at energies higher than that covered by NuSTAR.
References
- [1] Abdo, A. A., et al. 2010, ApJ, 720, 912
- [2] Acero, F., et al. 2015, ApJS, 218, 23
- [3] Anders, E., & Grevesse, N. 1989, Geochim. Cosmochim. Acta, 53, 197
- [4] Arnaud, K. A. 1996, in Astronomical Society of the Pacific Conference Series, Vol. 101, Astronomical Data Analysis Software and Systems V, ed. G. H. Jacoby & J. Barnes, 17
- [5] Ballantyne, D. R., et al. 2014, ApJ, 794, 62
- [6] Baloković, M., et al. 2015, ApJ, 800, 62
- [7] Balucinska-Church, M., & McCammon, D. 1992, ApJ, 400, 699
- [8] Bentz, M. C., & Katz, S. 2015, PASP, 127, 67
- [9] Brenneman, L. W., et al. 2014a, ApJ, 781, 83
- [10] —. 2014b, ApJ, 788, 61
- [11] Burbidge, E. M. 1967, ApJ, 149, L51
- [12] Coppi, P. S. 1999, in Astronomical Society of the Pacific Conference Series, Vol. 161, High Energy Processes in Accreting Black Holes, ed. J. Poutanen & R. Svensson, 375
- [13] Dadina, M. 2007, A&A, 461, 1209
- [14] Dickey, J. M., & Lockman, F. J. 1990, ARA&A, 28, 215
- [15] Done, C., & Gierliński, M. 2003, MNRAS, 342, 1041
- [16] Drake, A. J., et al. 2009, ApJ, 696, 870
- [17] Edelson, R., Turner, T. J., Pounds, K., Vaughan, S., Markowitz, A., Marshall, H., Dobbie, P., & Warwick, R. 2002, ApJ, 568, 610
- [18] Eracleous, M., & Halpern, J. P. 1998, ApJ, 505, 577
- [19] Fabian, A. C., Lohfink, A., Belmont, R., Malzac, J., & Coppi, P. 2017, MNRAS, 467, 2566
- [20] Fabian, A. C., Lohfink, A., Kara, E., Parker, M. L., Vasudevan, R., & Reynolds, C. S. 2015, MNRAS, 451, 4375
- [21] Fabian, A. C., et al. 2009, Nature, 459, 540
- [22] Fanaroff, B. L., & Riley, J. M. 1974, MNRAS, 167, 31P
- [23] George, I. M., & Fabian, A. C. 1991, MNRAS, 249, 352
- [24] Gianní, S., de Rosa, A., Bassani, L., Bazzano, A., Dean, T., & Ubertini, P. 2011, MNRAS, 411, 2137
- [25] Gierliński, M., Zdziarski, A. A., Poutanen, J., Coppi, P. S., Ebisawa, K., & Johnson, W. N. 1999, MNRAS, 309, 496
- [26] Grandi, P., Sambruna, R. M., Maraschi, L., Matt, G., Urry, C. M., & Mushotzky, R. F. 1997, ApJ, 487, 636
- [27] Haardt, F., & Maraschi, L. 1991, ApJ, 380, L51
- [28] Haardt, F., Maraschi, L., & Ghisellini, G. 1994, ApJ, 432, L95
- [29] —. 1997, ApJ, 476, 620
- [30] Halpern, J. P. 1985, ApJ, 290, 130
- [31] Harris, D. E., Mossman, A. E., & Walker, R. C. 2004, ApJ, 615, 161
- [32] Harrison, F. A., et al. 2013, ApJ, 770, 103
- [33] Johnson, W. N., McNaron-Brown, K., Kurfess, J. D., Zdziarski, A. A., Magdziarz, P., & Gehrels, N. 1997, ApJ, 482, 173
- [34] Johnson, W. N., et al. 1993, ApJS, 86, 693
- [35] Kammoun, E. S., et al. 2017, MNRAS, 465, 1665
- [36] Kara, E., García, J. A., Lohfink, A., Fabian, A. C., Reynolds, C. S., Tombesi, F., & Wilkins, D. R. 2017, MNRAS, 468, 3489
- [37] Lin, Y. C., et al. 1993, ApJ, 416, L53
- [38] Lohfink, A. M., et al. 2015, ApJ, 814, 24
- [39] —. 2017, ApJ, 841, 80
- [40] Lubiński, P., et al. 2016, MNRAS, 458, 2454
- [41] Malizia, A., Molina, M., Bassani, L., Stephen, J. B., Bazzano, A., Ubertini, P., & Bird, A. J. 2014, ApJ, 782, L25
- [42] Marinucci, A., Tortosa, A., & NuSTAR AGN Physics Working Group. 2016, Astronomische Nachrichten, 337, 490
- [43] Marinucci, A., et al. 2014, MNRAS, 440, 2347
- [44] Matt, G., et al. 2015, MNRAS, 447, 3029
- [45] Miller, J. M. 2007, ARA&A, 45, 441
- [46] Nolan, P. L., et al. 2012, ApJS, 199, 31
- [47] Pahari, M., McHardy, I. M., Mallick, L., Dewangan, G. C., & Misra, R. 2017, MNRAS, 470, 3239
- [48] Perola, G. C., Matt, G., Cappi, M., Fiore, F., Guainazzi, M., Maraschi, L., Petrucci, P. O., & Piro, L. 2002, A&A, 389, 802
- [49] Petrucci, P. O., et al. 2001, ApJ, 556, 716
- [50] Poutanen, J., & Svensson, R. 1996, ApJ, 470, 249
- [51] Rani, P., & Stalin, C. S. 2017, in presented at the RETCO meeting in Trivandrum, ed. x & y, 13
- [52] Rani, P., Stalin, C. S., & Rakshit, S. 2017, MNRAS, 466, 3309
- [53] Rees, M. J. 1984, ARA&A, 22, 471
- [54] Richards, J. L., et al. 2011, ApJS, 194, 29
- [55] Sahakyan, N., Zargaryan, D., & Baghmanyan, V. 2015, A&A, 574, A88
- [56] Sambruna, R. M., et al. 2006, ApJ, 646, 23
- [57] Shakura, N. I., & Sunyaev, R. A. 1973, A&A, 24, 337
- [58] Soldi, S., et al. 2014, A&A, 563, A57
- [59] Tanaka, Y., et al. 1995, Nature, 375, 659
- [60] Tanaka, Y. T., et al. 2015, ApJ, 799, L18
- [61] Titarchuk, L. 1994, ApJ, 434, 570
- [62] Tortosa, A., et al. 2017, MNRAS, 466, 4193
- [63] Urry, C. M., & Padovani, P. 1995, PASP, 107, 803
- [64] Vasudevan, R. V., & Fabian, A. C. 2007, MNRAS, 381, 1235
- [65] —. 2009, MNRAS, 392, 1124
- [66] Vaughan, S., Edelson, R., Warwick, R. S., & Uttley, P. 2003, MNRAS, 345, 1271
- [67] Walker, R. C., Benson, J. M., & Unwin, S. C. 1987, ApJ, 316, 546
- [68] Wilms, J., Allen, A., & McCray, R. 2000, ApJ, 542, 914
- [69] Woo, J.-H., & Urry, C. M. 2002, ApJ, 579, 530
- [70] Wozniak, P. R., Zdziarski, A. A., Smith, D., Madejski, G. M., & Johnson, W. N. 1998, MNRAS, 299, 449
- [71] Zdziarski, A. A., & Grandi, P. 2001, ApJ, 551, 186
- [72] Zdziarski, A. A., Johnson, W. N., & Magdziarz, P. 1996, MNRAS, 283, 193
- [73] Zdziarski, A. A., Lubiński, P., Gilfanov, M., & Revnivtsev, M. 2003, MNRAS, 342, 355
- [74] Zdziarski, A. A., Poutanen, J., & Johnson, W. N. 2000, ApJ, 542, 703
- [75] Zensus, J. A. 1989, in Lecture Notes in Physics, Berlin Springer Verlag, Vol. 334, BL Lac Objects, ed. L. Maraschi, T. Maccacaro, & M.-H. Ulrich, 3