Deuterated Formaldehyde in the low mass protostar HH212
Abstract
HH212, a nearby (400 pc) object in Orion, is a Class 0 protostellar system with a Keplerian disk and collimated bipolar SiO jets. Deuterated water, HDO and a deuterated complex molecule, methanol (CH2DOH) have been reported in the source. Here, we report the HDCO (deuterated formaldehyde) line observation from ALMA data to probe the inner region of HH212. We compare HDCO line with other molecular lines to understand the possible chemistry and physics of the source. The distribution of HDCO emission suggests it may be associated with the base of the outflow. The emission also shows a rotation but it is not associated with the Keplerian rotation of disk or the rotating infalling envelope, rather it is associated with the outflow as previously seen in C34S. From the possible deuterium fractionation, we speculate that the gas phase formation of deuterated formaldehyde is active in the central hot region of the low-mass protostar system, HH212.
Keywords:
astrochemistry– ISM: jets and outflows –ISM: molecules–ISM: individual objects: HH 2121 Introduction
Stars form mainly due to gravitational contraction of a molecular cloud. Molecular cloud is like a vast laboratory for space chemistry. From the verge of collapse to star formation, a molecular cloud goes through different stages. Chemical changes during this evolution acts as a hint to understand physical and chemical processes associated with the source. For example, SiO is a good shock tracer, high-velocity CO line wings are a good tracer of outflows; CH3OH can trace other kinds of environments, including outflows (Taquet et al., 2015) and even cold gas in pre-stellar cores (Vastel et al., 2014), C17O helps to know disk properties in some cases, etc. After the collapse of a molecular cloud, a young stellar object forms at the central region. This central region is embedded in a thick rotating envelope which further forms a disk like region. Some of the matter is often ejected in the form of bipolar outflow carrying significant amount of angular momentum. Lada et al. (1987) classified an evolutionary sequence of young stellar objects depending on the spectral energy distribution, e.g., class I, class II, class III. Younger protostars are often called class 0 object (Andre et al., 1993). HH212 is thought to be a Class 0 object of low-mass proto stellar system, located in Orion at 400pc (Kounkel et al., 2017).
The inner region of the low-mass star-forming cores may be enriched with complex molecules, e.g., methyl formate (HCOOCH3), ethyl cyanide (), dimethyl ether (), methyl alcohol () and formaldehyde (H2CO) (Bisschop et al., 2008; Bottinelli et al., 2004; Cazaux et al., 2003). To differentiate between the ‘hot core’ region that are present in high mass star forming region, a term ‘hot corino’ (Ceccarelli et al., 2007) is often used in the context of a low mass star forming region. Molecules can form both in the gas phase and on the grain surface – during the evolution of molecular cloud in gas phase, molecules can deplete on grain surface and start new chemistry there. Grain surfaces help formation of complex molecules by hydrogenation; there are also routes by which complex molecules can also form in the gas phase too. Complex molecules like HCOOCH3, CH3OCH3 (Balucani et al., 2015), NH2CHO (Barone et al., 2015) can effectively form in gas-phase following sublimation of key simpler precursors, e.g., CH3OH, NH2, HDCO from grain mantles. Complex molecules which form on grain mantles can populate the gas-phase by desorption from grain mantels. Due to thermal desorption in high-temperature region e.g., hot core, hot corinos, complex molecules or their precursors come out of the grain surfaces in gas phase. For this reason, high deuteration of complex species in grain surfaces may be reflected to gas phase (e.g., Ceccarelli & Caselli et al., 2014; Das et al., 2015a; Das et al., 2015b). Deuterated water has been reported by Codella et al. (2016) in the hot-corino of HH212. Very recently Lee et al. (2017a) reported D2CO and singly deuterated methanol (CH2DOH), first deuterated complex molecule to be observed in central region of HH212.
Due to limited spatial resolution of observational facilities in the past, only a few hot-corinos have been reported till now, on 100 AU scale, e.g., IRAS 16293-2422, NGC 1333 IRAS2A, IRAS4A etc. (e.g., Imai et al., 2016; Jørgensen et al., 2012 and references therein). Recently, Codella et al. (2016) has suggested a ‘hot-corino’ region in HH212 system. The HH212 region is an ideal system to investigate different processes (e.g., infall, rotation, hot corino, bipolar outflow) related to the formation of a low mass protostar. The HH212 source has been observed in the past using Sub-millimeter array (SMA)(Lee et al., 2006), the IRAM Plateau de Bure (PdB) interferometer (Codella et al., 2007) and Atacama Large Millimeter Array (ALMA) (Lee et al., 2014; Codella et al., 2014). ALMA, due to its high spatial resolution and sensitivity has revealed much more detail than any other previous observations. The HH212 system has bipolar jets as observed by SiO, SO, and SO2 emission lines (Codella et al., 2014; Podio et al., 2015). It has a central hot-corino surrounded by a flattened, infalling and rotating envelope as observed by C17O and HCO+ (Lee et al., 2006; Lee et al., 2014). Also, from HCO+ and C17O emission line observations, Lee et al. (2014), Codella et al. (2014) suggested a compact disk (AU) rotating around the source of M. Later observation (Lee et al., 2017b) resolved the disk and suggested the disk size to be 40 AU.
In this paper, we use ALMA archival dataset 2011.0.00647.S and report emission of deuterated formaldehyde line from central hot-corino region. We compare the HDCO emission with methanol (CH3OH), C34S and C17O and try to explain chemistry around the central region of the source. The line search is performed using splatalouge (www.splatalouge.net) and molecular data has been taken from the CDMS (Müller et al., 2001; Müller et al., 2005) and JPL molecular database (Pickett et al., 1998).
2 Observations
The HH212 protostar system was observed with ALMA (Band -7) using 24 12m antennas on 2012 December 1 (Early Science Cycle 0 phase , Codella et al. 2014). In this observation, the shortest and the longest baselines were respectively 20m and 360m. We report HDCO (Table 1) and include the CH3OH, C34S and C17O lines to compare with deuterated formaldehyde emission. The datacubes have a spectral resolution 488 KHz ( km s-1), a typical beam FWHM of at position angle (PA) . The observed spectral windows were 333.7-337.4 GHz and 345.6-349.3 GHz, the typical rms level was 3-4 mJy beam-1 in 0.43 km s-1 channels. The data were calibrated with the CASA package, with quasars J0538-440 and J0607-085 as the passband calibrators, quasar J0607-085 as the gain calibrator, and Callisto and Ganymede as the flux calibrators. We generated spectral cubes by subtracting the continuum emission in visibility data. We used Briggs weighting with robustness parameter 0.5 for CLEANing the image. Positions are given with respect to peak continuum of the MM1 protostar located at (Lee et al., 2014).
3 Results and Discussions
ALMA band 7 is found to be rich in numerous spectral transitions in a region towards MM1 protostar. Here, we discuss three lines, C17O, deuterated formaldehyde line (HDCO 5(1,4)-4(1,3)) and methanol (CH3OH(v0 7(1,7)- 6(1,6)). The details of the lines are given in Table 1. The C17O (3-2) line transition was used by Codella et al. (2014) to describe the rotating envelope around the central region. Here, we consider C17O (3-2) emission as optically thin and have calculated its column density around different regions of the source. We compare C17O column density with HDCO and CH3OH column density to study the chemistry around the MM1 protostar. From Figure 1, HDCO emission is seen in central region of the protostar system and partially resolved (synthesized beam size and image size ). For the first time, we are reporting deuterated formaldehyde emission around the MM1 protostar position. Recent work by Leurini et al. (2016) has described the kinematics of methanol in HH212. Moreover, from a recent observation (ALMA, 2015) Lee et al. (2017a) found that methanol is from a rotating disk environment. Here, we compare formaldehyde emission with the most intense methanol line (Eu=79 K). Both the line profiles of formaldehyde and methanol have peaks at 1.9 km s-1, i.e., close to the systematic velocity 1.7 km s-1 (Lee et al., 2014). Though Codella et al. (2014) suggested a systematic velocity of 1.3 km s-1, here we consider the systemic velocity to be 1.7 km s-1.
| Species | Transition | Frequency | S | |
|---|---|---|---|---|
| (GHz) | (K) | D2 | ||
| CH3OH | v0 7(1,7)- 6(1,6) | 335.58202 | 78.97 | 5.55 |
| HDCO | 5(1,4)-4(1,3) | 335.09678 | 56.25 | 26.05422 |
| C17O | J=3-2 | 337.06112 | 32.35 | 0.01411 |
| C34S | J=7-6 | 337.396459 | 50.23 | 25.57 |

3.1 HDCO emission
The HDCO emission is almost symmetric around the systematic velocity ( km s-1), so it can be assumed that it originates near the central hot region. In this region, the dust temperature is high enough, and molecules on the grain surface (i.e., on the dust) easily desorb to gas phase. Temperature of hot-corinos may vary from few 10’s K to few 100’s K (Parise et al., 2009; Codella et al., 2016). Here, we have observed only one HDCO transition, so the temperature can not be derived directly. Codella et al. (2016) used the same dataset and listed five acetaldehyde (CH3CHO) transitions; from optically thin LTE analysis of CH3CHO they suggested a temperature of K. Leurini et al. (2016) reported a rotational temperature 295 K for methanol emissions, while Lee et al. (2017a) finds an excitation temperature of 16585 K for deuterated methanol transitions. Considering all these results and roughly the temperature variation along the radius (Lee et al., 2014) we have considered five excitation temperatures (20, 40, 90, 160, 300 K) for our calculations. We consider some low excitation temperatures e.g., 20 & 40 K for regions away from hot-corino and high-temperatures for a hot region. Here we assume the HDCO emission region to be optically thin and local thermodynamic equilibrium (LTE) condition is satisfied. The details of column density calculation and the variation of it, is described in Section 3.3.
In Figure 1, we see that HDCO emission is concentrated in a circular region around the central protostar position, i.e., the peak of continuum emission. The emission is elongated along the jet direction. As the emission is only partially resolved, we can not infer conclusively whether the elongation is real or because of the effect of synthesized beam size. Figure 2 shows that near the systematic velocity, the HDCO emission is most extended; though the extended emission feature is weak (), it is absent in higher velocity channels from the systematic velocity. This extended emission feature is similar to the ‘X’ shaped outflow cavity as traces by C34S emission. To draw a further conclusion, in Figure 3 we plot three velocity channels near the systematic velocity for HDCO emission and compare it with C34S channel maps. The C34S emission is tracing a dense gas component. ‘X’ shaped outflow is closely related to the bipolar jet or outflow near the systematic velocity (Codella et al., 2014). From Figure 3, it can be seen that though the emissions of HDCO away from the central source is weak, it is significantly similar to the C34S emission near the systematic velocity. To find whether HDCO emission shows any rotation, we plot centroid emission positions of various velocity channels of C34S and HDCO line in Figure 4. Codella et al. (2014) finds an evident rotation around jet for C34S emission in the southern lobe. From Figure 4 we can see that the there is definite signature of rotation for C34S as the blue shifted and red-shifted emission are situated away from the central peak position and the jet axis. At low velocities (), it is clearly showing rotation (in southern lobe) as emission centroids of blue-shifted and red-shifted emission situated roughly symmetrically away from the jet-axis and below the disk plane. At a high velocity, the rotation feature is not clear but becomes more collimated towards the jet axis. The HDCO emission centroids also show a signature of rotation which is clear from Figure 4. Looking to the southern portion of emission there seems to be some similarity with C34S features. As the intensity of emission away from the source is very faint for HDCO and the shift of different velocity channels is less than the beam size, this inference may not be conclusive. We can speculate that as the emission centroid (red-shifted southern portion in Fig. 4) of HDCO is away from the disk plane and shifts along the jet axis. So, it is not associated with disk rotation; at smaller scales, it may be associated with disk wind or small-scale outflow or cavity rotation but with current spatial resolution of the ALMA data we cannot confirm it. Leurini et al. (2016) finds that methanol (CH3OH) could trace the base of the low-velocity of the small scale outflow and another higher resolution observation (0.04′′, Lee et al., 2017a) suggests that it is from a warm environment near the disk surface. Hence, to discuss the origin HDCO of emission, we compare HDCO emission with CH3OH and C17O emission in the next section.


3.2 CH3OH, and C17O emission
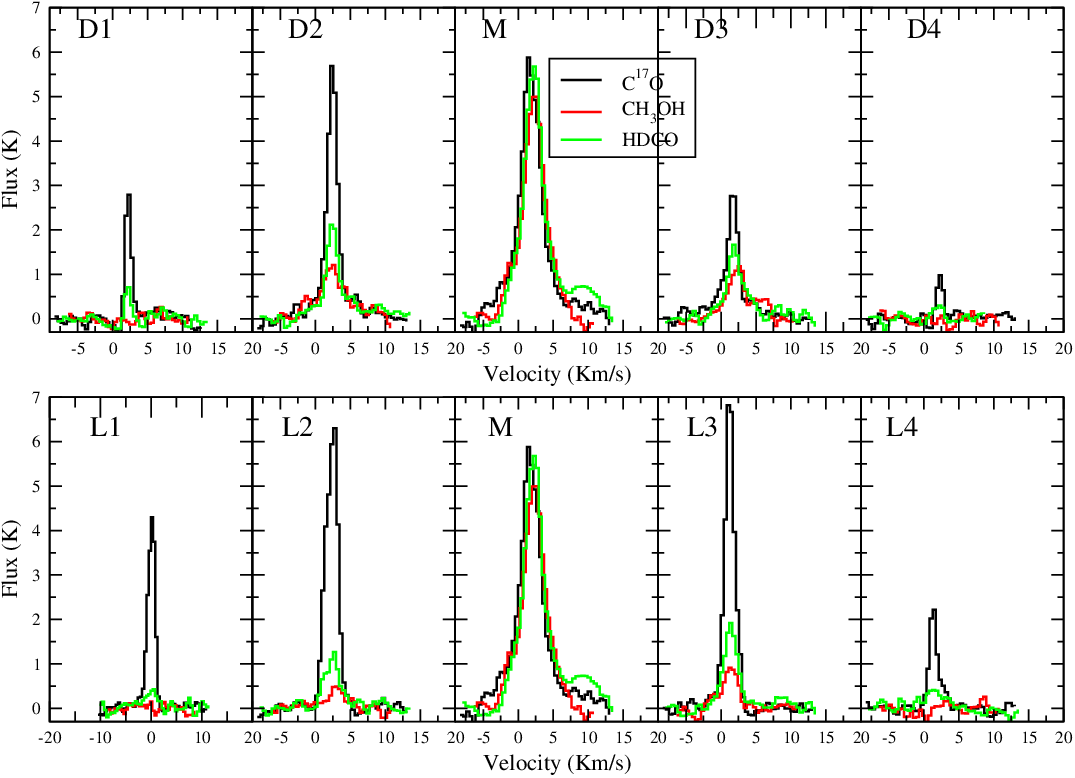
Methyl alcohol emission of v0 7(1,7)- 6(1,6) transition is also observed around the MM1 protostar position. From the spectral signature (Figure 7) it is seen that CH3OH emission is from a smaller region than HDCO around the protostar position. The CH3OH line was identified using CDMS/JPL molecular database, having Eu=79K. The kinematics of methanol emission is already described by Leurini et al. (2016).
Methanol emission is from a smaller region () than that from HDCO emission region. In Figure 5 we compare HDCO emission centroid for different velocity channel with C17O and CH3OH. C17O emission traces disk rotation at high velocity and rotating outflow cavity at low-velocity (Codella et al., 2014). Methanol emission shows rotation as the same sense of C17O and traces small-scale outflow. Though the spatial resolution () is not enough to ascertain the fact, we have compared HDCO emission with these emissions. At small velocities, HDCO emission shows some rotation near the disk plane. This rotation may trace small scale outflow or a rotating environment (Lee et al., 2017a) near the disk plane. At high velocities, the red-shifted centroid shifts towards jet axis and away from disk plane in southern portion of the outflow region. This is very different than the methanol velocity centroids at high velocities. Hence at small velocity it may trace some rotation near the disk which may be because of small-scale outflow or some rotation environment (Lee et al., 2017a). At systematic velocities HDCO emission traces ‘X’ shaped outflow cavity similar to the C34S emission; it may trace small scale outflow too but due to limited spatial resolution we are not sure about this.
3.3 Column density calculation and abundances
We calculate the column densities of C17O and HDCO, assuming the lines are optically thin. As we do not know the rotational temperature of HDCO transition, we consider a range of temperature (20 K-300 K) as the excitation temperature of the molecular transition. Now,
| (1) |
where, gu is the statistical weight of the upper level u, Ntot is the total column density of the molecule,is the rotational partition function, is rotational temperature, is the upper energy level, is the Boltzman constant, is the frequency of the line transition, is the Einstein co-efficient of the transition. is the integrated line intensity. Calculated column density is a beam average column density, so we consider the beam dilution factor, given by,
| (2) |
where, is the source size and is the beam size. As the source is marginally resolved in HDCO emission, we are unsure about the source size. Codella et al. (2016) considered source size , which is about the size of dusty disk (Lee et al., 2017b). Leurini et al. (2016) considered source size . Here, we consider source size . In that case, the calculated column density would be multiplied by for central region only (region ‘M’ in Fig. 6), if we consider beam dilution. The spectral profile for different region is shown in Figure 7. Calculated average column densities without beam dilution correction over different regions (Figure 6) are enlisted in Table 2. Consequences of beam dilution effect are discussed section 3.5.
| Regions | Column densities for various Trot in unit of (cm-2) | Error | ||||
|---|---|---|---|---|---|---|
| 300 K | 160 K | 90 K | 40 K | 20 K | ||
| M | 12.3 | 5.6 | 3.1 | 2.0 | .. | 22.8% |
| L2 | .. | 1.0 | 0.5 | 0.36 | 0.52 | 25.6% |
| L3 | .. | 1.3 | 0.74 | 0.48 | 0.69 | 23.6% |
| D2 | . . | 0.86 | 0.48 | 0.31 | 0.44 | 25.2% |
| D3 | .. | 1.3 | 0.74 | 0.48 | 0.69 | 25.4% |
In the Table 2 we have shown the column density for different regions along the jet and perpendicular to the jet axis. The central hot-corino is expected to be hot, so we have excluded the lowest temperature (20 K) in our range of temperature to calculate column density in the central region. Similarly, in regions away from the central source we have not considered the 300 K temperature for the calculation. Considering the H2 column density cm-2 (see next section), X. The errors for column density are calculated for noise and statistical (Gaussian) fitting. If we consider a calibration error of 20% then the same uncertainty will be added to column density calculation in addition to the statistical error; the resultant error shown in Table 2. Due to low signal to noise ratio we have not estimated the column densities in outermost regions e.g. L1, D1 in Figure 6
3.4 C17O emission and disk mass
In earlier Section it was mentioned that C17O traces a Keplerian disk at high velocities. Assuming C17O emission to be optically thin, we can calculate disk mass from the beam-averaged C17O column density and converting it to H2 volume density. For conversion of C17O column density to H2, we use =1792 (Wilson & Rood et al., 1994) and . In region ‘M’ (Figure 6 ) C17O column density for Trot = 90-300 K is 1.3–3.3 cm-2, so N cm-2, as a beam averaged column density. As the disk is not resolved and has been seen edge on, considering beam dilution H2 volume density becomes where the disk size is AU (Codella et al., 2014). Using the above information H2 volume density becomes 1.3–3.4cm-3. Considering H2 volume density cm-3, we derive the disk mass to be 0.016 M⊙. It is close to the value 0.014 M⊙, estimated by Lee et al. (2014). Here, we have considered the formula, , where ‘r’ is the disk radius and ‘H’ is the disk height from mid-plane; here the factor, 1.4 accounts for the mass in the form of helium. We consider HAU and the disk radius to be 90 AU (Lee et al., 2014). The disk mass can also be calculated from continuum emission. We have considered that the continuum from HH212 disk is optically thin and isothermal. Though the disk mass is not constant as suggested by Lee et al. (2014), we have calculated it by assuming a dust temperature to be 90 K. Following earlier work (Tobin et al., 2012), we assume the spectral index =1 (Kwon et al., 2009), and the dust opacity =0.035 g cm-2 at 850 m (Andrews et al., 2005). We use the following formula (Tobin et al., 2012) to calculate the disk mass
With Tdust=90 K, the disk mass is 0.0159 M⊙, which is close to 0.016 M⊙, the disk mass calculated based on hydrogen mass.
3.5 Discussion
3.5.1 chemistry
Formaldehyde can be formed in both the gas and the grain phase. On grain surfaces,
formaldehyde forms through sequential reactions of H or D atom with CO:
CO HCO H2CO and
CO DCO HDCO/D2CO (Cazaux et al., 2011; Taquet et al., 2012). The grain phase reactions
occur mainly in cold temperature condition (50K). Gas phase formation of formaldehyde and its deuterated form is
also possible through reaction involving CH2D+. More specifically, at relatively high temperatures, T
100K or higher, this reaction is relevant to the central hot-corino region of HH212
(Tobin et al., 1987; Oberg et al., 2012). Reaction involving CH2D+ is not active in cold region due to
its high exothermicity (E of 654 K, see Roueff et al. 2013) but in high temperature region this reaction
may take part and favours deuterium fractionation in gas-phase:
CH + HD CH2D+ + H2 + E.
Fontani et al. (2014) first time disentangled the emission of deuterated formaldehyde form on grain surfaces from its gas phase production. In our observation we have not seen any H2CO line but still we can infer about the production region and possible production route of deuterated formaldehyde (HDCO). HDCO emission is from two regions, one is from central hot-corino region another is from outflow cavities. The impact of bipolar jet on the cavities may release HDCO from grain surfaces due to sputtering or sublimation from grain mantle (e.g., see Codella et al. 2012). As the regions in the outflow cavities have low-temperature, hence we can expect the production of HDCO is mainly from grain surfaces. If we consider the column density of formaldehyde in central region assuming a temperature 160 K and 40 K in one of the outflow region (south-west lobe, centered at ; see Fig 2), then the column densities are respectively 5.6 and 0.18 cm-2. In the outflow region this is a factor less than the central region column density of HDCO. From C17O emission we can get a rough idea about the density difference in these two regions. In the same region (south-west lobe) we have calculated the C17O column density, and it is a factor of 10 less than the centre region (‘M’). Hence, if HDCO comes from only grain surfaces then their column densities should be decreased similarly by the density factor. Considering the density differences, the column density in the central region is a factor of three () higher. Hence, indirectly it implies that there is active gas phase HDCO production in central hot-corino region along side the grain-phase desorbed HDCO. Recently, another doubly deuterated formaldehyde (D2CO) has been reported by Lee et al. (2017a) for the same source for a beam size of . In this work, HDCO line emission is marginally resolved, if we consider emission region then considering the beam dilution, a factor of 10 will be multiplied by central region column density. In that case, the column density of HDCO and D2CO would be comparable (). If we consider smaller regions of the emission region such as the D2CO beam, then the column density will be higher for HDCO. Hence, considering the source size , the D2CO/HDCO ratio becomes . We guess the emission region for HDCO will not be as small as that for D2CO, in that case the deuteration of formaldehyde in quite higher than methanol for the same source. Methanol deuteration (D/H) for the HH212 is 2.4 as reported by Bianchi et al. (2017). On the other hand Lee et al. (2017a) suggested D/H for methanol in the disk environment. If we consider D/H ratio 0.27 to be true then methanol is still produced effectively on the grain surface in the disk environment. Bianchi et al. (2017) used and LTE approximation to calculate methanol column density. If we consider D/H ratio of 2.4 to be more likely then probably due to high temperature deuterated methanol production is not efficient in the hot-corino region. We speculate that deuterated formaldehyde can still be produced in this region through gas phase reaction network unlike the methanol production.
3.5.2 kinematics/morphology
In Figure 6 we have defined different circular regions ( diameter) comparable to the beam size and the observed spectra towards these regions are shown in Figure 7. We can see from Figure 4, 5 there may be emission from rotating environment or small-scale outflow near the disc but it is very uncertain. At high velocity the emission is certainly shifted above the disk along the jet which signifies that the emission is affected by outflow or disk-wind at the base of the jet. The column density (Table 2) on both sides (L2, L3) of the central circular region of diameter is less than that at the central region. We can see a jump in column density for HDCO. This is due to the fact that at the disk (AU) and envelope interface there is a sharp rise of temperature and density due to accretion shock. Also, from Figure 7 we see that the spectral signature of methanol emission is absent from the outermost regions (L1, L4, D1, D4) though a weak signature of HDCO emission is present. From this also we can say that HDCO emission is more extended than methanol. Lee et al. (2017a) at a scale of found that difference of emission regions of the complex molecules is partly due to different A-coefficients. In that observation of HH212, it was found that molecules with comparatively low A-coefficients are seen to be more extended than the that with high A- coefficients. Here, A-coefficient of methanol transition is lower than that of HDCO, but the region seems to be more compact than that of HDCO. Higher A-value may correspond to higher critical density. Guzman et al. (2011) described H2CO critical densities ; due to high density ( cm-3) in the central region it is expected that LTE condition is maintained for the reported molecular transitions here. Hence, we can speculate that it is due to local physico-chemical condition and high line strength, comparatively lower Eu of HDCO which may be responsible for the emission difference. Another difference we can see for methanol and HDCO emission in central region (‘M’) is this: HDCO has a red-shifted peak which is absent in CH3OH emission. This peak may be from the line contamination of other molecular transition, but we have not found any such line from other molecules. Alternatively, this may be related to the high velocity outflow from the base of the jet.

4 Conclusions
In this letter we described the emission of deuterated formaldehyde (HDCO) from the hot inner region of HH212. This emission is limited mainly to the inner AU. The kinematics of HDCO is quite similar to that of the C34S emission (Leurini et al., 2016) near systematic velocity. HDCO traces large scale outflow cavity near systematic velocity; it may trace small-scale outflow or disk wind but due to limitation of spatial resolution in this observation we are uncertain about this. On the other hand, both methanol and HDCO emission peak values are km s-1 and the spectral profile is symmetric in low to medium velocity range (). The asymmetry at high velocity for HDCO may be associated with the outflow near the disk plane. The HDCO rotation may be associated with the disk wind or rotating environment (Lee et al., 2017a); or to the rotating cavity wall, similar to C34S. Due to limited resolution of the observation we cannot conclude about the rotation with certainly. The emission is assumed to be optically thin. Here we observe only one transition of HDCO. Thus we cannot determine the excitation temperature. We have considered a range of possible temperature depending on earlier studies and typical hot-corino temperature assumed in the literature. The column density of HDCO is . Though we have not observed any H2CO transition but comparing results of D2CO given in Lee et al. (2017a) we speculate that the deuterium fractionation of formaldehyde is relatively higher than methanol in the central region. We guess that the gas phase formation of deuterated formaldehyde is active in the central hot region in the low-mass protostar HH212.
Acknowledgements
We acknowledge the anonymous referee for the constructive comments. We also thank Dr. Nirupam Roy (IISc, India) for his helpful suggestions. DS is thankful to Department of Space, Govt. of India (PRL) for support in continuing research and also want to thank Young Visitor Programme (KASI) for financial help to work in Korea Astronomy Space science Institute for a short time. AD want to acknowledge ISRO Respond (Grant no. ISRO/RES/2/402/16-17). C. -F.L. acknowledges grants from the Ministry of Science and Technology of Taiwan (MoST 104-2119-M -001-015-MY3) and Academia Sinica (Career Development Award). This paper makes use of the following ALMA data: ADS/JAO.ALMA#2011.0.00647.S. ALMA is a partnership of ESO (representing its member states), NSF (USA) and NINS (Japan), together with NRC (Canada), NSC and ASIAA (Taiwan), and KASI (Republic of Korea), in cooperation with the Republic of Chile. The Joint ALMA Observatory is operated by ESO, AUI/NRAO and NAOJ.
References
- Andre et al. (1993) Andre, P., Ward-Thompson,D.,&Barsony,M.1993,ApJ,406,122
- Andrews et al. (2005) Andrews S. M. & Williams J. P., ApJ., 2005, 631,1134.
- Balucani et al. (2015) Balucani, N., Ceccarelli, C., Taquet, V., 2015, MNRAS 449, L16.
- Barone et al. (2015) Barone, V., Latouche, C., Skouteris, D. et al., 2015, MNRAS 453, L31.
- Bisschop et al. (2008) Bisschop, S. E., Jorgensen, J. K., Bourke, T. L., Bottinelli, S., & van Dishoeck, E. F. 2008, A&A, 488, 959.
- Bianchi et al. (2017) Bianchi, E., Codella, C., Ceccarelli, C. et al. 2017, A&A, 606, L7.
- Bottinelli et al. (2004) Bottinelli, S., Ceccarelli, C., Neri, R., et al. 2004, ApJ, 617, L69
- Bottinelli et al. (2008) Bottinelli, S., Ceccarelli, C., Lefloch, B., Williams J. P. et al., 2004, ApJ, 615, 354.
- Cazaux et al. (2003) Cazaux, S., Tielens, A. G. G. M., Ceccarelli, C., et al. 2003, ApJ, 593, L51
- Ceccarelli et al. (2007) Ceccarelli C., Caselli P., Herbst E., Tielens A.G.G.M., & Cazaux E. 2007,Protostars and Planets V (Tucson: University of Arizona), 47
- Ceccarelli & Caselli et al. (2014) Ceccarelli, C., Caselli, P., Bockelée-Morvan, D. et al. 2014, Protostars and Planets VI, pp. 859-882, University of Arizona Press.
- Cazaux et al. (2011) Cazaux, S., Caselli, P., & Spaans, M. 2011, ApJ,741, L34.
- Codella et al. (2016) Codella, C., Ceccarelli, C., Cabrit, S., Gueth, F., et al. 2016, A& A, 586, L3
- Codella et al. (2007) Codella C., Cabrit S., Gueth F., et al. 2007, A&A 462, L53
- Codella et al. (2012) Codella, C., Ceccarelli, C., Lefloch, B., et al. 2012, ApJL, 757, L9.
- Codella et al. (2014) Codella, C., Cabrit, S., Gueth, F., et al. 2014, A&A, 568, L5.
- Das et al. (2015a) Das, A., Majumdar, L., Chakrabarti, S. K., & Sahu, D. 2015a, NewA, 35, 53
- Das et al. (2015b) Das, A., Sahu, D., Majumdar, L. & Chakrabarti, S. K., 2015b, ApJ, 808, 21.
- Fontani et al. (2014) Fontani, F., Codella, C., Ceccarelli, C., Lefloch, B. et al. 2014, ApJ, 788, L43.
- Guzman et al. (2011) Guzman, V., Pety, J., Goicoechea J.R., et al. 2011, A&A 534, A49.
- Imai et al. (2016) Imai, M., Nami Sakai, N., Oya, Y., et al. 2016, ApJ, 830:L37
- Jørgensen et al. (2012) Jørgensen, J. K., Favre, C., Bisschop, S. E., et al. 2012, ApJ, 757, L4
- Kounkel et al. (2017) Kounkel, M.,Hartmann, L., Loinard, L. et al., 2017, ApJ, 834,142
- Kwon et al. (2009) Kwon W., Looney L. W., Mundy L. G., Chiang H.-F., Kemball A. J., ApJ., 696, 841, 2009
- Lada et al. (1987) Lada,C.J. 1987,in IAU Symp.115:Star Forming Regions (D.Reidel Publishing Co.,Dordrecht),Vol.115,1
- Lee et al. (2006) Lee, C.-F., Ho, P. T. P., Beuther, H., et al. 2006, ApJ, 639, L292
- Lee et al. (2006) Lee C.-F., Ho P.T.P., Beuther H., et al. 2006, ApJ 639, L292
- Lee et al. (2014) Lee, C.-F., Hirano, N., Zhang, Q., et al. 2014, ApJ, 786, 114
- Lee et al. (2008) Lee, C.-F., Ho, P. T. P., Bourke, T. L., et al. 2008, ApJ, 685, 1026.
- Lee et al. (2017a) Lee, C. -F, Li, Z-Y, Ho, Paul T. P. et al. 2017a, ApJ, 843,27.
- Lee et al. (2017b) Lee, C. -F, Li, Z-Y, Ho, Paul T. P. et al.2017b, Sci. Adv. 3,e1602935.
- Leurini et al. (2016) Leurini, S., Codella, C., Cabrit, S., et al. A&A 595, L4, 2016.
- Müller et al. (2005) Müller, H.S.P., Schlöder, F., Stutzki, J., et al. 2005, Journal of Molecular Structure, 742, 215
- Müller et al. (2001) Müller, H.S.P., Thorwirth, S., Roth, D.A., et al. 2001, A&A, 370, L49
- Oberg et al. (2012) Oberg, K. I., Qi, C., Wilner, D. J., & Hogerheijde, M. R. 2012, ApJ, 749, 162.
- Parise et al. (2009) Parise, B., Leurini, S., Schilke, P., et al. 2009, A&A, 508, 737
- Parise et al. (2006) Parise, B., Ceccarelli, C., Tielens, A. G. G. M., et al. 2006, A&A, 453, 949
- Pickett et al. (1998) Pickett, H. M., Poynter, R. L., Cohen, E. A., et al. 1998, J. Quant. Spectr. Rad. Transf., 60, 883
- Podio et al. (2015) Podio, L., Codella, C., Gueth, F., et al. 2015, A&A, 581, 85
- Roueff et al. (2013) Roueff, E., Gerin, M., Lis, D. C., et al. 2013, Journal of Physical Chemistry A, 117, 9959.
- Sahu et al. (2015) Sahu D., Das A., Majumdar L., Chakrabarti S. K., 2015, New Astron., 38,23
- Taquet et al. (2012) Taquet, V., Ceccarelli, C., & Kahane, C. 2012, ApJ, 748, L3
- Taquet et al. (2015) Taquet, V., López-Sepulcre, A., Ceccarelli, C., et al. 2015, ApJ, 804, 81
- Tobin et al. (2012) Tobin J.J., Hartmann L., Chiang H-F.,Wilner D.J., et al. 2012, Nature, 492, 83–85.
- Vastel et al. (2014) Vastel, C., Ceccarelli, C., Lefloch, B., and Bachiller, R; 2014, ApJ, 795, L2.
- Wilson & Rood et al. (1994) Wilson, T. L., & Rood, R. 1994, ARA&A, 32, 191
- Tobin et al. (1987) Wootten, A. 1987, in IAU Symposium, Vol. 120, Astrochemistry, ed. M. S. Vardya & S. P. Tarafdar, 311–318.