Probing Episodic Accretion in Very Low Luminosity Objects
Abstract
Episodic accretion has been proposed as a solution to the long-standing luminosity problem in star formation; however, the process remains poorly understood. We present observations of line emission from N2H+ and CO isotopologues using the Atacama Large Millimeter/submillimeter Array (ALMA) in the envelopes of eight Very Low Luminosity Objects (VeLLOs). In five of the sources the spatial distribution of emission from N2H+ and CO isotopologues shows a clear anti-correlation. It is proposed that this is tracing the CO snow line in the envelopes: N2H+ emission is depleted toward the center of these sources in contrast to the CO isotopologue emission which exhibits a peak. The positions of the CO snow lines traced by the N2H+ emission are located at much larger radii than those calculated using the current luminosities of the central sources. This implies that these five sources have experienced a recent accretion burst because the CO snow line would have been pushed outwards during the burst due to the increased luminosity of the central star. The N2H+ and CO isotopologue emission from DCE161, one of the other three sources, is most likely tracing a transition disk at a later evolutionary stage. Excluding DCE161, five out of seven sources (i.e., 70%) show signatures of a recent accretion burst. This fraction is larger than that of the Class 0/I sources studied by Jørgensen et al. (2015) and Frimann et al. (2016) suggesting that the interval between accretion episodes in VeLLOs is shorter than that in Class 0/I sources.
Subject headings
stars: low-mass – stars: protostarsI. INTRODUCTION
The long-standing luminosity problem was first noted by Kenyon et al. (1990). The bolometric luminosity, dominated by the accretion luminosity (Hartmann & Kenyon 1996), is predicted to be a few tens of (Offner & McKee 2011; Dunham et al. 2014) assuming a typical mass accretion rate of yr-1 (Shu 1977; Terebey et al. 1984; McKee & Ostriker 2007). On the other hand, bolometric luminosities derived from surveys covering large samples of young stellar objects (YSOs) are found to be much lower than the predicted luminosity (Evans et al. 2009; Enoch et al. 2009; Kryukova et al. 2012; Dunham et al. 2013). Kenyon et al. (1990) first proposed the episodic accretion process to explain this discrepancy and this is now considered to be the most plausible explanation. This mechanism proposes that a protostellar system is in a quiescent accretion phase most of the time with occasional accretion bursts that deliver material onto the central protostar. This process predicts a low protostellar luminosity for the majority of the time whilst also enabling the central source to acquire sufficient material to form a star.
A number of theories have been proposed to explain the origin of episodic accretion (Audard et al. 2014). Of these, the favoured origin is accretion bursts driven by disk instability. Evidence for the presence of unstable disks comes from recent high-resolution near-infrared images for four sources undergoing accretion bursts (Liu et al. 2016). Disk instabilities may arise due to several mechanisms including thermal instability (Lin et al. 1985; Bell & Lin 1994; Barsony et al. 2010), gravitational instability (Vorobyov & Basu 2005; Boley & Durisen 2008), or a combination of both (Armitage et al. 2001; Zhu et al. 2009). In addition, stellar (or planetary) encounters can be a possible trigger of protostellar episodic accretion (Clarke & Syer 1996; Lodato & Clarke 2004; Forgan & Rice 2010).
| Source | Other name | RegionaaRegions are defined the same as defined by the c2d team (Evans et al. 2009). | R.A. | Dec | distance | N2D+/N2H+bbN2D+/N2H+ abundance ratios from Hsieh et al. (2015). | Opening Angle.ccThe outflow opening angles were measured through near-infrared scattered light by Hsieh et al. (2017). “N” stands for sources that were observed but not detected in this infrared study. | Ref. | |||
|---|---|---|---|---|---|---|---|---|---|---|---|
| (L⊙) | (L⊙) | (K) | (pc) | (degree) | |||||||
| DCE018 | DC 3272+18 | 15:42:16.99 | -52:48:02.2 | 0.04 | 250 | … | … | - | |||
| DCE024 | CB130-1-IRS1 | CB 130-3 | 18:16:16.39 | -02:32:37.7 | 0.07 | 270 | … | 152.5 | 1 | ||
| DCE031 | L673-7 | L673-7 | 19:21:34.82 | +11:21:23.4 | 0.04 | 300 | 0.0400.006 | N | 2 | ||
| DCE064 | Perseus | 03:28:32.57 | +31:11:05.3 | 0.03 | 250 | 0.0180.006 | 552.5 | - | |||
| DCE065 | Perseus | 03:28:39.10 | +31:06:01.8 | 0.02 | 250 | 0.0870.011 | N | 3 | |||
| DCE081 | Perseus | 03:30:32.69 | 30:26:26.5 | 0.06 | 250 | 0.0280.002 | N | - | |||
| DCE161 | Lupus IV | 16:01:15.55 | -41:52:35.4 | 0.08 | 150 | … | … | - | |||
| DCE185 | IRAS 16253-2429 | Ophiuchus | 16:28:21.60 | -24:36:23.4 | 0.09 | 125 | 0.0640.005 | 35 | 4,5,6 |
Note. — References: (1) Kim et al. 2011; (2) Dunham et al. 2010a; (3) Hung & Lai 2010; (4) Yen et al. 2015; (5) Hsieh et al. 2016; (6) Yen et al.2017
Theoretical models predict a number of characteristics of the episodic accretion process which require observational confirmation. Vorobyov & Basu (2005); Vorobyov & Basu (2010) modeled the collapse of a rotating cloud and found that dense clumps formed through disk fragmentation can fall onto the central star and trigger an accretion burst. In this scenario, the episodic accretion process is more prone to occur at the Class I stage when the disk is sufficiently massive to fragment (Vorobyov & Basu 2013; Vorobyov & Basu 2015). Besides, in a more continuous accretion process, radiative feedback can suppress fragmentation by heating the cloud core above 100 K (Offner et al. 2009; Yıldız et al. 2012; Yıldız et al. 2015; Krumholz et al. 2014). Stamatellos et al. (2012) proposed that episodic accretion can moderate the effect of radiative feedback provided that there is sufficient time for a disk to cool and fragment in the quiescent phase. Further, this allows the formation of low-mass stars, brown dwarfs, and planetary-mass objects through fragmentation of the protostellar disk. This mechanism in turn highlights that the interval between accretion episodes may be critical for determining the low-mass end of the initial mass function (Stamatellos et al. 2011; Mercer & Stamatellos 2016).
Recent observations have provided direct or indirect evidence for the occurrence of episodic accretion in low-mass protostars. Young stellar objects undergoing luminosity outbursts (e.g., Herbig 1966; Herbig 1977, FU Orionis and EX Orionis events;) are considered to be direct evidence for episodic accretion (Audard et al. 2014). Direct detection of an accretion burst is difficult due to the relatively long time interval between bursts (Scholz et al. 2013, yr;). Hence, only a few cases have been reported to date (Ábrahám et al. 2004; Andrews et al. 2004; Acosta-Pulido et al. 2007; Fedele et al. 2007; Aspin et al. 2009, V1647 Ori:, Kóspál et al. 2007, OO Serpentis:, Caratti o Garatti et al. 2011, [CTF93]216-2:, Covey et al. 2011; Kóspál et al. 2011, VSX J205126.1:, Safron et al. 2015, HOPS 383:). However, all sources except HOPS 383 (Safron et al. 2015) are at the very late Class I or later stage, near the end of the embedded phase (Covey et al. 2011; Kóspál et al. 2011). Luminosity variations in the earlier embedded phase will be probed by an ongoing sub-millimeter survey that monitors 182 Class 0/I objects over 3.5 yr (Herczeg et al. 2017).
Apart from the direct detection of luminosity variations, chemical signatures provide an excellent way to trace the episodic accretion process. This is because the chemical composition of the gas is sensitive to temperature changes (Kim et al. 2011; Kim et al. 2012; Visser & Bergin 2012; Visser et al. 2015; Taquet et al. 2016). The location of snow lines (or sublimation radii) of molecules is thus a powerful indicator of the thermal history of protostellar envelopes. Using the water snow line tracers, H13CO+ and CH3OH, Jørgensen et al. (2013) found that IRAS 15398–3359 has likely experienced a recent accretion burst because the snow line is located at a radius larger than that expected from the current luminosity. The outwards shift of the water snow line in IRAS 15398–3359 is further confirmed by HDO observations (Bjerkeli et al. 2016). Similarly, the CO snow line can be used to probe episodic accretion (Jørgensen et al. 2015; Anderl et al. 2016; Frimann et al. 2017). The radii of several CO snow lines reported by Jørgensen et al. (2015) and Frimann et al. (2017) are larger than those predicted from the current luminosities. They concluded that of their sample sources have experienced recent accretion bursts. Assuming a time scale of 10,000 yr for CO to refreeze out (Visser et al. 2015), the interval between accretion bursts was estimated to be yr. This is comparable to the value derived from the luminosity monitoring of 4000 YSOs by Scholz et al. (2013). On the other hand, the CO snow lines in four Class 0 protostars studied by Anderl et al. (2016) did not reside at larger radii than the expected values.
Very Low Luminosity Objects (VeLLOs) were first discovered by the Spitzer Space Telescope (Young et al. 2004) and are defined as YSOs with internal luminosities (Di Francesco et al. 2007). Given their low internal luminosities the discovery of VeLLOs exacerbates the luminosity problem. One explanation is that VeLLOs are in a quiescent phase of the episodic accretion process. This hypothesis is supported by several studies (Dunham et al. 2010b, L673-7:, Takahashi et al. 2013, L1521F:) that found that the averaged mass accretion rates derived from molecular outflows from these YSOs are a few times higher than that inferred from their internal luminosity. Furthermore, the low internal luminosity also suggests that VeLLOs are either young Class 0 sources (André et al. 1999; Belloche et al. 2002; Dunham et al. 2006, IRAM 04191:, Bourke et al. 2006; Takahashi et al. 2013, L1521F:, Belloche et al. 2006; Tsitali et al. 2013; Väisälä et al. 2014, Cha-MMS1:, Hsieh et al. 2015; Hsieh et al. 2017, IRAS16253:) or extremely low-mass protostars or even proto-brown dwarf candidates (Lee et al. 2009; Lee et al. 2013, L328:, Kauffmann et al. 2011, L1148:, Palau et al. 2014, IC 348-SMM2E:). In any case, VeLLOs are unlikely to have a massive disk prone to fragmentation.
| N2H+ (1–0) | 13CO (1–0) | C18O (1–0) | C17O (1–0) | Continuum | |||||||||
|---|---|---|---|---|---|---|---|---|---|---|---|---|---|
| Source | Vel. range | beam | rms | Vel. range | beam | rms | beam | rms | beam | rms | beam | rms | peak (S/N) |
| (km s-1) | (arcsec) | (km s-1) | (arcsec) | (arcsec) | (arcsec) | (arcsec) | (Jy beam-1) | (Jy beam-1) | |||||
| DCE018 | -0.52–0.25 | 2.131.42 | 9.5 | -0.45—0.05 | 2.271.84 | 2.7 | 2.291.89 | 2.6 | 2.221.89 | 5.1 | 2.081.53 | 46 | 2003 (43.1) |
| DCE024 | 7.12–8.02 | 3.141.67 | 15.3 | 7.25–7.75 | 2.081.73 | 3.6 | 2.081.77 | 3.1 | 1.991.77 | 6.1 | 2.261.64 | 50 | 1839 (36.1) |
| DCE031 | 6.54–8.08 | 2.751.67 | 19.5 | 6.90–7.50 | 1.781.58 | 3.7 | 1.831.65 | 3.5 | 1.771.65 | 7.1 | 1.881.66 | 53 | 1439 (26.7) |
| DCE064 | 6.65–7.55 | 3.172.03 | 19.0 | 7.35–7.85 | 2.941.79 | 3.9 | 2.941.80 | 4.2 | 2.921.80 | 8.2 | 2.761.82 | 60 | 324 (5.4) |
| DCE065 | 6.73–7.29 | 3.172.03 | 9.8 | 6.25–6.95 | 2.941.79 | 6.1 | 2.941.80 | 5.6 | 2.921.80 | 9.9 | 2.751.83 | 55 | 233 (4.3) |
| DCE081 | 5.91–6.41 | 3.122.03 | 14.3 | 6.30–6.90 | 2.881.79 | 4.7 | 2.881.80 | 4.9 | 2.871.80 | 8.5 | 2.711.82 | 61 | 212 (3.4) |
| DCE161 | 3.31–4.25 | 2.071.37 | 10.5 | 3.90–4.50 | 1.701.28 | 3.6 | 1.691.22 | 3.4 | 1.641.22 | 5.8 | 1.731.20 | 42 | 2760 (65.7) |
| DCE185 | 3.60–4.29 | 2.711.99 | 6.5 | 3.70–4.30 | 1.661.16 | 3.6 | 1.661.17 | 3.7 | 1.621.17 | 7.1 | 2.131.52 | 47 | 2320 (48.6) |
Note. — For N2H+ (1–0) and C17O (1–0), all the seven hyperfine components are integrated over the velocity ranges (Col. 2 and 4, respectively) in order to increase the sensitivity.
Note. — Col. (2) and Col. (5) indicate the integrated velocity ranges for the N2H+ map and the three CO isotopologue maps.
Note. — The rms noise level of the line emissions are in unit of mJy beam-1 km s-1
In this paper we present ALMA observations of emission from N2H+ and CO isotopologues towards eight VeLLOs. The aims are to search for evidence of episodic accretion using the position of the CO snow line traced by C18O/13CO and N2H+ emission. The sample of VeLLOs and observations are described in Section II. The observational results of both continuum and molecular line emission are given in Section III. The analysis of molecular abundances and modeling of the observations are detailed in Section IV. Finally, the discussion and a summary of the results are given in Sections V and VI, respectively.
II. OBSERVATIONS
II.1. Sample - VeLLOs
We selected eight VeLLOs (Table 1) out of the 15 VeLLOs identified by Dunham et al. (2008) based on data from the “Spitzer Legacy Project: From Molecular Cores to Planet Forming Disks” (Evans et al. 2003; Evans et al. 2009, c2d,). Sources in our sample are designated with the initials of the first three authors followed by the source number in Dunham et al. (2008), e.g., DCE185. The seven VeLLOs that have been excluded from the full sample can be grouped into (1) identified as a galaxy: DCE145 (Hsieh et al. 2017); (2) well studied sources: DCE001 (André et al. 1999; Belloche et al. 2002; Belloche & André 2004, IRAM 04191:), DCE038 (Crapsi et al. 2005; Bourke et al. 2005; Huard et al. 2006, L1014:), DCE025 (Lee et al. 2009; Lee et al. 2013, L328:), and DCE004 (Crapsi et al. 2004; Bourke et al. 2006; Takahashi et al. 2013, L1521F:); (3) not observable by ALMA: DCE032 (Kauffmann et al. 2011, L1148-IRS:); and (4) at the late Class I stage: DCE181 ( K). Our eight targets are thus deeply embedded objects ( K) which have not yet been studied in detail. This is especially true for the two southernmost objects, DCE161 and DCE018. The distances to the selected targets range from 125 to 300 pc which is sufficiently close to allow us to study their cloud core properties in detail.
Some properties of our selected VeLLOs have been reported in the literature. Among the eight targets, five were observed in a previous single dish survey measuring N2D+/N2H+ ratios (Hsieh et al. 2015), and six were included in a previous infrared survey for outflows (Hsieh et al. 2017). The high deuterium fractionations and small outflow opening angles (Table 1) suggest that these sources are at a very early evolutionary stage. DCE064 may be slightly more evolved than the others. Furthermore, DCE031 and DCE185 are suggested to be undergoing episodic accretion. Using CO outflow observations of DCE031, Dunham et al. (2010a) found an average much larger than the current , which indicates a luminosity variation as well as an episodic mass accretion process. Hsieh et al. (2016) suggested that DCE185 has experienced a recent accretion burst by comparing the position of the CO snow line from C18O () emission with that expected from the current luminosity.
II.2. ALMA Observations - N2H+ and 105 GHz continuum
We observed N2H+ (1–0) and dust continuum emission at 105 GHz simultaneously toward the eight VeLLOs from March to May 2016 with ALMA (Cycle 3 project 2015.1.01576.S). The ALMA configurations were C36-1, C36-2, or C36-3, and the corresponding baselines ranged from to 100 k (C36-1) and from to 209 k (C36-3). The spatial resolution, with natural weighting, is from 15 to 30 depending on the source declination and observing time (Table 2). The channel width of the N2H+ (1–0) observations was 15.259 kHz (0.049 km s-1) and was binned to 0.05 km s-1 in the output maps. We note that the spectral resolution of the data is 0.098 km s-1 because of the default ALMA Hanning smoothing. The continuum spectral window has a bandwidth of 2 GHz at a central frequency of 105 GHz. To enhance the sensitivity, we combined these data with the continuum window at 110 GHz (see section II.3).
II.3. ALMA Observations - CO isotopologues and 110 GHz continuum
We used ALMA (in the same project as described in section II.2) to simultaneously observe C18O (1–0), 13CO (1–0), C17O (1–0), and dust continuum at 110 GHz toward the eight VeLLOs from March to May 2016 with the C36-1, C36-2, or C36-3 configurations. The channel widths were 61.035 kHz ( km s-1) for 13CO (1–0) and 30.518 kHz (0.08 km s-1) for both C18O (1–0) and C17O (1–0). These data were later binned to 0.2 km s-1 and 0.1 km s-1 in the final channel maps, respectively. The continuum spectral window has a bandwidth of 2 GHz with a central frequency of 110 GHz and the data were later combined with the continuum window at 105 GHz to increase the sensitivity using the CLEAN algorithm in CASA. Table 2 lists the resulting rms noise levels of the continuum maps and the integrated line intensity maps.

III. RESULTS
III.1. Continuum emission
The continuum emission is robustly detected toward the infrared sources in DCE018, 024, 031, 161, and 185 with a signal to noise ratio (S/N) 25, and it is marginally detected in the remaining three sources with a S/N between 3 and 5 (Table 3). The continuum images, at least for the five sources with firm detections, show no signs of multiplicity at the angular resolution of the observations of several hundred au (Figures 1 and A1-A8 ). This suggests that these VeLLOs are single protostellar systems. We fit the continuum maps with a 2-dimensional Gaussian function using the CASA task imfit. Table 3 lists the deconvolved source sizes and respective position angles. Given the source distances (Evans et al. 2009, Table 1;), the physical sizes from the Gaussian fits range from 60 to 500 au. The major (long) axes are approximately perpendicular to the outflow axes in the four sources with outflow detections from the literature (Hsieh et al. 2017, DCE064:; Kim et al. 2011; Hsieh et al. 2017, DCE024:; Stanke et al. 2006; Barsony et al. 2010; van der Marel et al. 2013; Hsieh et al. 2016; Hsieh et al. 2017, DCE185:; Dunham et al. 2010a, DCE031:). For DCE161, the elongated structure (, au) has a position angle of 158 that is consistent with that (156) found for the circumstellar disk by Ansdell et al. (2016) using resolved 890 m continuum emission (J16011549-4152351 in the literature).

The 3 mm continuum emission in DCE065 peaks at south-east from the infrared source and coincides with the N2H+ peak (Figure A5). Although the S/N is low (), it is consistent with the SMA 1.3 mm continuum map at a resolution of (Hung & Lai 2010; see Figure A5 in appendix A), which reveals two distinct components. This suggests that DCE065 may host a binary system with a projected separation of 57 (1400 au).
III.2. 13CO (1–0), C18O (1–0), and C17O (1–0) maps
Figure 1 shows the integrated intensity maps of C18O (1–0) and 13CO (1–0) overlaid on the continuum images. In order to avoid contamination from the protostellar outflows, the integrated velocity ranges are set to be quite narrow (Table 2). Because C17O (1–0) emission is only marginally detected in DCE018 and DCE185 even when integrating over all three hyperfine components, we do not plot it in Figure 1. The negative contours in Figure 1 suggest that these line intensity maps suffer from spatial filtering. This is especially true for the 13CO maps (e.g. DCE064). The missing flux is likely due to emission from structures larger than about 25 (3000 – 8000 au) which is the largest angular scale that can be probed by our data.

C18O and 13CO are detected (S/N3) toward all sources except for 13CO in DCE024 and C18O in DCE081 (Table 3). The 13CO emission in DCE185 is only marginally detected (S/N 3.3) in a very small area toward the continuum source in Figure 1. For DCE024, we integrate a narrow velocity range covering the C18O line emission where 13CO shows a self-absorption dip. This feature may originate from optically thick 13CO emission. In DCE081, C18O emission is undetected (S/N2) in the integrated intensity map, but is marginally detected in the spatial intensity profiles (see section IV.1). All the detected CO isotopologue emission peaks at the continuum sources (within the beam size) which coincides with the infrared sources. Emission from 13CO in DCE018 is an exception to this. The 13CO emission in DCE018 peaks 24 away from the continuum position and is likely to be contaminated by the outflow. In DCE081, although the 13CO emission peaks at the continuum/infrared source, the extended 13CO emission is likely to be affected by the outflow cavity in a nearly north-south direction (Figure 2). More details about the outflows will be discussed in a separate paper.
We fit a 2-dimensional Gaussian to estimate the emitting area of the gas-phase CO isotopologues. Table 3 lists the deconvolved source sizes and the position angles of the long axes (east from north) of the C18O and 13CO emission. For the detected sources, the CO isotopologue emission always occupies a larger area than that of the continuum emission.
III.3. N2H+ (1–0) maps
We integrated emission from all seven hyperfine components of N2H+ over the velocity range listed in Table 2. N2H+ is detected toward all eight targets. Compared with the CO isotopologue emission, N2H+ shows more extended emission from the envelopes (Figures 2 and 3). The negative contours in the N2H+ integrated intensity maps suggest that there is significant missing flux. Taking DCE185 as an example, the ALMA-IRAM 30 m combined N2H+ integrated intensity map has a higher peak by a factor of 1.5 and about 87% of flux is missing within a radius of 15. Note that, given the complicated structure, the estimated missing flux is highly dependent on the selected area.
| 13CO (1–0) | C18O (1–0) | Continuum | |||||||
|---|---|---|---|---|---|---|---|---|---|
| size/P.A. | peak | S/N | size/P.A. | peak | S/N | size/P.A. | peak | S/N | |
| (″)/(degree) | mJy beam-1 km s-1 | (″)/(degree) | mJy beam-1 km s-1 | (″)/(degree) | Jy beam-1 | ||||
| DCE018 | 7.10.84.50.5 (121°) | 34.2 | 12.5 | 7.90.95.70.6 (106°) | 51.4 | 19.6 | 0.60.20.50.2 (176°) | 2003 | 43.1 |
| DCE024 | - | 10.4 | 2.9 | 4.90.53.60.4 (161°) | 24.8 | 8.0 | 1.40.31.30.4 (31°) | 1839 | 36.1 |
| DCE031 | 3.70.21.70.1 (67°) | 47.5 | 12.7 | 3.60.52.00.4 (72°) | 26.2 | 7.4 | 2.50.31.20.3 (165°) | 1439 | 26.7 |
| DCE064 | 4.01.43.71.6 (159°) | 80.1 | 20.6 | - | 20.0 | 4.7 | 4.52.00.80.6 (168°) | 324 | 5.4 |
| DCE065 | - | 29.6 | 4.8 | - | 28.3 | 5.1 | 9.12.27.61.9 (160°) | 233 | 4.3aaThe peak continuum intensity of DCE065 is about 4″south-east of the infrared source. |
| DCE081 | 7.71.14.60.7 (160°) | 77.8 | 16.4 | - | 14.0 | 2.9 | 12.13.23.81.2 (37°) | 212 | 3.4 |
| DCE161 | 3.80.53.40.4 (38°) | 44.9 | 12.6 | - | 13.4 | 4.0 | 0.90.10.20.2 (158°) | 2760 | 65.7 |
| DCE185 | - | 11.7 | 3.3 | 11.00.78.40.5 (113°) | 35.5 | 9.5 | 1.20.20.80.2 (127°) | 2320 | 48.6 |
Note. — The Gaussian sizes are deconvolved sizes (FWHM) toward the sources detected with a signal-to-noise ratio higher than 7. The numbers in parentheses represent the position angles of the major axis from north through east.
All the N2H+ peak positions are offset from the infrared continuum sources, except for DCE161 and DCE024. Apart from these two objects, N2H+ is likely depleted toward the center of the envelope where the CO isotopologue emission peaks. The observed anticorrelation between N2H+ and CO emission, as seen in Jørgensen (2004) and Bergin et al. (2002), suggests that N2H+ is destroyed by CO through the well-known gas-phase chemical reaction (Caselli & Ceccarelli 2012). This property makes N2H+ a robust tracer of the CO snow line. For DCE161 and DCE024, emission from both N2H+ and the CO isotopologues peaks at the same position as the infrared/continuum source. In DCE161 (J16011549-4152351) a transition disk has been identified by van der Marel et al. (2016) based on fitting of the spectral energy distribution. Subsequently, Ansdell et al. (2016) found a disk with a dust mass of 0.061 and gas mass of 6.7 using resolved ALMA 890 m observations. We speculate that emission from the CO isotopologues and N2H+ traces the high-density region in the disk of DCE161. We hereafter remove DCE161 from our study of episodic accretion because it is most likely a more evolved source with a dissipating envelope. This prevents us from measuring the radius of the CO snow line using N2H+. In the case of DCE024, there are two possibilities to explain the common peak position for N2H+ and C18O: (1) the emission from N2H+ and C18O is in fact spatially separated but projected onto the same region along the line of sight, and (2) the spatial resolution of our data is too low to resolve the anti-correlation between emission from N2H+ and the CO isotopologues.
The N2H+ integrated intensity maps reveal flattened envelopes in six out of eight targets (except for DCE018 and DCE161), four of which have major axes perpendicular to their outflow axes (Figure 2) as determined from the literature (Hsieh et al. 2017, DCE024, 064, and 185 in and Dunham et al. 2010a, DCE031 in). Although the presence of outflows are not yet reported for DCE065 and DCE081, the flattened envelopes are likely perpendicular to potential outflows. In DCE081, the 13CO emission is likely associated with an outflow (see section III.2) orientated perpendicular to the major axis of the envelope traced in N2H+ emission. In DCE065, the N2H+ emission shows two “U-shaped shells” (or “H-shaped”). This emission morphology, as seen in the sources with a detected outflow (DCE031, 064, 065, 185), likely originates from an outflow-compressed envelope (Figures 2 and 3). As a result, N2H+ emission would appear to highlight the outer shells, while that from the CO isotopologues traces the outflow entrained gas or the outflow cavity walls. Therefore, if we adopt the shells as the outflow orientations in DCE081 and DCE065, the flattened envelopes, including the four sources with detected outflows, are roughly perpendicular to the outflow axes in all six flattened envelopes as traced in emission from N2H+.
IV. ANALYSIS
Figure 4 summarizes the analysis we perform in this section using the results for DCE064 as an example. The details of each step are described in the following subsections. We first take the intensity profiles of the molecular line emission along a cut perpendicular to the outflow axis of each VeLLO. Then, abundance profiles for N2H+ and CO are calculated assuming a density profile in the envelope. Third, the radius of the CO snow line is determined by modeling the N2H+ abundance peak position. Using the radius of the CO snow line, the luminosity of the central star during the past accretion burst was derived assuming a CO sublimation temperature of 20 K. Finally, the modeled temperature profiles are coupled with a time-dependent full chemical network to model the evolution of the abundance of CO and N2H+ through the envelope of each source in time.
IV.1. Comparison of intensity profiles
To compare the spatial distribution of emission from N2H+ and CO, we plot the intensity profiles of N2H+ and the CO isotopologues (Figure 5). These profiles are obtained using the integrated intensity maps shown in Figures 1 to 3 along the cuts shown in Figures A1 to A8. The cuts cross the source centers and have a width of 4″, about times the beam size, which should only marginally affect the profiles. The position angles of the cuts are selected based on the following criteria. For the four sources with outflow detections in the literature, the cuts are taken perpendicular to the outflow axes (DCE024, 064, and 185 from Hsieh et al. 2017; and DCE031 from Dunham et al. 2010a). For the two sources with potential outflows (DCE065 and DCE081), we take the cuts perpendicular to the assumed outflow axes that are inferred from our N2H+ and CO maps (see section III.3; Figure 2). DCE018 and DCE161 show no clear indication of the existence of protostellar outflows nor their orientations in the plane of the sky. In DCE018, both 13CO and C18O maps show elongated structures with the long axis roughly aligned from the north-west to the south-east (Table 3). The N2H+ map shows an arc-like structure directed toward the south-west which surrounds the continuum emission (Figure A1). We choose the cut across the two arms of the N2H+ arc-like structure from the north-west to the south-east in order to feature the two N2H+ peaks in the intensity profile (Figure 5). In DCE161, we choose a cut along the major axis of the continuum emission (Gaussian fit in Table 3). The position angle of the cut is consistent with the long axis of the protostellar disk found by Ansdell et al. (2016) from resolved continuum observations at 890 m.
Figure 5 shows the spatial intensity profiles of N2H+ (1–0), 13CO (1–0), and C18O (1–0) obtained along the cuts described above. Based on these profiles, we categorize the targets into three types (excluding DCE161, see section III.3):
- (a)
Detection of N2H+ depletion toward the center where CO evaporates: DCE018, 031, 064, 081 and 185 enter into this category. N2H+ is destroyed by gaseous CO and therefore highlights the CO snow line.
- (b)
Detection of N2H+ depletion toward the center with very weak CO emission: in DCE065, N2H+ depletion is clearly seen, but the C18O (1–0) and 13CO (1–0) lines are very weak toward the center as observed with ALMA, and both C18O (2–1) and 13CO (2–1) lines are undetected with SMA (Hung & Lai 2010). A possible explanation is that DCE065 has experienced a burst but the inherently low abundance CO gas is consumed by reaction with N2H+. An alternative possibility is the freeze-out of N2, the parent molecule of N2H+, in the high density central region as interpreted in IRAM 04191 by Belloche & André (2004). Furthermore, the SMA observations of Hung & Lai (2010) reveal N2D+ depletion toward the center with a radius similar to that of N2H+ (Figures 5). This result is different from the case of L1157, in which Tobin et al. (2013) find a depletion radius of N2D+ larger than that of N2H+. This difference in radius is explained by invoking the fact that, after an accretion burst, N2D+ takes a longer time to recover than N2H+ due to the lack of abundant H2D+ when T 20 K (Caselli & Ceccarelli 2012). As a result, either DCE065 has experienced a very recent burst, and thus the radius difference has not yet become significant, or both N2H+ and N2D+ are depleted due to the freeze-out of N2 in the high density central region.
- (c)
Extended N2H+ and C18O emission with a similar peak position: in DCE024, the N2H+ and C18O emission have a common peak position toward the infrared sources. One possibility is that the overlap in peak position between N2H+ and C18O is due to a projection effect. Alternatively, an anti-correlation between C18O and N2H+ may exist on spatial scales smaller than those probed by our observations.

IV.2. Molecular Column Densities
We derive the CO and N2H+ column density maps toward all eight VeLLOs. Figure 6 shows the column density maps derived for DCE064 and DCE185 as examples. The N2H+ column density maps of the eight VeLLOs are further shown in Figures A1 to A8. The details of the calculations are described below for CO (section IV.2.1) and N2H+ (section IV.2.2).
IV.2.1 Column Density of CO - Assumption of optically thin CO isotopologues emission
We estimate the column density of CO under the assumptions of optically thin emission of C18O and local thermodynamic equilibrium (LTE) with an excitation temperature of 10 K in our eight targets. Here we discuss the validity of the assumption of optically thin emission based on the intensity ratios between the three CO isotopologues, 13CO, C18O, and C17O. Taking the isotopic ratio, 13CO/C18O , in the local ISM (Wilson & Rood 1994), the C18O emission can be considered as optically thin () if the intensity ratio of 13CO to C18O is larger than 1.6 (Shimajiri et al. 2014, see, e.g., eq. 7 in). Thus, the intensity profiles in Figure 5 imply that the C18O emission in DCE031, 064, 081, and 161 is most likely optically thin. Similarly, given the isotopic ratio of C18O/C17O 3.2, the intensity ratio of C18O to C17O is larger than 2.4 when the C18O emission is optically thin. Therefore, the C18O emission from DCE024 is likely to be optically thin given the non-detection of C17O. The C18O emission from DCE065 is assumed to be optically thin, because both 13CO and C18O lines are only marginally detected. For the two sources in which C17O is detected, DCE018 and 185, we assume that the emission from both C17O and C18O is optically thin. We find that the resulting column density ratios of C17O to C18O are broadly consistent with the local ISM abundance ratio (see Figure 7).
It is noteworthy that three sources (DCE018, 024, and 185) have C18O intensities larger than that of 13CO. This mostly comes from the optically thick emission and self-absorption of 13CO which suffers from substantial spatial filtering in the interferometric observations.
IV.2.2 Column Density of N2H+
We calculate the N2H+ column density map toward each source using the isolated component (: 101–012) under the assumption of optically thin emission. We adopt this assumption because some uncertainties prevent us from estimating the optical depth accurately from the hyperfine structure. First, although our data reveal clear N2H+ detections based on the integrated intensity (Figure 2), the signal-to-noise ratios are sometimes insufficient to fit the hyperfine spectra (Figures A1-A8). Second, our data sets have missing flux problems as shown by the negative contours in Figure 2. Spatial filtering not only results in underestimating the overall intensity but also affects the relative intensities of the hyperfine components. Therefore, the optical depth () derived from these ratios is also affected, because components with different opacities may probe different structures. Third, hyperfine anomalies due to non-thermal effects (Daniel et al. 2006; Daniel et al. 2007; Keto & Rybicki 2010; Loughnane et al. 2012) could also change the ratios between the hyperfine components. Although the optical depth cannot be determined precisely across the whole map, we find that the optically thin assumption is reasonable for the isolated 101–012 component in our targets (see appendix A). We therefore use this component and assumption to derive the column density maps for N2H+.
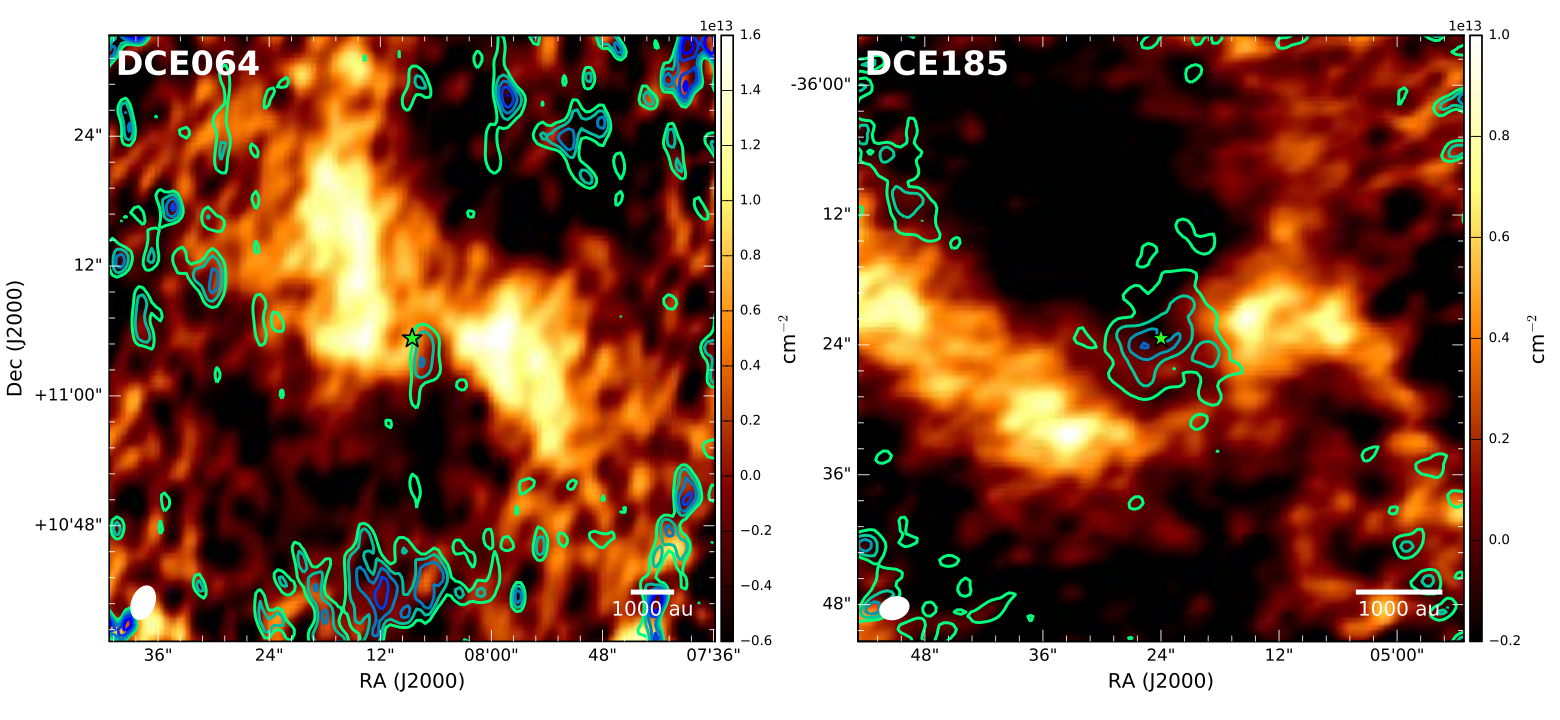
We calculate the N2H+ column density using the isolated 101–012 component (except for DCE161, see the following) under the assumptions of optically thin emission and LTE with an excitation temperature of 10 K (see, e.g., Eq. 79 in Mangum & Shirley 2015). The assumed excitation temperature is comparable to the estimated gas temperature from the non-LTE analysis with RADEX (van der Tak et al. 2007) of the N2H+ (3–2)/(1–0) ratio spectra in our single-dish survey of VeLLOs (Hsieh et al. 2015) which includes five of our targets. The column density will change by factors of 0.3 and 1.7 if we assume excitation temperatures of 5 and 15 K, respectively. Figures A1 to A8 show the resulting column density maps. Two caveats should be kept in mind. Firstly, spatial filtering is significant as indicated by the negative contours in Figure 2. Given the largest angular scales (25″, 3000–8000 au) of the data, the missing flux is mostly related to the cloud core and cloud structures (20,000 au), which may not significantly affect our analysis at the scale of the envelope (1000–10,000 au). Secondly, due to the hyperfine anomalies described above, the isolated 101–012 component is usually considerably brighter than that expected from the statistical weight (Figures A1 to A8). However, in our study of the N2H+ distribution, the absolute column density will not significantly affect our conclusions.
For DCE161, the N2H+ emission is too weak if we only integrate the isolated 101–012 component (3/27 of the strength of the whole multiplet). We thus calculate the column density using the integrated intensity over all hyperfine components. We suggest that the assumption of optically thin emission for all seven hyperfine components is reasonable because the weak emission (2 K toward the strongest component, Figure A7) is unlikely to trace a region with a high column density.
IV.3. Abundance Profiles of N2H+ and CO
In order to calculate the N2H+ abundances relative to H2, we construct a model core with a spherical symmetry and a broken power-law density profile. The power-law index, , was assumed to be for the inner free-fall region and for the outer static region (Young & Evans 2005). The transition radius from static to free-fall is adopted to be 3000 au based on the dynamical model of the well-studied VeLLO, IRAM 04191 (Belloche et al. 2002). We assume three core masses of 0.5, 1.0, and 3.0 within a radius of 10,000 au which are comparable to that (0.3–1.0 M⊙) from the single-dish observations toward the four VeLLOs in Perseus and Ophiuchus (Enoch et al. 2008). We integrate the density of the material along the line of sight to obtain the H2 column density. To derive the N2H+ and CO abundances, we divide the corresponding molecular column density (section IV.2) by the H2 column density. We then calculate the abundance profiles as a function of radius (Figure 7) by averaging over that of the two sides of the protostar along the selected axis.
| (au) | (au) | (au) | (au) | () | (au) | yr-1 | |||
|---|---|---|---|---|---|---|---|---|---|
| DCE018 | 0.060.01 | 0.04 | 114-164 | 102-145 | 275-311 | 775.0-1149.0 | 1.0-4.0 | 633-836 | (0.60.4) |
| DCE024 | 0.200.04 | 0.07 | 186-277 | 122-175 | 422-486 | - | - | - | - |
| DCE031 | 0.090.03 | 0.04 | 134-194 | 102-145 | 362-410 | 1919.0-2100.0 | 5.1-13.4 | 1527-1593 | (2.31.0) |
| DCE064 | 0.200.05 | 0.03 | 186-277 | 94-132 | 428-493 | 1649.0-3075.0 | 3.9-29.1 | 1316-2404 | (4.13.2) |
| DCE065 | 0.220.06 | 0.02 | 195-290 | 87-117 | 437-505 | 1850.0-2049.0aaThe N2H+ depletion in DCE065 could alternatively come from the freezeout of the parent molecule, N2. In such a case, DCE065 did not experience a recent accretion burst. | 4.7-12.7 | 1459-1547 | (2.21.0) |
| DCE081 | 0.180.04 | 0.06 | 177-264 | 115-165 | 417-480 | 1249.0-1900.0 | 2.2-10.9 | 961-1426 | (1.61.1) |
| DCE161 | 0.11 | 0.08 | 145-212 | 128-185 | 251-290 | - | - | - | - |
| DCE185 | 0.450.08 | 0.09 | 272-418 | 134-195 | 356-457 | 1362.0-1900.0 | 2.7-10.9 | 1073-1426 | (1.71.0) |
Note. — Col. (1)-(3): Source properties from Dunham et al. (2008). Col. (4): CO sublimation radius (20K) corresponding to the current luminosity in Col. (2). The uncertainty is given by different assumption of envelope mass from 0.5-3.0 . Col. (5): CO sublimation radius (20K) corresponding to the internal luminosity in Col. (3). Col. (6): CO sublimation radius (Col. 4) convolved with the observational beam size. Col. (7): Measured radius of N2H+ abundance peak, see section IV.3. Col. (8): Source luminosity at the burst phase from models, see section IV.5. Col. (9): CO sublimation radius (20K) corresponding to the outburst luminosity () in Col. (8). Col. (10): Mass accretion rates estimated based on the outburst luminosity () in Col. (8).
We obtain the peak radii of the N2H+ abundance (, Table 4) which are used for the modeling in section IV.5. The derived peak radii may be affected by the assumed H2 density profile because the abundance profile depends on the H2 column density. In order to test this, we compare the derived with that calculated by assuming pure power-law density profiles with indices of and . The abundance profiles for the model with are almost the same as those for the broken power-law, whereas those with have steeper slopes toward the centers (Figures A9). For the model with , is larger by 3–13% than that with . This difference is taken as the uncertainty in this measurement (appendix B). In the case of DCE024, the N2H+ abundance profile drops toward the source center, especially for the model with . However, the decrease (by a factor of ) is likely to be produced by the assumed density profile rather than destruction by CO because of the centrally-peaked N2H+ intensity profile (Figure 5). Therefore, we measure only for the sources with N2H+ depletion in the intensity profiles (i.e., categories (a) and (b) in section IV.1).
IV.4. Models of temperature profiles
Given the bolometric luminosities (Table 1), we use the one-dimensional radiative transfer code DUSTY (Ivezić et al. 1999) to model the temperature profiles of our VeLLOs. We use the modeled cloud density distribution described in section IV.3 which is scaled to the envelope masses of 0.5, 1.0, and 3.0 within 10,000 au. Assuming a gas-to-dust mass ratio of 100 and a dust opacity of 1063.8 cm2 g-1 at 8 m (Ossenkopf & Henning 1994), we calculate the dust temperature profile with the radiative transfer modeling. As a result, we find that the CO snow line, assumed to be at a temperature of 20 K, is located at a very small radius of au when considering only the bolometric luminosity at the present time (Table 4). These values imply that the faint central source of a VeLLO can evaporate CO and in turn destroy N2H+ in a region that is not resolved by our observations. Table 4 lists the CO sublimation radii predicted by the radiative transfer model in two cases: one in which the luminosity assumed to be equal to the internal luminosity and another in which it is assumed to be equal to the bolometric luminosity. Furthermore, for a better comparison to the observations, the model temperature profiles are convolved with a Gaussian with the same size as the observed beam ( in Table 4).
IV.5. Chemical modeling
We model the observed N2H+ abundance profiles at the post-burst phase for the six sources with N2H+ depletion and at the quiescent phase for all eight sources. We adjust the luminosity used as an input for the DUSTY simulation so that the temperature profile leads to a N2H+ peak located at a radius as determined from the observations (section IV.3). The best-fit outburst luminosity () and its corresponding CO sublimation radius ( at 20 K) are listed in Table 4. A lower limit of 10 K is set for the temperature profiles to mimic the external heating from the interstellar radiation field for all models except for DCE024. To better reproduce the extended N2H+ emission toward DCE024, we take 15 K as a lower limit. This temperature is slightly lower than the N2 sublimation temperature of 18 K at a density of 105 cm-3 given a binding energy of 955 K (see below).
The N2H+ abundance profiles are modeled using a full time-dependent deuterated chemical network. The network is based on the UMIST database for Astrochemistry RATE06 version (Woodall et al. 2007) extended with deuterium fractionation reactions (McElroy et al. 2013). The network includes gas phase chemistry, gas-grain reactions (freeze-out, thermal desorption, and cosmic-ray-induced photodesorption), and grain-surface reaction (Hasegawa et al. 1992). The rate coefficient for freeze-out (gas to ice) is obtained by
| (1) |
while the rate coefficient for thermal desorption (ice to gas) is given by
| (2) |
where is the dust grain cross section with an assumed grain size of 0.1 m, is the thermal velocity of species , is the dust number density, is the molecular binding energy, and is the characteristic vibration frequency of the absorbed species. The characteristic vibration frequency is given by:
| (3) |
where cm-2 is the number density of surface sites on the dust grains and is the mass of the species . Table 5 lists the relevant reactions used in the network, along with the parameters needed to calculate the rate coefficient for two-body reactions and cosmic ray ionization. For a two-body reaction, the rate coefficient is given by
| (4) |
with the temperature denoted by . For cosmic ray ionization, the rate coefficient is described by
| (5) |
Table 5 lists the parameters , , and needed to calculate the rate coefficient of each reaction.
The chemical network is coupled with a source density and temperature profile as a function of radius. The abundances of CO and N2 relative to H2, and , are fixed at a constant value of 4 10-4 and 1 10-4, respectively. The binding energy of CO is assumed to be 1150 K (corresponding to a sublimation temperature of 20 K), and the N2 binding energy is taken as 0.83 times that of CO (955 K) (Anderl et al. 2016). This binding energy is similar to that derived experimentally (Bisschop et al. 2006; Fayolle et al. 2016). This model set up calculates the sublimation radius of CO and N2 for a given temperature profile. The aim is to reproduce the N2H+ ring with the inner radius set by the destruction of N2H+ by gaseous CO and the outer radius determined by the freeze-out of N2.
To reproduce the chemical evolution of episodic accretion, the quiescent, burst and post-burst phases are modeled for each object. The results of this time-dependent chemical model are shown in Figure 8. For the quiescent phase, the source density and temperature profile with the current measured luminosity are used. CO and N2 are initially set to be completely frozen onto the dust grains ( = 4 10-4, = 1 10-4), and the model is evolved for 106 yr. This phase is followed by the accretion burst, where the source profile is switched to that with an increased luminosity (i.e. in Table 4). The model is then evolved for 100 and 200 yr (Vorobyov & Basu 2005), which is the expected duration of an accretion burst. However, the duration of the burst does not appear to have a significant effect on the distribution or abundance of N2H+. Finally, the source profile is again switched back to the luminosity of the quiescent phase in order to model the evolution of the gas post accretion burst. The post-burst model is evolved up to 105 yr, and the results at 1000 yr, 10,000 yr, and 50,000 yr after the burst are compared in order to see how the peak abundance positions of CO and N2H+ shift with time. Shortly after the accretion burst has ended, CO starts to drop at a radius of about 400 au, causing N2H+ to generate a second inner peak at the radius of the CO drop. With time, the second inner peak of N2H+ becomes more prominent, while the gas in the outer peak starts to freeze-out onto the dust grains again. Thus, starting from the inner high-density region, N2H+ progressively resumes its initial position during the quiescent, pre-burst phase.
To compare the chemical models with the observations, we smooth the modeled abundance profiles in Figure 8 to the observed angular resolution. We convolve the profiles with a Gaussian of FWHM equal to the FWHM of the beam (Table 2). The convolved abundance profiles are shown in Figure 9. These profiles indicate that the inner N2H+ peak after the burst cannot be resolved in our current data.
The observed N2H+ abundance profile is well described by the models during the quiescent or post-burst phases for almost all VeLLOs (Figure 9). This indeed confirms that five VeLLOs have undergone episodic accretion, because the N2H+ peak could not have moved outward to radii of 1000 au with the current luminosity. This is only possible through the cloud core being heated up considerably. In addition, the time-dependent model suggests that the radius of the N2H+ abundance peak does not significantly change in 10,000 yr. This result suggests that the position of the N2H+ peak can reflect the highest luminosity that the central source reached in the past accretion burst.
V. DISCUSSION
V.1. Occurrences of burst or not?
Figure 10 shows the radius of the CO snow line measured using N2H+ as a function of bolometric luminosity, i.e. in Table 4. By comparing the location of the CO snow line predicted for the current luminosity to the measured value, we find at least five of our targets likely experienced a recent accretion burst. Excluding DCE161 (see section III.3), we now discuss whether or not a previous burst has occurred toward the seven VeLLOs (see also Figure 7):
- 1.
Five of the targets (DCE018, 031, 064, 081, 185) have CO snow lines located at larger radii than the predicted values from the model using the current luminosity suggesting that they have experienced an accretion burst.
- 2.
DCE024 shows no N2H+ depletion in the intensity/abundance profile with very weak C18O and 13CO emission peaks at the center. Given the roughly constant N2H+ abundance profile, DCE024 is most likely at a quiescent accretion phase without a recent burst.
- 3.
The depletion of N2H+ in DCE065 could originate from a previous accretion burst or the depletion of the parent molecules N2 by freeze-out onto dust grains (see section IV.1).
As a result, out of the seven VeLLOs, five show evidence for the occurrence of a past burst, one has no recent accretion burst, and one is ambiguous. Statistically, five to six VeLLOs with a past burst out of seven VeLLOs would result in a probability of 71% to 86% with an uncertainty of 17% to 13% assuming binomial statistics.
| ID | Reaction | ||||
|---|---|---|---|---|---|
| (s-1) | (cm3 s-1) | (K) | |||
| 1 | H + H2 H + H | … | 2.08 | 0.00 | 0.0 |
| 2 | H + HD H2D+ + H2 | … | 3.50 | 0.00 | 0.0 |
| 3 | H + e- H + H | … | 1.60 | -0.43 | 0.0 |
| 4 | H + e- H2 + H | … | 6.70 | -0.52 | 0.0 |
| 5 | H2D+ + e- H2 + D | … | 6.79 | -0.52 | 0.0 |
| 6 | HCO+ + e- CO + H | … | 2.80 | -0.69 | 0.0 |
| 7 | DCO+ + e- CO + D | … | 2.40 | -0.69 | 0.0 |
| 8 | N2H+ + e- N2 + H | … | 2.60 | -0.84 | 0.0 |
| 9 | N2D+ + e- N2 + D | … | 2.60 | -0.84 | 0.0 |
| 10 | H + CO HCO+ + H2 | … | 1.61 | 0.00 | 0.0 |
| 11 | H2D+ + CO DCO+ + H2 | … | 5.37 | 0.00 | 0.0 |
| 12 | H2D+ + CO HCO+ + HD | … | 1.07 | 0.00 | 0.0 |
| 13 | N2H+ + CO HCO+ + N2 | … | 8.80 | 0.00 | 0.0 |
| 14 | N2D+ + CO DCO+ + N2 | … | 8.80 | 0.00 | 0.0 |
| 15 | H + N2 N2H+ + H2 | … | 1.80 | 0.00 | 0.0 |
| 16 | H2D+ + N2 N2D+ + H2 | … | 6.00 | 0.00 | 0.0 |
| 17 | H2D+ + N2 N2H+ + HD | … | 1.20 | 0.00 | 0.0 |
| 18 | HCO+ + D DCO+ + H | … | 1.00 | 0.00 | 0.0 |
| 19 | DCO+ + H HCO+ + D | … | 2.20 | 0.00 | 796.0 |
| 20 | H + D H2D+ + H | … | 1.00 | 0.00 | 0.0 |
| 21 | H2D+ + H H + D | … | 2.00 | 0.00 | 632.0 |
| 22 | N2H+ + D N2D+ + H | … | 1.00 | 0.00 | 0.0 |
| 23 | N2D+ + H N2H+ + D | … | 2.20 | 0.00 | 550.0 |
| 24 | H2 + cr H + e- | 1.21E-17 | … | … | … |
| 25 | H2D+ + H2 H + HD | … | 1.40 | 0.00 | 232.0 |
| 26 | H2D+ + H2 H + HD | … | 7.00 | 0.00 | 61.5 |
It is noteworthy that in a low-density region molecules may not have had enough time to freeze out onto dust grains since the assembly of the molecular cloud. Thus, the radius of the CO snow line may highlight not only the area heated by a luminosity burst but also a region where CO has not yet frozen out (Jørgensen et al. 2005). The slow freeze-out process of CO can be seen in the chemical model at a large radius of 2000-3000 au (Figure 8). However, at a radius of 1000-2000 au, CO can freeze out within 10,000 yr (Figure 8) which is much shorter than the lifetime of a starless core of yr (Enoch et al. 2008). Therefore, CO within the mentioned radius is most likely evaporated by a past luminosity outburst.
Figure 10 also shows the data points from Jørgensen et al. (2015) and Frimann et al. (2017) which plot the half width at half maximum (HWHM) of the C18O (2–1) emission as a function of the bolometric luminosity. For comparison, we plot in orange the HWHM of the CO isotopologue emission from our targets (Table 3). This comparison indicates that the radii of the CO snow lines are larger than the HWHM of the CO isotopologue emission by a factor ranging from , while the model in Anderl et al. (2016) found a factor of 1.6. The scatter in the observed HWHM likely originates from the spatial resolution of observations (Table 2). In addition, the outflow contamination can not be completely removed from the CO isotopologue observations.
V.2. Mass accretion rate during burst
The estimated (Table 4) provides us with an opportunity to estimate the mass accretion rate during the accretion burst. Assuming , we estimate the mass accretion rate () during the burst phase using where G is the gravitational constant, is the protostellar radius (assumed to be 3 ; Dunham et al. 2010a) and is the mass of the central source (assumed to be 40 ; Huard et al. 2006). As a result, we find mass accretion rates during the burst phase of yr-1 with a median of yr-1. We note that this estimate could be considered to be a lower limit because (1) a fraction of N2H+ may have recovered since the past burst such that the measured N2H+ depletion radius is smaller than that during the accretion burst, and (2) the protostellar disk or torus-like structure, if present, can shield the outer envelope from heating by the central protostars (Murillo et al. 2015; Rab et al. 2017). This latter point is important to consider given that the abundance profiles are derived from the cuts perpendicular to the outflows.
Given the derived mass accretion rate, we can further estimate how much time a protostar spends in the burst phase. Assuming that most of the material is accreted during the burst at an accretion rate of yr-1, the total time of the burst phase is estimated to be 25,000 yr which is the time necessary to acquire the typical stellar mass of 0.5 . Taking the lifetime of the embedded phase (Class 0/I) to be Myr (Evans et al. 2009; Dunham et al. 2014; Carney et al. 2016), we find that a protostar spends % of the time in the burst phase, which is on the same order as the simulation results of % from Dunham & Vorobyov (2012) and is also consistent with the observational statistical results of 5% with yr-1 from Enoch et al. (2009).
V.3. Timeline of the episodic accretion process
One of the most important parameters in the episodic accretion process is the time interval between two accretion bursts because this timescale moderates the effect of radiative feedback on disk fragmentation (Mercer & Stamatellos 2016). Disk fragments may later be ejected forming a proto-brown dwarf (Reipurth & Clarke 2001; Bate et al. 2002; Rice et al. 2003; Stamatellos & Whitworth 2009; Basu & Vorobyov 2012), or fall onto the central star causing an accretion burst (Vorobyov & Basu 2005; Vorobyov & Basu 2010; Dunham & Vorobyov 2012), or migrate to a stable orbit resulting in a multiple system. Multiplicity is discussed further in section V.4. Out of our seven VeLLOs, we found that at least five show evidence for the occurrence of a past burst. This fraction is similar to or slightly higher than the value of % found by Jørgensen et al. (2015) and Frimann et al. (2017) in Class 0/I sources based on SMA C18O observations. Taking the time scale of 10,000 yr for CO to refreeze out (Visser & Bergin 2012; Visser et al. 2015), we suggest to of these VeLLOs have experienced a past accretion burst within 10,000 yr. If we assume that all protostars are undergoing episodic accretion, this result suggests a timescale of intervals between bursts of yr in VeLLOs, in comparison to yr from Jørgensen et al. (2015) and Frimann et al. (2016). However, if an accretion burst lasts for 100 to 200 yr (Vorobyov & Basu 2005) and in turn accretes material with a mass of (section V.2), it would take bursts, i.e. yr in total to build a star with a mass of 0.5 . This is too long compared with the lifetime of the Class 0/I stage, Myr (Evans et al. 2009; Dunham et al. 2014; Carney et al. 2016). Thus, either a significant fraction of mass (70%) accretes during the quiescent phase, or stronger outbursts occur at a later evolutionary stage assuming VeLLOs are early Class 0 sources (Hsieh et al. 2015; Hsieh et al. 2017). Alternatively, these VeLLOs will form very low-mass stars with a mass . Another possible explanation is that the interval between bursts is in fact shorter than the time scale for CO to freeze out (10,000 yr). For such a case, this means that six out of seven sources are undergoing episodic accretion whereas the remaining source, DCE024, has not yet started this process.
In addition to the time interval between bursts, the detection of accretion bursts in VeLLOs suggests that the episodic accretion process may start from a very early stage since VeLLOs could be extremely young protostars (Dunham et al. 2014; Hsieh et al. 2015; Hsieh et al. 2017). The onset time of episodic accretion is important because it is associated with the origin of accretion bursts. Vorobyov & Basu (2005); Vorobyov & Basu (2010) suggested that dense protostellar clumps fall onto the central protostar, causing an accretion burst. Further, Vorobyov & Basu (2010); Vorobyov & Basu (2013) found that this dense clump may form through disk fragmentation under the conditions of a low Toomre Q-parameter (Toomre 1964) and a short local cooling time. However, this process requires a fairly massive disk around the central star (Vorobyov & Basu 2013; Kratter & Lodato 2016). The presence (or otherwise) of disks in VeLLOs remains unclear because they are considered to be either very early-stage protostars or extremely low-mass protostars (Dunham et al. 2014). Though the presence of a protostellar outflow strongly suggests the existence of a disk, the resolution of our data ( au) is insufficient to resolve it for most of the targets. Although protostellar disks have been detected in some Class 0 sources (Lee 2011; Tobin et al. 2012b; Murillo & Lai 2013; Murillo et al. 2013; Ohashi et al. 2014), the disks in VeLLOs are likely still forming if they are indeed extremely young Class 0 sources. For example, Yen et al. (2015); Yen et al. (2017) suggest that the disk size is very small (6 au) in one of our targets, DCE185 (IRAS 16253) while it shows a clear evidence of a recent accretion burst. As a result, the high fraction of burst signatures in VeLLOs is in conflict with the simulation results (Vorobyov & Basu 2013; Vorobyov & Basu 2015) in which episodic accretion processes are found to occur preferentially during the Class I stage after the formation of a star-disk system. To address this issue, we propose two possible scenarios: (1) the accretion burst may not necessarily be triggered by an infalling fragment but by a different mechanism regulating the accretion process, or (2) the fragment may not necessarily be formed in a disk (disk fragmentation) but in a large-scale envelope or pseudo-disk like structure. It should also be noted that the disk can be consumed by past accretion bursts (Jørgensen et al. 2015). However, in such a case, these VeLLOs would have once contained a massive disk before the burst.
V.4. Multiplicity
Multiplicity is common in embedded protostellar systems, and fragmentation of the cloud core or disk is widely agreed to be the mechanism of formation. Numerical calculations have shown that the thermal feedback from newly formed protostars can suppress fragmentation in cloud cores (Krumholz et al. 2014), while episodic accretion can moderate the effect of thermal feedback. During the interval of an accretion burst, the cloud core can cool down and fragmentation can occur in the disk (Stamatellos et al. 2012) or in the rest of the cloud core where the temperatures fall well below 100 K. On the other hand, the mass of the core may be an important factor in fragmentation as well (Offner et al. 2016). VeLLOs which are undergoing episodic accretion would be expected to be multiple protostellar systems. However, none of the VeLLOs studied so far have shown convincing evidence of multiplicity, with probable companions only detected in the submillimeter but not in the infrared (Takahashi et al. 2013; Chen et al. 2012) or through outflow kinematics (Hsieh et al. 2016). At separations larger than 250 au, the sources in our sample do not show a secondary companion nor signs of multiplicity. DCE065 may be the exception, with the SMA continuum observations hinting at a possible binary system; however, Tobin et al. (2016) did not find indications of companion sources in DCE065. Further studies would be needed to determine whether DCE065 is a true proto-binary. The angular resolution of our observations, , is not enough to probe the existence of a companion at separations smaller than 250 au. A recent unbiased survey at millimeter wavelengths of all protostars in the Perseus molecular cloud probed down to 15 au separations (Tobin et al. 2016). The Perseus VeLLOs included in our sample (DCE064, 065 and 081) have been found to be single protostars. The measured of an unresolved binary is higher than that of a single protostar, even if the protostars are at similar evolutionary stages (Murillo et al. 2016). If we compare the from the VeLLOs in Perseus to the rest of our sample, the luminosities are similar. Thus, either the rest of the sample is also composed of single protostars or they are binaries with even dimmer components.
Episodic accretion cannot be a hindering factor in fragmentation, since several embedded multiple protostellar systems in Perseus have evidence of accretion bursts (Frimann et al. 2017). The low frequency of multiplicity in our sample of VeLLOs could be explained by a few possible scenarios. One possibility is that the time between accretion bursts is too short to allow the gas to cool down enough for fragmentation to take place. Even if there were areas of cold gas, there may not be areas of high enough density that can trigger instabilities and fragment. Another possibility is that, while temperature may play an important role in the star formation process, it may not be the deciding factor in the formation of multiple protostellar systems through fragmentation.
VI. SUMMARY
We present an ALMA survey of N2H+ (1–0), 13CO (1–0), C18O (1–0), C17O (1–0) line emission and dust continuum emission in eight VeLLOs. We use the molecular pair, N2H+ and CO isotopologues, to probe the positions of the CO snow lines in the natal envelopes. We use the measured position of the CO snow line, together with that predicted from the current luminosity, to identify VeLLOs that have experienced a recent accretion burst. We summarize our results as follows.
- 1.
We found five to six VeLLOs out of seven that have experienced recent accretion bursts. This fraction is larger than that found for Class 0/I objects (Jørgensen et al. 2015; Frimann et al. 2017, %,), and it implies a time interval between accretion burst of yr, assuming a CO refreeze-out time of 10,000 yr.
- 2.
Our chemical model reproduces well the observed N2H+ depletion toward the source center due to a past accretion burst. In addition, we find that the radius of the CO snow line remains relatively static after the burst, suggesting that it can be used as an indicator of the burst luminosity.
- 3.
From the observed positions of the CO snow lines, we estimate mass accretion rates of yr-1 with a median of yr-1 during the burst. Given the lifetime of the protostellar embedded phase, we suggest that a protostar spends % of the time in the burst phase to form a typical mass (0.5 ) star.
- 4.
The evidence of accretion bursts in VeLLOs is in conflict with simulations (Vorobyov & Basu 2015) which suggest that episodic accretion should preferentially occur during the Class I stage after accreting sufficient material onto a protostellar disk. We propose two possibilities to solve this issue: (1) the accretion burst may not necessarily be triggered by an infalling fragment but by a different mechanism regulating the accretion process, or (2) the fragment may not necessarily be the product of disk fragmentation, but form in a large-scale envelope or pseudo-disk structure.
- 5.
In our sample of VeLLOs, we find no evidence for multiplicity down to spatial scales of 250 au, implying a low frequency of multiplicity. We suggest that (1) the short time interval between bursts prevents the gas from cooling down and fragmenting to form a binary system, and/or (2) given the cold envelopes around VeLLOs, the absence of multiplicity suggests that temperature may not be the deciding factor for fragmentation.
The authors thank Prof. Jes. K. Jørgensen and Prof. Yuri Aikawa for providing valuable discussions. We thank Dr. Chao-Ling Hung for sharing the SMA data in Figure 5, 7, and A5. We express our gratitude to the anonymous referee for the constructive comments that improved the clarity of this paper. We are thankful for the help from ALMA Regional Center in Taiwan. This paper makes use of the following ALMA data: ADS/JAO.ALMA#2015.1.01576.S. ALMA is a partnership of ESO (representing its member states), NSF (USA) and NINS (Japan), together with NRC (Canada), NSC and ASIAA (Taiwan), and KASI (Republic of Korea), in cooperation with the Republic of Chile. The Joint ALMA Observatory is operated by ESO, AUI/NRAO and NAOJ. The 2015.1.01576.S data was obtained by T.H.H. while he was a PhD student at National Tsing Hua University, Taiwan, under the supervision of S.P.L. T.H.H. and S.P.L. are thankful for the support of the Ministry of Science and Technology (MoST) of Taiwan through Grants 102-2119-M-007-004-MY3, 105-2119-M-007-024, and 106-2119-M-007-021-MY3. N.H. and T.H.H. acknowledge a grant from MoST 106-2112-M-001-010 in support of this work. C.W. acknowledges financial support from the University of Leeds.
References
- Ábrahám et al. (2004) Ábrahám, P., Kóspál, Á., Csizmadia, S., et al. 2004, A&A, 419, L39
- Acosta-Pulido et al. (2007) Acosta-Pulido, J. A., Kun, M., Ábrahám, P., et al. 2007, AJ, 133, 2020
- Anderl et al. (2016) Anderl, S., Maret, S., Cabrit, S., et al. 2016, A&A, 591, A3
- Andrews et al. (2004) Andrews, S. M., Rothberg, B., & Simon, T. 2004, ApJ, 610, L45
- Ansdell et al. (2016) Ansdell, M., Williams, J. P., van der Marel, N., et al. 2016, ApJ, 828, 46
- Aspin et al. (2009) Aspin, C., Reipurth, B., Beck, T. L., et al. 2009, ApJ, 692, L67
- André et al. (1999) André, P., Motte, F., & Bacmann, A. 1999, ApJ, 513, L57
- Armitage et al. (2001) Armitage, P. J., Livio, M.,& Pringle J. E. 2001, MNRAS, 324, 705
- Audard et al. (2014) Audard, M., Ábrahám, P., Dunham, M. M., et al. 2014, arXiv: 1401.3368
- Barsony et al. (2010) Barsony, M., Wolf-Chase, G. A., Ciardi, D. R., & O’linger, J. 2010, ApJ, 720, 64
- Basu & Vorobyov (2012) Basu, S., & Vorobyov, E. I. , 2012, ApJ, 750, 30
- Bate et al. (2002) Bate, M. R., Bonnell, I. A., & Bromm, V. 2002, MNRAS, 332, L65
- Bell & Lin (1994) Bell, K. R.,& Lin, D. N. C. 1994, ApJ, 427, 987
- Belloche et al. (2002) Belloche, A., André, P., Despois, D., & Blinder, S. 2002, A&A, 393, 927
- Belloche & André (2004) Belloche, A., & André, P. 2004, A&A, 418, L35
- Belloche et al. (2006) Belloche, A., Parise, B., van der Tak, F. F. S., et al. 2006, A&A, 454, L51
- Bergin et al. (2002) Bergin, E. A., Alves, J., Huard, T., & Lada, C. J. 2002, ApJ, 570, L101
- Bisschop et al. (2006) Bisschop, S. E., Fraser, H. J., Öberg, K. I., van Dishoeck, E. F. & Schlemmer, S., 2006, A&A, 449, 1297
- Bjerkeli et al. (2016) Bjerkeli, P., Jørgensen, J. K., Bergin, E. A., et al. 2016, A&A, 595, 39
- Boley & Durisen (2008) Boley, A. C.,& Durisen, R. H. 2008, ApJ, 685, 1193
- Bourke et al. (2005) Bourke, T. L., Crapsi, A., Myers, P. C., et al. 2005, ApJ, 633, L129
- Bourke et al. (2006) Bourke, T. L., Myers, P. C., Evans, N. J., II, et al. 2006, ApJ, 649, L37
- Caratti o Garatti et al. (2011) Caratti o Garatti, A., Garcia Lopez, R., Scholz, A., et al. 2011, A&A, 526, L1
- Carney et al. (2016) Carney, M. T., Yıldız, U. A., Mottram, J. C., et al. 2016, A&A, 586, A44
- Caselli & Ceccarelli (2012) Caselli, P., & Ceccarelli, C. 2012, A&ARv, 20, 56
- Chen et al. (2012) Chen, X., Arce, H. G., Dunham, M. M., & Zhang, Q. 2012, ApJ, 747, L43
- Clarke & Syer (1996) Clarke, C. J., & Syer, D., 1996, MNRAS, 278, L23
- Covey et al. (2011) Covey, K. R., Hillenbrand, L. A., Miller, A. A., et al. 2011, AJ, 141, 40
- Crapsi et al. (2005) Crapsi, A., DeVries, C. H., Huard, T. L., Lee, J.-E., et al. 2005a, A&A, 439, 1023
- Crapsi et al. (2004) Crapsi, A., Caselli, P., Walmsley, C. M., et al. 2004, A&A, 420, 957
- Daniel et al. (2006) Daniel, F., Cernicharo, J., & Dubernet, M.-L. 2006, ApJ, 648, 461
- Daniel et al. (2007) Daniel, F., Cernicharo, J., Roueff, E., Gerin, M.,& Dubernet, M. L., 2007, ApJ, 667, 980
- Di Francesco et al. (2007) Di Francesco, J., Evans, N. J., II, Caselli, P., et al. 2007, in Protostars and Planets V, ed. B. Reipurth, D. Jewitt, & K. Keil (Tucson: Univ. Arizona Press), 17
- Dunham et al. (2006) Dunham, M. M., Evans, N. J., Bourke, T. L., et al. 2006, ApJ, 651, 945
- Dunham et al. (2008) Dunham, M. M., Crapsi, A., Evans, N. J., II, Bourke, T. L., Huard, T. L., Myers, P. C., & Kauffmann, J. 2008, ApJS, 179, 249
- Dunham et al. (2010a) Dunham, M. M., Evans, N. J., Bourke, T. L., et al. 2010, ApJ, 721, 995
- Dunham et al. (2010b) Dunham, M. M., Evans, N. J., II, Terebey, S., Dullemond, C. P., & Young, C. H. 2010, ApJ, 710, 470
- Dunham & Vorobyov (2012) Dunham, M. M., & Vorobyov, E. I. 2012, ApJ, 747, 52
- Dunham et al. (2013) Dunham, M. M., Arce, H. G., Allen, L. E., et al. 2013, AJ, 145, 94
- Dunham et al. (2014) Dunham, M. M., Stutz, A. M., Allen, L. E., et al. 2014, arXiv: 1401.1809
- Emprechtinger et al. (2009) Emprechtinger, M., Caselli, P., Volgenau, N. H., Stutzki, J., & Wiedner, M. C. 2009, A&A, 493, 89
- Evans et al. (2003) Evans, N. J., II, Allen, L. E., Blake, G. A., et al. 2003, PASP, 115, 965
- Evans et al. (2009) Evans, N. J., II, Dunham, M. M., Jørgensen, J. K., et al. 2009, ApJS, 181, 321
- Enoch et al. (2008) Enoch, M. L., Evans, N. J. II, Sargent, A. I., et al. 2008, ApJ, 684, 1240
- Enoch et al. (2009) Enoch, M. L., Evans, N. J, II, Sargent, A. I., & Glenn, J. 2009, ApJ, 692, 973
- Fayolle et al. (2016) Fayolle, E. C., Balfe, J., Loomis, R., et al. 2016, ApJ, 816, L28
- Fedele et al. (2007) Fedele, D., van den Ancker, M. E., Petr-Gotzens, M. G., & Rafanelli, P. 2007, A&A, 472, 207
- Forgan & Rice (2010) Forgan, D., & Rice, K. 2010, MNRAS, 402, 1349
- Frimann et al. (2016) Frimann, S., Jørgensen, J. K., Padoan, P., & Haugbølle, T. 2016, A&A, 587, A60
- Frimann et al. (2017) Frimann, S., Jørgensen, J. K., Dunham, M. M., et al. 2017, arXiv: 1703.10225
- Goldreich & Kwan (1974) Goldreich, P., & Kwan, J. 1974, ApJ, 189, 411
- Hartmann & Kenyon (1996) Hartmann, L., & Kenyon, S. J. 1996, ARA&A, 34, 207
- Hasegawa et al. (1992) Hasegawa, T. I., Herbst, E., & Leung, C. M. 1992, ApJS, 82, 167
- Herbig (1966) Herbig, G. H. 1966, Vistas Astron., 8, 109
- Herbig (1977) Herbig, G. H. 1977, ApJ, 217, 693
- Herczeg et al. (2017) Herczeg, G. J., Johnstone, D., Mairs, S., et al. 2017, arXiv:1709.02052
- Hsieh et al. (2015) Hsieh, T.-H., Lai, S.-P., Belloche, A., Wyrowski, F., & Hung, C.-L. 2015, ApJ, 802, 126
- Hsieh et al. (2016) Hsieh, T.-H., Lai, S.-P., Belloche, A., & Wyrowski, F. 2016, ApJ, 826, 68
- Hsieh et al. (2017) Hsieh, T.-H., Lai, S.-P., & Belloche, A. 2017, ApJ, 153, 173
- Huard et al. (2006) Huard, T. L., Myers, C. M., Murphy, D. C., et al. 2006, ApJ, 640, 391
- Hung & Lai (2010) Hung, C.-L. 2010, Master thesis, National Tsing Hua University (NTHU), Taiwan
- Ivezić et al. (1999) Ivezić, A., Neukova, M., & Elitzur, M. 1999, User Manual for DUSTY (Lexington, KY: Univ. Kentucky)
- Jørgensen (2004) Jørgensen, J. K. 2004, A&A, 424, 589
- Jørgensen et al. (2005) Jørgensen, J. K., Schöier, F. L., & van Dishoeck, E. F. 2005, A&A, 435, 177
- Jørgensen et al. (2013) Jørgensen, J. K., Visser, R., Sakai, N., et al. 2013, ApJ, 779, L22
- Jørgensen et al. (2015) Jørgensen, J. K., Visser, R., Williams, J. P., & Bergin, E. A. 2015, A&A, 579, A23
- Kauffmann et al. (2008) Kauffmann, J., Bertoldi, F., Bourke, T. L., Evans II, N. J., & Lee, C. W. 2008, A&A, 487, 993
- Kauffmann et al. (2011) Kauffmann, J., Bertoldi, F., Bourke, T. L., et al. 2011, MNRAS, 416, 2341
- Keto & Rybicki (2010) Keto E., & Rybicki G. B., 2010, ApJ, 716, 1315
- Kenyon et al. (1990) Kenyon, S. J., Hartmann, L. W., Strom, K. M., & Strom, S. E. 1990, AJ, 99, 3
- Kenyon & Hartmann (1995) Kenyon, S. J., & Hartmann, L. 1995, ApJS, 101, 117
- Kim et al. (2011) Kim, H. J., Evans, N. J., II, Dunham, M. M., et al. 2011, ApJ, 729, 84
- Kim et al. (2012) Kim, H. J., Evans, N. J., II, Dunham, M. M., Lee, J.-E., & Pontoppidan, K. M. 2012, ApJ, 758, 38
- Kóspál et al. (2007) Kóspál, Á., Ábrahám, P., Prusti, T., et al. 2007, A&A, 470, 211
- Kóspál et al. (2011) K´spál, Á., Ábrahám, P., Acosta-Pulido, J. A., et al. 2011, A&A, 527, A133
- Kratter & Lodato (2016) Kratter, K., & Lodato, G. 2016, ARA&A, 54, 271
- Krumholz et al. (2014) Krumholz, M. R., Bate, M. R., Arce, H. G., et al. 2014, Protostars and Planets VI, 234
- Kryukova et al. (2012) Kryukova, E., Megeath, S. T., Gutermuth, R. A., et al. 2012, ApJ, 144,31
- Lin et al. (1985) Lin, D. N. C., Faulkner, J.,& Papaloizou J. 1985, MNRAS, 212, 105
- Liu et al. (2016) Liu, H. B., Takami, M., Kudo, T., et al. 2016, Science Advances, 2, e1500875
- Loughnane et al. (2012) Loughnane, R. M., Redman, M. P., Thompson, M. A., et al. 2012, MNRAS, 420, 1367
- Lee (2011) Lee, C.-F. 2011, ApJ, 741,62
- Lee et al. (2009) Lee, C. W., Bourke, T. L., Myers, P. C., et al. 2009, ApJ, 693, 1290
- Lee et al. (2013) Lee, C. W., Kim, M.-R., Kim, G., Saito, M., Myers, P. C., & Kurono, Y. 2013 ApJ, 777, 50
- Lodato & Clarke (2004) Lodato, G., & Clarke, C. J., 2004, MNRAS, 353, 841
- Mangum & Shirley (2015) Mangum, J. G., & Shirley, Y. L. 2015, PASP, 127, 266
- McKee & Ostriker (2007) McKee, C. F., & Ostriker, E. 2007, ARA&A, 45, 565
- McElroy et al. (2013) McElroy, D.,Walsh, C., Markwick, A. J., et al. 2013, A&A, 550, A36
- Mercer & Stamatellos (2016) Mercer, A., & Stamatellos, D. 2016, arXiv, 1610.08248
- Murillo & Lai (2013) Murillo, N. M., & Lai, S.-P. 2013, ApJ, 764, L15
- Murillo et al. (2013) Murillo, N. M., Lai, S.-P., Bruderer, S., Harsono, D., & van Dishoeck, E. F., 2013, A&A, 560, A103
- Murillo et al. (2015) Murillo, N. M., Bruderer, S., van Dishoeck, E. F., et al. 2015, A&A, 579, A114
- Murillo et al. (2016) Murillo, N. M., van Dishoeck, E. F., Tobin, J. J., & Fedele, D., 2016, A&A, 592, 59
- Muzerolle et al. (1998) Muzerolle, J., Hartman, L., & Calvet, N. 1998, ApJ, 116, 2965
- Ohashi et al. (2014) Ohashi, N., Saigo, K., Aso, Y., et al. 2014, ApJ, 796, 131
- Offner et al. (2009) Offner S. S. R., Klein R. I., McKee C. F., & Krumholz M. R., 2009, ApJ, 703, 131
- Offner & McKee (2011) Offner S. S. R., & McKee C. F. 2011, ApJ, 736, 53
- Offner et al. (2016) Offner, S. S. R., Dunham, M. M., Lee, K. I., Arce, H. G., & Fielding, D. B. 2016, ApJ, 827, L11
- Ossenkopf & Henning (1994) Ossenkopf, V., & Henning, Th. 1994, A&A, 291, 943
- Palau et al. (2014) Palau, A., Zapata, L. A., Rodríguez, L. F., et al. 2014, MNRAS, 444, 833
- Rab et al. (2017) Rab, Ch., Elbakyan, V., Vorobyov, E., et al. 2017, A&A, 604, A15
- Reipurth & Clarke (2001) Reipurth, B., & Clarke, C. 2001, ApJ, 122, 432
- Rice et al. (2003) Rice, W. K. M., Armitage, P. J., Bonnell, I. A., et al. 2003, MNRAS, 346, L36
- Safron et al. (2015) Safron, E. J., Fischer, W. J., Megeath, S. T., et al. 2015, ApJ, 800, L5
- Scholz et al. (2013) Scholz, A., Froebrich, D., & Wood, K. 2013, MNRAS, 430, 2910
- Shimajiri et al. (2014) Shimajiri, Y., Kitamura, Y., Saito, M., et al. 2014, A&A, 564, A68
- Shu (1977) Shu, F. H. 1977, ApJ, 214, 488
- Stamatellos & Whitworth (2009) Stamatellos, D., & Whitworth, A. P. 2009, MNRAS, 392, 413
- Stamatellos et al. (2011) Stamatellos, D., Whitworth, A. P., & Hubber, D. A. 2011, ApJ, 730, 32
- Stamatellos et al. (2012) Stamatellos, D., Whitworth, A. P., & Hubber, D. A. 2012, MNRAS, 427, 1182
- Stanke et al. (2006) Stanke, T., Smith, M. D., Gredel, R., & Khanzadyan, T. 2006, A&A, 447, 609
- Takahashi et al. (2013) Takahashi, S., Ohashi, Nagayoshi, & Bourke, T. L. 2013, ApJ, 774, 20
- Taquet et al. (2016) Taquet V., Wirstr’́om E. S.,& Charnley S. B., 2016, ApJ, 821, 46
- Terebey et al. (1984) Terebey, S., Shu, F. H., & Cassen, P. 1984, ApJ, 286, 529
- Tobin et al. (2012b) Tobin, J. J., Hartmann, L., Chiang, H.-F., et al. 2012, Nature, 492, 83
- Tobin et al. (2013) Tobin, J. J., Bergin, E. A., Hartman, L., et al. 2013, ApJ, 765, 18
- Tobin et al. (2016) Tobin, J. J., Looney, L. W., Li, Z.-Y., et al. 2016, ApJ, 818, 73
- Toomre (1964) Toomre A. 1964, ApJ, 139, 1217
- Tsitali et al. (2013) Tsitali, A. E., Belloche, A., Commerçon, B., & Menten, K. M. 2013, A&A, 557, A98
- Väisälä et al. (2014) Väisälä, M. S., Harju, J., Mantere, M. J., et al. 2014, A&A, 564, A99
- van der Marel et al. (2013) van der Marel, N., Kristensen, L. E., Visser, R., et al. 2013, A&A, 556, A76
- van der Marel et al. (2016) van der Marel, N., Verhaar, B. W., van Terwisga, S., et al. 2016, A&A, 592, A126
- van der Tak et al. (2007) van der Tak, F. F. S., Black, J. H., Schöier, F. L., Jansen, D. J.,& van Dishoeck, E. F. 2007, ApJ, 468, 627
- Visser & Bergin (2012) Visser, R., & Bergin, E. A. 2012, ApJ, 754, L18
- Visser et al. (2015) Visser, R., Bergin, E. A., & Jørgensen, J. K. 2015, A&A, 577, A102
- Vorobyov & Basu (2005) Vorobyov, E. I., & Basu, S. 2005, ApJ, 633, L137
- Vorobyov & Basu (2010) Vorobyov, E. I., & Basu, S. 2010, ApJ, 719, 1896
- Vorobyov & Basu (2013) Vorobyov, E. I.,DeSouza, A. L., & Basu, S, 2013, ApJ768, 131
- Vorobyov & Basu (2015) Vorobyov, E. I., & Basu, S. 2015, ApJ, 805, 115
- Wilson & Rood (1994) Wilson, T. L., & Rood, R. 1994, ARA&A, 32, 191
- Woodall et al. (2007) Woodall, J., Agúndez, M., Markwick-Kemper, A. J., & Millar, T. J. 2007, A&A,466, 1197
- Young & Evans (2005) Young, C. H., & Evans, N. J. II. 2005, ApJ, 672, 293
- Yen et al. (2015) Yen, H.-W., Koch, P. M., Takakuwa, S., & Ho, P. T. P. 2015, ApJ, 799, 193
- Yen et al. (2017) Yen, H.-W., Koch, P. M., Takakuwa, S., et al., 2017, ApJ, 834, 178
- Yıldız et al. (2010) Yıldız, U. A., van Dishoeck, E. F., Kristensen, L. E., et al. 2010, A&A, 521, L40
- Yıldız et al. (2012) Yıldız, U. A., Kristensen, L. E., van Dishoeck, E. F., et al. 2012, A&A, 542, A86
- Yıldız et al. (2015) Yıldız, U. A., Kristensen, L. E., van Dishoeck, E. F., et al. 2015, A&A, 576, A109
- Young et al. (2004) Young, C. H., Jørgensen, J. K., Shirley, Y. L., et al. 2004, ApJS, 154, 396
- Zhu et al. (2009) Zhu, Z., Hartmann, L., & Gammie C. 2009, ApJ, 694, 1045
Appendix A Hyperfine fitting of N2H+ spectra
To derive the optical depth, we fit the hyperfine structure for each pixel (04) in the N2H+ maps. The fitting is done for the pixels with S/N (the rms noise levels range from 0.21 to 0.58 K at a channel width of 0.05 km s-1). For DCE031, the spectra show a “wing-like” structure toward the four spikes seen in the images (e.g., point 1 in Figure A3), which are likely associated with the outflow entrained gas. We thus fit the spectra only on the central flattened envelope in DCE031.
With the high spectral resolution of 0.1 km s-1, we find that many of the regions in fact contain two (or even more) velocity components along the line of sight (e.g. point 3 in Figure A6). For these regions, we fit the spectra with a two-component hyperfine structure. However, depending on linewidth and separation of the two components, the double-peak structures are sometimes only seen in a few of the seven components (e.g. point 4 in Figure A4). In addition, the weak component is usually marginally detected, together with hyperfine anomalies, making the fitting with two components more difficult. As a result, we suggest that the fitting results are decent for the primary component, and for the weak component, the centroid velocity and linewidth are broadly reliable since they are less affected by the signal to noise ratio and hyperfine anomalies. Further details on the dynamics are outside the scope of this paper and will be discussed elsewhere.
The results of hyperfine fitting are shown in Figures A1 to A8 (note that the optical depth is for the weakest component 110–011 which is one third of the isolated component 101–012). When hyperfine anomalies, with reversed relative intensities, are not present, the optical depth is generally low () with the one- or two-component fitting in the primary component, which are relatively reliable. Note that we plot the N2H+ spectra toward the position with a relatively high integrated intensity where the column densities as well as are expected to be high in the map. The hyperfine fitting results can be seriously affected by anomalies. For example, the irregularly high intensity of the isolated hyperfine component in points 4, 5, and 6 in Figure A8 may result in the high optical depth in the best-fit. In addition, since the line profiles do not saturate even for the strong component, the high optical depth from the best-fit is likely affected by hyperfine anomalies. If we take the optical depth of 0.5–0.7 as an upper limit (1.5–2.1 for 101–012 component), the optically thin assumption will result in an underestimation of the column density by a factor of , which is much smaller than the degree of N2H+ depletion toward the center (see section IV.3). Therefore, we suggest that assuming optically thin emission is reasonable for calculating the column density with the 101–012 component.
Appendix B Uncertainty of the peak radius of N2H+ abundance,
Since the N2H+ abundance profiles are obtained from the ratio between the N2H+ and H2 column densities, the uncertainty in primarily comes from (1) the modeled H2 density profiles and (2) differences between the two sides of the cut used to derive the abundance profile. Thus, we measure the peak radius in the abundance profile on each side of the cut separately. For each side, the density structure is assumed to be either (1) a broken power-law (Figure 7) in section IV.3, or (2) a single power-law with , or (3) a single power-law with (Figure A9). In total, we get six measurements for each source. Table 4 lists the range of derived radii, and we take this range as the uncertainty in the measurement.
