Deviations from hydrostatic equilibrium in the circumgalactic medium: spinning hot haloes and accelerating flows
Abstract
Hydrostatic equilibrium (HSE), where the thermal pressure gradient balances the force of gravity, is tested across a range of simulated EAGLE haloes from Milky Way haloes () to cluster scales. Clusters () reproduce previous results with thermal pressure responsible for of the support against gravity, but this fraction drops for group-sized haloes () and is even lower () for haloes between . Energy from feedback grows relative to the binding energy of a halo toward lower mass resulting in greater deviations from HSE. Tangential motions comprise the largest deviation from HSE in haloes indicating that the hot circumgalactic medium (CGM) has significant sub-centrifugal rotation and angular momentum spin parameters higher than the dark matter spin parameters. Thermal feedback can buoyantly rise to the outer CGM of haloes, both moving baryons beyond and feeding uncorrelated tangential motions. The resulting hot halo density and rotation profiles show promising agreement with X-ray observations of the inner Milky Way halo, and we discuss future observational prospects to detect spinning hot haloes around other galaxies. Acceleration and radial streaming motions also comprise significant deviations from HSE, especially net outward accelerations seen in and group haloes indicating active feedback. Black hole feedback acts in a preventative manner during the later growth of group haloes, applying significant accelerations via shocks that do not feed tangential motions. We argue that HSE is a poor assumption for the CGM, especially in the inner regions, and rotating baryonic hot haloes are a critical consideration for analytic models of the CGM.
Keywords:
methods: numerical; galaxies: formation; intergalactic medium; cosmology: theory; quasars: absorption lines; X-rays: galaxies1 Introduction
The efforts to reveal the circumgalactic gas reservoirs that supply galaxies with the fuel to create stars have made significant steps in recent years with instruments including the Cosmic Origins Spectrograph (COS) on Hubble and X-ray instruments on Chandra and XMM. UV absorption line modelling has accounted for a significant cool ( K) gas reservoir extending at least 150 kpc and out to the virial radius (Werk et al., 2014; Borthakur et al., 2016; Keeney et al., 2017, , e.g.). The ambient halo medium that theory predicts should be heated to the virial temperature (), which is K for a “” halo, remains a challenge to detect out to the virial radius, even though there are detections in the inner CGM of luminous spirals and ellipticals (Anderson & Bregman, 2011; Li & Wang, 2013, e.g.) and the Milky Way halo (Miller & Bregman, 2015, e.g.).
These efforts, although admirable, indicate just how nascent the accounting of the CGM multiphase mass budget is (Tumlinson et al., 2017, and references therein). Yet, the main reason we study the CGM is to understand the dynamics of gas fueling, ejection, and recycling that regulate galaxy formation and evolution. The gulf between observations that are only beginning to constrain mass budgets and the theory of how circumgalactic gas feeds star formation is vast. Fundamental theoretical questions are rarely broached including– is the CGM in hydrostatic equilibrium (HSE)?; what comprises the deviations from HSE?; and what are the implications of such deviations?
Studies at the cluster scale have approached these questions, because emission can be measured to (the radius that encloses an overdensity of the critical overdensity) and beyond (McCarthy et al., 2017, see compilation of observational results by ). Additionally, hydrostatic mass estimates of clusters are used as cosmological tools. A number of studies have attempted to quantify deviations from HSE using cosmological hydrodynamic simulations of clusters, usually finding deviations of 10-20% from HSE, but often with differing conclusions as to the specific cause (Fang et al., 2009; Lau et al., 2009; Suto et al., 2013; Nelson et al., 2014; Biffi et al., 2016). Most of these studies quantify the hydrodynamics of intra-cluster medium (ICM) using the Euler equation of momentum conservation,
| (1) |
where is the gravitational potential, and , , and are the velocity, density, and pressure of the gas. HSE applies if .
Halo gas is often assumed to be in HSE in analytically-based models of the CGM (Maller & Bullock, 2004; Tepper-García et al., 2015; Faerman et al., 2017; Mathews & Prochaska, 2017, e.g.), and rarely is HSE tested in simulations with the exception of the Fielding et al. (2017) idealized cases. Quantifying HSE is more fraught with difficulty for the CGM than the ICM, because 1) the CGM is definitely multiphase (Werk et al., 2016, e.g.), while the ICM is dominated by hot gas (Gonzalez et al., 2013, e.g.), and 2) deviations are likely larger owing to the lower binding energy of these haloes, allowing feedback from star formation and active galactic nuclei (AGN) to create greater disturbances. Nevertheless, the hydrodynamic state of the CGM should be a pre-requisite to modelling the formation, dynamics, and fate of the cool and hot gas traced in UV absorption line spectroscopy and X-ray emission and absorption probes.
We use EAGLE (Evolution and Assembly of GaLaxies and their Environments) simulations (Schaye et al., 2015; Crain et al., 2015; McAlpine et al., 2016) to quantify the hydrodynamic state in haloes hosting galaxies that are actively star-forming () and “group”-sized haloes hosting mainly passive galaxies (). Our main simulations are a set of EAGLE zoom haloes that have been tested for a number of CGM studies, including O vi (Oppenheimer et al., 2016) and low metal ions (Oppenheimer et al., 2017b). We are able to output the acceleration vector in the zooms, which can be significant for dynamics.
We lay out the theoretical method to deconstruct the Euler equation into halo support terms, which determine deviations from HSE, and introduce our suite of simulations in §2. We test our method on three haloes spanning the hot halo regime: a cluster, a group, and a Milky Way-mass halo. We present the main results from our samples in §3 where we focus on normalized halo quantities allowing cross-sample comparisons. These results include the fractional deviations from HSE, which leads us into a discussion of velocities normalized to the virial velocity of the halo. Masses and angular momentum spin parameters subdivided into baryonic and dark matter components, as well as reservoirs of baryonic energies, continue our exploration.
Our discussion begins in §4.1 asking how the self-similar scaling relations expected from dark matter structure are broken using the perspective of the CGM. We advocate that feedback rather than cooling causes the fundamental deviations from HSE, and consider observations that can determine the primary deviation from HSE in haloes– gas with significant rotational and tangential motion in §4.2. Future directions for observations, analytical models, and simulations are discussed in §4.3. We summarize in §5. All results are at , unless otherwise noted.
2 Theoretical setup
2.1 Euler equation and terms
We begin with the Euler equation:
| (2) |
The gravitational potential in the last term relates to the total mass (dark matter (DM) plus gas plus stars) within volume , via the Poisson equation integrated at a surface encompassing using Gauss’s Law,
| (3) |
where is the surface element. We then apply Gauss’s law to the Euler equation, putting all forces balancing gravity on the right-hand side:
| (4) |
as done in previous cluster studies.
Adopting a spherical surface, we decompose the right-hand side of 4 into four effective mass terms:
| (5) |
where
| (6) |
| (7) |
| (8) |
and
| (9) |
in spherical coordinates, , , and .
The first term in Equation 5, , represents the thermal pressure gradient of the gas, and should equal in thermal HSE. At the other extreme, gas that is isobaric at a surface will have no thermal support, and the remaining terms should sum up to . Positive pressure gradients can result in negative terms, but this is rare integrating across a spherical surface around a halo.
The second and third terms, and , are the inertial terms, derived from the term in the Euler equation. We refer to as “tangential” support, since it contains both mean and random tangential motions. Mean tangential motions are more related to what we refer to as correlated “rotational” or centrifugal support. The rest of the term arises from uncorrelated motions in the tangential direction, which we show can be significant. This term is always positive by definition.
Like , the streaming term encompasses radial motions both correlated and random. Correlated motions include 1) infalling gas that slows down at lower radii resulting in a negative , and 2) outflowing gas that slows down at larger radii yielding a positive . This term also includes uncorrelated, random dispersion in the radial direction above the grid resolution on which we calculate these quantities (see §2.2), and becomes positive in that case. This latter term can be considered turbulent pressure above the grid resolution.
The acceleration term, , indicates temporal variations in the radial gas velocities, and becomes positive for gas accelerating toward the halo center, and negative for gas accelerating away from the halo center. For example, if at a surface, and the inertial terms are zero, the gas is not pressure supported and will accelerate inward, such that .
Lau et al. (2013) clarifies the meaning of and calculated using Euler “summation” terms as we and Suto et al. (2013) do. Other studies (Nelson et al., 2014, e.g.) use the “average” terms that define “” and “” as correlated tangential and radial motions, and then a to quantify random motions in the radial and tangential directions. Our and as defined above include correlated and random motions, but we break down these two types of motions when discussing velocities in §3.2.
We discuss other sources of pressure in §4.3 not included in our simulation, such as cosmic ray and magnetic pressure, which we argue are less important for hot, K gas than for cool, clouds. Small-scale turbulent pressure below our grid resolution is tested for hot gas, and we find this not to be a significant contributor to the Euler mass terms.
Because we are considering the contributions of Euler terms to the support against gravity, we define the normalized variable
| (10) |
These normalized support variables better highlight the fractional contributions to and deviations from HSE. Additionally, since we cannot “weigh” CGM haloes with current observational probes, effective mass terms have less meaning for the CGM.
2.2 Simulations
We apply the above analysis to the EAGLE zoom simulations introduced in Oppenheimer et al. (2016) as our primary simulation set in this study. We refer the reader to §2 of Oppenheimer et al. (2016) for further details, but briefly describe the simulations here. The EAGLE code (Schaye et al., 2015; Crain et al., 2015) is a heavily modified version of the N-body+Smoothed Particle Hydrodynamic (SPH) Gadget-3 code previously described in Springel (2005). EAGLE uses a pressure-entropy SPH formulation along with several other modification referred to as Anarchy SPH (Schaller et al., 2015). Subgrid prescriptions for radiative cooling (Wiersma et al., 2009a), star formation (Schaye & Dalla Vecchia, 2008), stellar evolution and chemical enrichment (Wiersma et al., 2009b), and superwind feedback associated with star formation (Dalla Vecchia & Schaye, 2012) and black hole (BH) growth (Rosas-Guevara et al., 2015), are included. Planck Collaboration (2014) cosmological parameters are assumed.
The stellar and BH feedback are both thermal in nature. The stellar feedback heats gas particles by K 30 Myr after a star particle forms. The BH feedback adds K in the “Recal” prescription we use for most of the runs and K in the “Ref” prescription for the cluster sample described below. The BH efficiencies, discussed in §3.5, are unchanged between the prescriptions, meaning the latter prescription has a higher mass loading factor.
We use 3 main samples containing 9 haloes each throughout: “” (), “group” (), and “cluster” (). The first two samples are zooms introduced in Oppenheimer et al. (2016), and the latter is selected from the 100 Mpc EAGLE volume. The zooms use the Recal prescription and are run the EAGLE fiducial resolution, equivalent to the EAGLE-HiRes simulation volume. The zooms were run at low redshift with a non-equilibrium ionization and cooling module (Oppenheimer & Schaye, 2013a; Richings et al., 2014) following 136 ionization states for 11 elements. Oppenheimer et al. (2016); Oppenheimer et al. (2017b) showed that the non-equilibrium module insignificantly alters the dynamics of the gas under a uniform extragalactic ionization background, which makes them representative of the EAGLE Recal prescription.
The 9 zooms, listed as Gal001-Gal009 in Table 1 of Oppenheimer et al. (2016), have a halo mass range of with a median mass . The 9 group zooms, listed as Grp001-Grp009 in the same table, have and a median mass of at . The central galaxies have stellar masses, log[], and specific star formation rates, defined as star formation rate divided by , log[sSFR/]. The respective values for the group centrals are and , which corresponds to 4 of 9 galaxies below the passive threshold of sSFR used by Schaye et al. (2015) indicating that there are low levels of star formation in most group galaxies.
We use the nomenclature M[log()], where is the initial mass of SPH particles to indicate simulation resolution. M5.3, signifying , is our fiducial resolution, which is the same resolution as the parent EAGLE-HiRes Recal-L025N0752 volume, where L025N0752 is the EAGLE nomenclature indicating box size, 25 comoving Mpc, and number of SPH and DM particles on a side, 752. The zooms were selected from the Recal-L025N0752 volume, and the group zooms were selected from the EAGLE Ref-L100N1504 volume. Both sets of haloes were selected to host typical galaxies in the evolved Universe. They were run at M5.3 resolution using the Recal prescription beginning from initial conditions. We output the acceleration vector for several snapshots between and .
We also select a “cluster” sample of haloes from the EAGLE Ref-L100N1504 box to test how well we reproduce previous findings, and to provide reference for our lower mass CGM zooms. These 9 haloes range between with a median mass of at , and are the 9 most relaxed of the 12 most massive haloes in the 100 Mpc EAGLE volume. The clusters have the native M6.2 resolution of the Ref-L100N1504 volume, signifying . The central galaxies have values of log[] and log[sSFR/].
Finally, we take the 5 most massive haloes, and make a Milky Way (MW) halo sample with and a median mass of . We rerun these 5 haloes using a “no-wind” prescription at M5.3 resolution, where no stellar and BH feedback occurs. We select these same 5 haloes from the Ref-L025N0376 volume to make a sample of M6.2 zooms to test numerical convergence.11 1 We also test our method on the haloes of the EAGLE Ref-L100N1504 box, and present results on our website: http://www.colorado.edu/casa/hydrohalos.
We calculate the effective mass terms in Equations 6-9 by gridding our simulations onto spherical coordinate systems centered on a halo’s potential minimum in space and velocity. We use 72 logarithmically spaced radial bins22 2 Linear radial spacing was tested and gives similar results, but logarithmic spacing better samples the scales of the CGM. spanning and 180 angular bins per radius (10 bins and 18 bins). The cluster sample uses half as many bins. is computed by summing all gas, star, and DM particles inside . The other terms are calculated as a function of by summing up the grid points across the spherical surface. Partial derivatives of pressure and radial velocity for the (Equ. 6) and (Equ. 8) respectively are calculated across adjacent spherical grid cells.
We tested a number of different ways to sum the Euler terms using differently defined grid cells, and we chose to grid all gas particles and not just the hot, K gas particles that provide thermal support for the halo. The CGM is multiphase, and our method is not perfectly suited for cool clouds embedded in a hot medium. However, we find converged results for the non-thermal Euler terms when summing either all gas or just hot gas using different sized radial bins using both logarithmic and linear spacing, which makes our results for , , and robust with grid cell definition. The biggest variation is in , but we feel confident that we understand why this is. We tested summing in grid shells with no angular coordinates and found that using only hot particles provides a similar answer as calculating using all particles summed in angular grid cells. Cool gas associated either with filaments, satellite galaxies, or CGM clouds biases the thermal pressure gradient, but they are confined to a relatively small number of angular cells per radius due to their small filling factor, thereby allowing the summation of the pressure gradient to be determined mainly by hot gas. An additional test of using only the grid cells with hot gas also yielded similar results. These tests also informed our choice for using relatively fine radial spacing of 0.025 dex for the CGM and 0.05 dex for the ICM. Smaller spacing leads to slightly higher , because turbulent motions are captured above this scale. Our method does not work well if there exist significant deviations from sphericity (e.g. merging galaxies, massive satellites), or if there are other forces at play that are not explicitly treated in Equation 5, such as feedback and viscous forces. Our tests find robust results beyond 30 kpc at M5.3 resolution and 60 kpc at M6.2 resolution.
2.3 Examples
The effective mass terms are shown as a function of radius in the upper left panel of Figure 1 for a typical cluster in our sample with . This halo reproduces similar results reported for clusters (Suto et al., 2013; Lau et al., 2013; Nelson et al., 2014, e.g.): thermal pressure (red line) balances the gravitational mass force (thick black line) at the level, tangential support (green line) contributes at the level, and streaming motions (blue lines) at the several percent level are more often negative mass terms indicating gas slowing down as it infalls (cf. Suto et al., 2013, Figure 5). Dotted lines for indicate negative effective mass values in this panel, but we plot support terms, , on a linear scale (i.e. normalized to ) in the upper right panel. is not saved in our cluster sample, and we suspect that much of the deviation, especially at small , is the result of accelerations, likely arising from shocks developed by AGN superwind feedback.


The lower two panels show a group halo, , and an halo, , at . The group shows large variations in at , which are counterbalanced by . AGN-driven shocks are propagating through the inner CGM, driven by discrete black hole accretion episodes in the last 100 Myr. Crossing a shock from outside inward, the cooler gas streams inward toward the shock, the shock front forms a large jump in and a large acceleration outward ( and negative ). Then inside the shock-heated gas tends toward isobaric conditions, which leads to low and high . This rather extreme case at conceptualizes how Equ. 5 works, but this halo returns mainly to HSE by as the sound crossing time of the inner region is less than the Myr time interval between the snapshots.
As we move to the halo, we see dramatic differences. Thermal support declines to 40-80% over the majority of the CGM, and is the largest non-thermal support term growing steadily toward the center and reaching 70% at kpc. is negative and is positive in the inner 70 kpc, which are both indicative of deviations driven by feedback. Beyond this radius, radial motion terms indicate both accretion and outflows. As in the group halo, fluctuations in mirror fluctuations in , indicating accelerations often arise from deviations in the thermal pressure gradient. We now move from individual objects, all of which can be found on our website http://www.colorado.edu/casa/hydrohalos, to consider the general trends of our halo samples.
3 General trends
3.1 Euler terms
The general trends for the Euler terms appear in Figure 2 where we plot the median and 25%-75% spread for our three halo samples: (aqua), group (orange), and cluster (magenta). From upper left to lower right, the panels show , , , and as a function of fractional virial radius.


Clusters are the most thermally supported, followed closely by groups, and haloes, which reproduce the trends in the example halo in Fig. 1. For haloes, thermal support averages 70-80% from , 40-70% from . drops even further inside , although our method loses accuracy here for haloes, because the stellar and gas discs of similar size break sphericity plus energy deposition by feedback complicates the analysis.
The upper right panel of Fig. 2 shows the next largest contributor, , which includes all tangential motion, mean and random. Clusters hold rather steady at 10%, and groups have more tangential support, averaging 20% at . On the other hand, haloes show steadily rising tangential support reaching 30% at and over 60% at . The tangential term for haloes grows toward lower mass, and can dominate the forces supporting haloes according to our simulations.
The streaming term includes correlated advection and random motions above our grid resolution. The medians of both clusters and groups are small, but groups show more dispersion among the two samples indicating more radial motions. haloes show net positive streaming, adding 5-10% to the forces balancing gravity. We argue that this term results primarily from outflowing hot gas that loses velocity at larger radius. Still, this term is sub-dominant compared to . The inertial terms, and , are not invariant under a Galilean transformation, and become spuriously high if the incorrect position and velocity are used. Fortunately, converges to low values at among the three samples and shows little dispersion, indicating we have centered our haloes correctly. Additionally, velocity profiles explored in Figure 3 converge to the expected values at large radii.
Lastly, we show for just the group and samples. Both groups and haloes more often show negative acceleration support terms in the interior owing to feedback. Feedback-driven shocks appear to regularly accelerate gas in the very interiors of groups at . Gas regularly accelerates inward between around galaxies indicating accretion onto the halo. We do not show median values, but note that the median values are almost always within of unity as expected. More often the is lower than one in the CGM, which could be related to the support from viscous pressure at the locations of shocks, which is not included in Equ. 5 but is implemented in the Anarchy SPH equation of motion using the Cullen & Dehnen (2010) switch.
3.2 Velocities
Much of the deviation from HSE owes to motion, which is why we consider gas velocities in more detail in Figure 3. The upper left panel begins by showing the radially binned 3-dimensional root mean squared (rms) velocity dispersion after subtracting off the central velocity of the halo, defined as
| (11) |
summing over particle indices for component (i.e. DM, hot gas, cool gas) in each radial bin containing particles. We show the hot gas ( K, solid lines) and the dark matter (dashed lines) dispersions for our three halo samples, all normalized the virial velocity (). The dark matter provides a sanity check, reproducing the results seen in previous studies (Navarro et al., 1996, e.g.): , and lower mass haloes have higher in the interior due to higher concentrations.


We concentrate on hot baryons, because these are believed to provide the primary support of the CGM, and we want to explore these motions specifically to see how the hot gas contributes to the inertial terms of the Euler equation. The hot gas has increasing rms velocities for lower mass haloes that grow larger at lower . haloes have hot velocity motions in excess of inside , but this is a small fraction of the overall baryons and hot gas does not dominate the baryon budget until in this sample. The upper right panel shows cumulative baryon profiles for all baryons (including stars, dashed lines), gaseous baryons (dotted lines), and hot baryons (solid lines) normalized the cosmically expected baryonic mass of haloes, . Clusters are essentially baryonically closed and dominated by hot baryons, groups retain 60% of in the hot phase inside , and this value becomes 1/3rd for haloes.
We subdivide velocities into radial and tangential components in the lower two panels of Fig. 3 corresponding to and . In each case, we plot the mean net velocity as a function of ( and ), where
| (12) |
and
| (13) |
as well as the mean rms velocity dispersion as a function of ( and ).
Hot gas shows insignificant net radial inflows in groups and clusters, although clusters show the largest inflows beyond as these haloes undergo more late-time assembly. This is consistent with trending negative outside . Hot radial outflows appear in the interiors of haloes and slow as they progress outward, and is why we argue hot outflows drive the positive values of in Fig. 2. In contrast the cool, K gas shows net infall, which we show as corresponding thin blue lines only for the sample. van de Voort & Schaye (2012) showed that cool gas inflows faster than hot gas in OWLS simulations, but the thermal feedback prescriptions in EAGLE result in a net outflow of hot gas.
Hot tangential velocities increase relative to from clusters down to haloes, where they achieve inside indicating a tangential velocity dispersion capable of supporting the inner halo at . Comparing this to the correlated motion, which is inside , shows the hot halo has significant yet sub-centrifugal rotation. It is worth contrasting this to the cool halo gas, which shows a similar profile for tangential dispersion as the hot gas, . However, (cf. thin blue lines) inside and just beyond , indicating fully centrifugally-supported rotating cool discs extending into the CGM (as opposed to a partially centrifugally-supported inner hot halo). To summarize, we argue for tangential motions providing partial centrifugal support to the inner hot haloes of galaxies, and discuss the implications of this in §4.
3.3 Masses
Returning to the upper right panel of Fig. 3, a model hot halo profile of the MW should likely contain less than half inside despite only of baryons being accounted for in stellar phase (McMillan, 2011; Putman et al., 2012, e.g.). This is because simulations with feedback eject a significant fraction of baryons beyond ( for these EAGLE haloes). Additionally, a fractionally significant component of baryons is in the cool phase around these haloes as calculated most recently by Keeney et al. (2017) and Prochaska et al. (2017) from UV absorption lines, and modeled in detail using these same EAGLE zoom haloes by Oppenheimer et al. (2017b).
The physical details of hot halo profiles in EAGLE will be presented in Davies et al. (in prep.) with results that are promising for X-ray observational constraints (Anderson et al., 2015, e.g.) at and group masses. We also note here that our hot haloes, which account for a third of , have very few hot baryons at low radii. Our MW sample predicts a MW mass halo would have of hot gas inside 50 kpc, which is very close to the value derived by Miller & Bregman (2015) of from O vii and O viii emission lines through the MW halo.
3.4 Angular momenta
Given that there is significant correlated rotation in the CGM, we consider the angular momentum of the CGM and compare it to the other halo components. Significant angular momentum in the cool phase is universal across a range of simulations (Stewart et al., 2017, e.g.), which exceeds the angular momentum of the DM and stars when quantifying the halo spin parameter,
| (14) |
using the Bullock et al. (2001) definition for component , where is the halo-averaged specific angular momentum,
| (15) |
and is the angular momentum vector,
| (16) |
summing over particle indices of component with masses . We plot the halo spin parameters in Figure 4 for different components, including dark matter, which shows typical values of for our three samples (Bullock et al., 2001). Stellar spin parameters are less than , although we exclude satellites to focus on the central galaxy () since including all stars () results in for clusters.

A number of works have focused on how angular momentum from the cool CGM translates into the galaxy assembly and morphology (Danovich et al., 2015; Teklu et al., 2015; Garrison-Kimmel et al., 2017, e.g.). Usually the cool CGM forms an extended disc with at least around spiral galaxies, which is also seen in our samples. In groups and clusters, the fractionally small mass of the cool gas (shading of scales with cool CGM gas fraction) is also higher than although it is less clear what the origin of this angular momentum is. Excluding satellite ISM gas does not appreciably change , indicating the cool CGM in massive haloes has the highest angular momentum of any component.
Considering the hot gas, we expect and find high values of around our sample compared to groups and clusters, because of the galaxies’ significant hot halo rotations (§3.2). Indeed is 0.08 for our sample, or about the spin of the dark matter for these galaxies, . Our MW sample has slightly higher spins: and , which are values more representative of the typical halo selected from a periodic volume. For the MW sample, the magnitude of the angular momentum inside is the greatest for the hot halo, , compared to the cool gas, , and stars, .
Of particular interest is the evidence for the Milky Way having a rotating hot halo from O vii absorption line profiles, which Hodges-Kluck et al. (2016) observed to be spinning at . They calculate at 75 kpc, which is equivalent to the amount of angular momentum calculated to be in the stellar plus H i MW disc. Our MW sample finds that at 90 kpc (), where it also equals the sum of angular momentum contained in stars and cool gas. We discuss the implications of hot rotating haloes in §4, where we suggest that more of the tangential motions of the MW hot halo are in correlated rotation than the typical galaxy.
3.5 Energies
The larger velocity components of haloes could indicate a different partition of energies between thermal and kinetic components. However, we find a very mild trend across our samples in Figure 5, where we plot energies relative to the binding energy of the gaseous halo,
| (17) |
where we loop over gaseous particle indices with mass and radius . The thermal energy is
| (18) |
where is the Boltzmann constant, and is the particle temperature, is mean molecular weight, and is proton mass. The kinetic energy is
| (19) |
dominates ranging from for to for the cluster sample. is as expected from the virial theorem, and demonstrates our haloes are in virial equilibrium with gaseous motions mainly thermalized inside . This supports the finding of Oppenheimer et al. (2016) using these same simulations to show that high oxygen ions, which are collisionally ionized, trace the virial temperatures of haloes, . O vi is argued to appear around and not group haloes, because the former have temperatures that overlap the K O vi collisionally ionized temperature. Despite the values of in haloes exceeding at , the kinetic energy contribution is comparatively small, since most of the hot gas resides at larger radii for these haloes.

The source of the velocities are in part related to the process of feedback, which we quantify as , where stellar feedback is
| (20) |
and feedback from BH accretion is
| (21) |
Stellar feedback efficiency using the EAGLE Recal prescription is erg (Crain et al., 2015), and we add a multiple of 1.8 to present-day stellar masses to account for stellar death (Oppenheimer et al., 2016). The EAGLE is 1.5% of the rest-mass energy of the black hole (Schaye et al., 2015). Feedback energies are renormalized down by the mass of baryons inside divided by .33 3 Feedback energies should be compared to the binding energy of all baryons that would be inside without feedback, and this provides a correction to these energies (, , & ) of , , and relative to for , group, and cluster haloes, respectively. Both forms of feedback are imparted thermally, which likely increases the hot gas motions relative to a kinetic feedback prescription. However, the feedback behaves very differently at the threshold mass of . Bower et al. (2017) used EAGLE to demonstrate stellar-driven thermal feedback can rise buoyantly through the ambient halo medium below , but becomes ineffective above as the adiabat of the heated gas no longer exceeds that of the inner CGM. We argue that the hot halo motions for the galaxies arise from stellar feedback that rose buoyantly through the halo many Gyrs earlier when the halo was less massive and had lower pressure. This feedback promotes low-entropy, low-angular momentum gas from the center of the galaxy (Governato et al., 2010; Brook et al., 2012; Übler et al., 2014; Christensen et al., 2016, e.g.) via buoyant adiabatic expansion to radii . The K O vi haloes in these zooms (Oppenheimer et al., 2016) are a remnant of this process. The feedback launched at an average can in part explain the strong O vi observed by COS-Halos at impacts up to 150 kpc from galaxies (Tumlinson et al, 2011), but residing at kpc according to our zooms. Some of this hot gas at journeys back into the inner halo, having gained angular momentum, but not necessarily in a coherent direction. Therefore, the mean tangential motions are significantly larger than the correlated rotation. These trends were seen in haloes in EAGLE volumes by Stevens et al. (2017), who also reported significant hot halo angular momentum with a spin direction that is usually offset from the cooling gas that builds the disc. Hence, it is not surprising to find significant tangential motion in both hot and cool components of the CGM that is not necessarily correlated in direction and velocity (Fig. 3, lower panels, cf. cyan and blue lines).
The energy imparted around group haloes is dominated by BH feedback, which acts in a preventative manner by heating halo gas. The buoyant launching method is ineffective here (Bower et al., 2017), so despite , group haloes do not eject as much material beyond (Fig. 3, upper right). The angular momentum of the hot gas is not promoted by AGN-driven shocks that have a high degree of spherical symmetry around the central galaxy. These shocks are a feature of EAGLE feedback that may not be reproduced in the real Universe where wind-driven bubbles are offset from the galaxy center, often in bipolar structures (McNamara et al., 2014, e.g.). Virial shocks have primarily processed the ICM, resulting in efficient thermalization, and low velocities (relative to ) in the interior of our cluster sample.
4 Discussion
We have examined the hydrodynamic state of , group, and cluster haloes, and determined that baryons deviate from HSE the most at lower masses. We begin our discussion by considering how baryons break the near self-similarity expected from dark matter halo theory, and how this manifests itself in the CGM.
4.1 Breaking the self-similarity of the CGM
Dark matter-only simulations indicate and cluster haloes, while not completely scale invariant owing to CDM cosmology, have very similar structures (Klypin et al., 1999; Moore et al., 1999, e.g.). A cluster exhibits lower concentration and more infall at the virial radius due to later assembly, but these effects are small compared to processes we refer to as “baryonic processing.” Baryons added into an adiabatic simulation (i.e. no cooling) are retained within independent of virial mass (Crain et al., 2007), although there are small deviations from scale-free density and temperature profiles across cluster masses (Ascasibar et al., 2006). We concentrate on the two largest sources of baryonic processing, cooling and feedback.
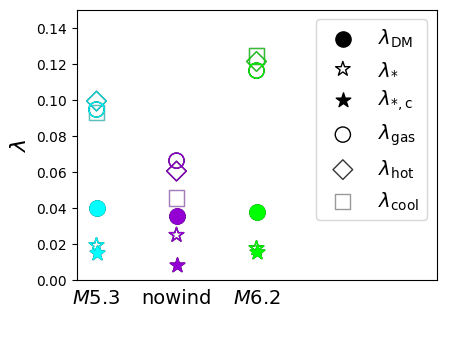
Cooling: To isolate the effect of cooling, we use our 5 halo no-wind MW sample, plotted for several of our median relations in violet in Figure 6. Compared to the 5 halo MW EAGLE sample (cyan, labeled M5.3), we see much higher (upper left), much lower (upper right), and significantly less spin in the hot gas, cool CGM, and stars in the central galaxy (lower left). To isolate the effect of cooling, we compare the no-wind sample to the cluster sample where gas is heated to such high temperatures that cooling becomes inefficient. The hydrodynamic state of the no-wind CGM holds more similar characteristics with the cluster sample ( dominates everywhere, is small, is smaller).



The cluster versus no-wind comparison does not purely isolate cooling, because the former does have stellar and BH feedback. The median stellar baryon fraction in stars is 7.8% in clusters and 79% in no-wind zooms, leaving 89% of baryons in the ICM and 30% in the no-wind CGM44 4 No-wind haloes appear to exceed by 10% in our accounting. (cf. lower right panel of Fig. 6). A no-wind cluster simulation would certainly have a higher stellar baryon fraction (), but most of the baryons would remain in the ICM based on previous studies (Lewis et al., 2000). However, we argue that the no-wind haloes with one dominant galaxy results in significant baryonic contraction (Blumenthal et al., 1986) that exceeds the DM assembly effect of higher concentrations for haloes, resulting in more rotation and higher hot gas spin parameters. Nevertheless, despite this effect, the hydrodynamic states of the no-wind and cluster samples are very similar considering the gas from . Thermal support dominates in similar fashion, despite the fact that clusters retain rd of between these radii and no-wind haloes sum to only 18% of over the same radii.
Feedback: We therefore put forth that feedback is the primary driver for deviations from HSE in the CGM. Net acceleration out of the galaxy and significant dispersions in streaming suggest decelerating outflows contribute to larger deviations from HSE for galaxies compared to their no-wind analogues. These ongoing, transient processes contribute to the continual and cumulative build-up of tangential motions supporting the inner CGM. In haloes, buoyant thermal winds travel to the outer CGM (Bower et al., 2017), gaining angular momentum as they re-accrete back into the inner CGM and onto the galaxy.
Other simulations find that winds leaving the disc for long times, ( Gyr), travel large distances ( kpc), and always gain angular momentum before re-accreting onto the galaxy (Übler et al., 2014). Christensen et al. (2016) showed that gas recycled onto galaxies is “spun-up” by the halo and gains more angular momentum than it had before it was ejected. However, few simulations have considered the angular momentum of the hot halo gas itself. Our work does not have hot haloes spinning at the virial velocity, otherwise the halo would arrange itself in a kinematic hot disc. Our haloes are essentially spherical, having significant uncorrelated tangential motion that must be continually replenished by feedback otherwise such motions would dissipate in a spherical geometry. The work of Stevens et al. (2017) buoys our results, quantifying the significant angular momentum of the hot CGM in EAGLE haloes, but finding its axis usually misaligned with the cool gas disc such that gas cooling out of the hot halo precesses to align with the cool gas disc. Hence, rotating hot haloes may not necessarily align with stellar discs, and the significant magnitude of the tangential motion in the inner halo is not all in a correlated spinning halo (cf. cyan dotted and solid lines in lower right panel of Fig. 3).
4.2 Observational evidence and prospects for rotating hot haloes
The clearest evidence for rotating hot haloes may be our own Milky Way, which shows evidence of a sub-centrifugal rotating hot halo at , or about th the MW disc rotation speed (Hodges-Kluck et al., 2016). This supports our findings of significant tangential motion in our primary zooms. While the MW shows more coherent rotation that appears aligned with the disc compared to EAGLE galaxies, it may be linked to the relatively unperturbed nature of the Milky Way stellar disc with little evidence of a major merger in the last Gyr (Stewart et al., 2008).
Detecting rotating hot haloes around other galaxies is beyond the capability of present-day X-ray telescopes, but instrument technology capable of resolution to resolve sub- O vii and O viii line profiles could resolve these velocities (Miller et al., 2016). However, nearer term observational prospects may rely on observing the gas cooling out of rotating hot gas, and relating this process to warped galactic disc structures. Roškar et al. (2010) examined a high-resolution cosmological zoom simulation finding that cool, accreting gas is strongly torqued by spinning hot halo gas. They argued a misaligned warped disc of newly accreted material is indicative of a hot halo spinning on an unaligned axis.
Linking cooling gas structures in the CGM to morphological disc structures could be done with current telescopes. A Cosmic Origins Spectrograph (COS) survey targeting gas along the semi-major axis of edge-on disc galaxies could relate H i and metal absorption kinematics to these galaxy’s low-surface brightness extended structures indicating the presence or absence of warps, and ultimately the influence of the rotating hot halo. Already, tantalizing evidence exists from the COS-GASS/COS-Halos kinematic compilation of Borthakur et al. (2016) showing that while there is ubiquitous H i around star-forming galaxies, it becomes increasingly kinematically offset from the central galaxy velocity at lower impact parameters.
4.3 Future directions
4.3.1 Observatories
Future approved and proposed X-ray missions face the challenge of detecting hot CGM profiles tracing the majority of a halo’s baryons, which have been long known to diverge from self-similar scaling relations (White & Frenk, 1991; Babul et al., 2002; Davé et al., 2002; Crain et al., 2010, e.g.). While feedback significantly reduces X-ray luminosities by redistributing hot baryons into a more extended and diffuse distribution, the velocity structures of the hot baryons, especially those in the interior CGM, also become significantly perturbed by feedback. A far more complete understanding of the dynamics of the hot CGM requires not just sensitivity to detect baryons out to , but the velocity resolution to observe the hydrodynamics in the inner CGM. Thus, X-ray mission concepts, especially NASA’s Lynx large strategic mission concept (Gaskin et al., 2016), should consider how to resolve the velocity structure within in a survey of Milky Way-like haloes.
The proposed Arcus NASA Explorer mission (Smith et al., 2016) could uncover hot gas kinematics around MW-like galaxies early in the next decade. With a resolution grating spectrometer resolving velocities , the hot CGM kinematic spread and velocity offset from the galaxy’s systematic velocity can be determined via quasar absorption line spectroscopy of O vii and O viii lines that are expected to be mÅ in strength at kpc. This spectral resolution combined with a collecting area of cm2 provides an order of magnitude improvement over Chandra and XMM grating spectrometers.
However, sensitivity of emission out to to attempt to ascertain the masses and the thermodynamic states of isolated spiral and elliptical galaxy haloes requires a high-resolution microcalorimeter on a mission like Lynx. Our extension of the formalism developed to derive cluster masses and quantify deviations from HSE could apply to the CGM as the outer CGM beyond is primarily supported by the thermal pressure gradient. The zooms in this paper were previously used to argue that COS-Halos passive galaxies live in haloes more massive than COS-Halos star-forming galaxies (Oppenheimer et al., 2016), but only sensitive X-ray observations can weigh these haloes and reveal how the thermodynamic processes of virialization and feedback distribute the bulk of a halo’s baryons.
4.3.2 Analytic models
It is crucial to understand the hydrodynamics of the hot phase of the CGM for how galaxies grow, even though this phase is less important than the cool phase for fueling star formation (Kereš et al., 2005; Dekel & Birnboim, 2006, e.g.). Although the mass of the inner CGM at is dominated by cool gas (Fig. 3, upper right panel), and this is consistent with a range of low-ion metal absorption line observations (Oppenheimer et al., 2017b), the hot phase determines the medium for those cool clouds. If the inner hot halo is rapidly rotating and also has significant uncorrelated radial and tangential motions, then the pressure profile will be different than the HSE assumption. This makes static analytic hot halo models like Maller & Bullock (2004) obsolete. The claim that cool clouds are out of pressure equilibrium with the hot phase at a level of as Werk et al. (2014) holds no relevance for cosmologically-based simulations that include the effect of significant feedback. A completely new set of analytic models that include kinetic haloes is required to understand the formation, survival, and destruction of cool clouds that comprise the majority of CGM absorption line measurements (Stocke et al., 2013; Werk et al., 2013; Bordoloi et al., 2014; Liang & Chen, 2014; Borthakur et al., 2015; Burchett et al., 2015; Johnson et al., 2015, e.g.). Otherwise, one is considering the wrong models for how gas feeds galaxies.
Pezzulli et al. (2017) developed analytical models of hot haloes with sub-centrifugal rotation, which they argued are necessary for the inside-out growth of disc galaxies using cosmologically motivated angular momentum distributions. They motivated a model where super-virial temperatures in the inner CGM, as indicated by observations (Miller & Bregman, 2015), require ejective feedback to remove low angular momentum gas and place it in the outer halo. The mixing of specific angular momentum from cosmological accretion and recycled gas adds further complexity to models like Pezzulli et al. (2017). Adding in the processes of gas cooling out of dynamic hot haloes, the survival of cool filaments under the shear of hot gas rotation, and the redistribution of feedback-driven gas and its angular momentum are relevant next steps in such explorations.
4.3.3 Simulations
Of course cosmologically-based simulations with refined feedback prescriptions (Hopkins et al., 2014; Vogelsberger et al., 2014; Schaye et al., 2015; Davé et al., 2016) include all of the above processes, but their complexity can inhibit easy interpretation. Our decomposition of the Euler terms in a single dimension (radial) reveals interesting trends as to what provides support to the CGM, but a full force “audit” of a simulation can reveal the hydrodynamical interactions setting the force balance at the surfaces between each resolution element. What torque does a rotating hot halo have on structures like the Magellanic stream and high-velocity clouds (Salem et al., 2015, e.g.)? How do the shear forces between such a hot halo spinning on an axis misaligned with an extended cool disc manifest themselves in warped disc structures (Roškar et al., 2010, e.g.)? Is collisionally ionized O vi with cooling times much less than a Hubble time continually excited by weak shocks from rotational motions?
Different numerical methods will give different quantifications of forces active on the multiphase medium, but applying this type of formalism also allows other forces not included in our simulations to be quantified. Non-thermal pressure sources including magnetic fields and cosmic rays could be significant in other models (Faerman et al., 2017, e.g.) and simulations (Salem et al., 2016; Nelson et al., 2017, e.g.). Werk et al. (2014) and McQuinn & Werk (2017) argued that non-thermal pressures in cool, K clouds are needed to balance the thermal pressure of the hot medium. The Salem et al. (2016) simulations show significant cosmic ray pressure in the cool CGM, while the hot CGM is still dominated by thermal pressure.
5 Summary
We examine the hydrodynamic state of haloes hosting normal galaxies to determine how the circumgalactic medium deviates from hydrostatic equilibrium (HSE). Our study uses simulated clusters as a reference point, which are confirmed to be in HSE at the level (Suto et al., 2013, e.g.). The CGM in group () and () haloes are not scaled down versions of clusters, but have larger deviations from HSE, especially in their interiors. Tangential motions contribute the largest deviation from HSE, especially around galaxies. The motions not only include sub-centrifugal rotation of hot halo gas, but also uncorrelated tangential motions that are continually replenished by thermal feedback. Radial streaming motions and acceleration related to outflows are also significant in haloes, especially inside where thermally-supported HSE is a poor description.
Haloes from to are well-described as being in virial equilibrium with thermal energy dominating over kinetic energy. Stellar and BH feedback are primarily responsible for disrupting the expected scaling relations at the low-mass end of the hot halo regime. While cooling is also more efficient for these haloes, the ability of feedback to overcome the binding energy of the halo gas drives up to half of the baryons beyond and transfers significant angular velocity to re-accreting gas. haloes advect low-angular momentum disc gas via buoyant thermal feedback (Bower et al., 2017) to the outer CGM, from where hot gas re-accretes over the course of many Gyr spinning up the hot haloes and providing excess uncorrelated tangential velocities. Groups also impart significant feedback energy relative to their binding energies, but AGN heating acts primarily as late-time preventative feedback unable to remove baryons from while not adding to tangential velocities.55 5 Visit http://www.colorado.edu/casa/hydrohalos for visualizations of these processes caught in the act.
The EAGLE simulations used in this investigation have been extensively tested against observations of both the CGM and galaxies. Our zooms reproduce key observations of CGM metal absorption (Oppenheimer et al., 2016; Oppenheimer et al., 2017a; Oppenheimer et al., 2017b), H i absorption properties (Horton et al., in prep.), and X-ray emission properties (Davies et al., in prep.). Our Milky Way sample masses, velocities, and angular momenta of the inner hot halo compare well to X-ray-derived values of our halo (Miller & Bregman, 2015; Hodges-Kluck et al., 2016), and lend credence that spinning hot haloes are not just theoretical. These zooms are part of the broader EAGLE suite of simulations that make successful predictions for a variety of galaxy observables, including the galactic stellar mass function, to which the model was calibrated (Schaye et al., 2015). Hence, EAGLE simulations are especially powerful for motivating new observational techniques focusing on the kinematics of the hot and cool CGM around normal galaxies. We therefore advocate observational campaigns that relate the hot gas motions in the CGM to extended cool gas structures and morphological stellar disc features as a priority in the understanding of galaxy assembly.
acknowledgments
Valuable discussions with Joel Bregman, Romeel Davé, Neal Katz, Anatoly Klypin, Gabriele Pezzulli, Mary Putman, John Stocke, and Gurtina Besla contributed to this work. In particular, BDO acknowledges the detailed e-mail discussions with Yasushi Suto about Euler terms, the discussion of viscosity with Vladimir Zhdankin, and the input from Ryan Horton enhancing the clarity of the manuscript. BDO is grateful for Michael Wyner for copyediting the final submitted manuscript. The author thanks the anonymous referee for their review that improved this manuscript. The author thanks the EAGLE consortium for providing public access to the simulations. The Hubble Theory grant HST-AR-14577 supported this work. This work used the DiRAC Data Centric system at Durham University, operated by the Institute for Computational Cosmology on behalf of the STFC DiRAC HPC Facility (www.dirac.ac.uk). This equipment was funded by BIS National E-infrastructure capital grant ST/K00042X/1, STFC capital grants ST/H008519/1 and ST/K00087X/1, STFC DiRAC Operations grant ST/K003267/1 and Durham University. DiRAC is part of the National E-Infrastructure. Analysis was run at Leiden Observatory with the support of Erik Deul and David Jansen.
References
- Anderson & Bregman (2011) Anderson, M. E., & Bregman, J. N. 2011, ApJ, 737, 22
- Anderson et al. (2015) Anderson, M. E., Gaspari, M., White, S. D. M., Wang, W., & Dai, X. 2015, MNRAS, 449, 3806
- Ascasibar et al. (2006) Ascasibar, Y., Sevilla, R., Yepes, G., Müller, V., & Gottlöber, S. 2006, MNRAS, 371, 193
- Babul et al. (2002) Babul, A., Balogh, M. L., Lewis, G. F., & Poole, G. B. 2002, MNRAS, 330, 329
- Biffi et al. (2016) Biffi, V., Borgani, S., Murante, G., et al. 2016, ApJ, 827, 112
- Blumenthal et al. (1986) Blumenthal, G. R., Faber, S. M., Flores, R., & Primack, J. R. 1986, ApJ, 301, 27
- Bordoloi et al. (2014) Bordoloi, R., Tumlinson, J., Werk, J. K., et al. 2014, ApJ, 796, 136
- Borthakur et al. (2015) Borthakur, S., Heckman, T., Tumlinson, J., et al. 2015, ApJ, 813, 46
- Borthakur et al. (2016) Borthakur, S., Heckman, T., Tumlinson, J., et al. 2016, ApJ, 833, 259
- Bower et al. (2017) Bower, R., Schaye, J., Frenk, C. S., et al. 2017, MNRAS, 465, 32
- Brook et al. (2012) Brook, C. B., Stinson, G., Gibson, B. K., et al. 2012, MNRAS, 419, 771
- Bullock et al. (2001) Bullock, J. S., Dekel, A., Kolatt, T. S., et al. 2001, ApJ, 555, 240
- Burchett et al. (2015) Burchett, J. N., Tripp, T. M., Prochaska, J. X., et al. 2015, ApJ, 815, 91
- Christensen et al. (2016) Christensen, C. R., Davé, R., Governato, F., et al. 2016, ApJ, 824, 57
- Crain et al. (2007) Crain, R. A., Eke, V. R., Frenk, C. S., et al. 2007, MNRAS, 377, 41
- Crain et al. (2010) Crain, R. A., McCarthy, I. G., Frenk, C. S., et al. 2010, MNRAS, 407, 1403
- Crain et al. (2015) Crain, R. A., Schaye, J., Bower, R. G., et al. 2015, MNRAS, 450, 1937
- Cullen & Dehnen (2010) Cullen, L., & Dehnen, W. 2010, MNRAS, 408, 669
- Dalla Vecchia & Schaye (2012) Dalla Vecchia, C., & Schaye, J. 2012, MNRAS, 426, 140
- Danovich et al. (2015) Danovich, M., Dekel, A., Hahn, O., Ceverino, D., & Primack, J. 2015, MNRAS, 449, 2087
- Davé et al. (2002) Davé, R., Katz, N., & Weinberg, D. H. 2002, ApJ, 579, 23
- Davé et al. (2016) Davé, R., Thompson, R., & Hopkins, P. F. 2016, MNRAS, 462, 3265
- Dekel & Birnboim (2006) Dekel, A., & Birnboim, Y. 2006, MNRAS, 368, 2
- Faerman et al. (2017) Faerman, Y., Sternberg, A., & McKee, C. F. 2017, ApJ, 835, 52
- Fang et al. (2009) Fang, T., Humphrey, P., & Buote, D. 2009, ApJ, 691, 1648
- Fielding et al. (2017) Fielding, D., Quataert, E., McCourt, M., & Thompson, T. A. 2017, MNRAS, 466, 3810
- Garrison-Kimmel et al. (2017) Garrison-Kimmel, S., Hopkins, P. F., Wetzel, A., et al. 2017, arXiv:1712.03966
- Gaskin et al. (2016) Gaskin, J., Özel, F., & Vikhlinin, A. 2016, SPIE, 9904, 99040N
- Gonzalez et al. (2013) Gonzalez, A. H., Sivanandam, S., Zabludoff, A. I., & Zaritsky, D. 2013, ApJ, 778, 14
- Governato et al. (2010) Governato, F., Brook, C., Mayer, L., et al. 2010, Nature, 463, 203
- Hodges-Kluck et al. (2016) Hodges-Kluck, E. J., Miller, M. J., & Bregman, J. N. 2016, ApJ, 822, 21
- Hopkins et al. (2014) Hopkins, P. F., Kereš, D., Oñorbe, J., et al. 2014, MNRAS, 445, 581
- Johnson et al. (2015) Johnson, S. D., Chen, H.-W., & Mulchaey, J. S. 2015, MNRAS, 449, 3263
- Keeney et al. (2017) Keeney, B. A., Stocke, J. T., Danforth, C. W., et al. 2017, ApJS, 230, 6
- (2005) Kereš, D., Katz, N., Weinberg, D. H., & Davé, R. 2005, MNRAS, 363, 2
- Klypin et al. (1999) Klypin, A., Kravtsov, A. V., Valenzuela, O., & Prada, F. 1999, ApJ, 522, 82
- Lau et al. (2009) Lau, E. T., Kravtsov, A. V., & Nagai, D. 2009, ApJ, 705, 1129
- Lau et al. (2013) Lau, E. T., Nagai, D., & Nelson, K. 2013, ApJ, 777, 151
- Lewis et al. (2000) Lewis, G. F., Babul, A., Katz, N., et al. 2000, ApJ, 536, 623
- Li & Wang (2013) Li, J.-T., & Wang, Q. D. 2013, MNRAS, 428, 2085
- Liang & Chen (2014) Liang, C. J., & Chen, H.-W. 2014, MNRAS, 445, 2061
- (2004) Maller, A. H., & Bullock, J. S. 2004, MNRAS, 355, 694
- Mathews & Prochaska (2017) Mathews, W. G., & Prochaska, J. X. 2017, arXiv:1708.07140
- McAlpine et al. (2016) McAlpine, S., Helly, J. C., Schaller, M., et al. 2016, Astronomy and Computing, 15, 72
- McCarthy et al. (2017) McCarthy, I. G., Schaye, J., Bird, S., & Le Brun, A. M. C. 2017, MNRAS, 465, 2936
- McMillan (2011) McMillan, P. J. 2011, MNRAS, 414, 2446
- McNamara et al. (2014) McNamara, B. R., Russell, H. R., Nulsen, P. E. J., et al. 2014, ApJ, 785, 44
- McQuinn & Werk (2017) McQuinn, M., & Werk, J. K. 2017, arXiv:1703.03422
- Miller & Bregman (2015) Miller, M. J., & Bregman, J. N. 2015, ApJ, 800, 14
- Miller et al. (2016) Miller, M. J., Hodges-Kluck, E. J., & Bregman, J. N. 2016, ApJ, 818, 112
- Moore et al. (1999) Moore, B., Ghigna, S., Governato, F., et al. 1999, ApJ, 524, L19
- Navarro et al. (1996) Navarro, J. F., Frenk, C. S., & White, S. D. M. 1996, ApJ, 462, 563
- Nelson et al. (2014) Nelson, K., Lau, E. T., Nagai, D., Rudd, D. H., & Yu, L. 2014, ApJ, 782, 107
- Nelson et al. (2017) Nelson, D., Kauffmann, G., Pillepich, A., et al. 2017, arXiv:1712.00016
- Oppenheimer & Schaye (2013a) Oppenheimer, B. D., & Schaye, J. 2013, MNRAS, 434, 1043
- Oppenheimer et al. (2016) Oppenheimer, B. D., Crain, R. A., Schaye, J., et al. 2016, MNRAS, 460, 2157
- Oppenheimer et al. (2017a) Oppenheimer, B. D., Segers, M., Schaye, J., et al. 2017, submitted
- Oppenheimer et al. (2017b) Oppenheimer, B. D., Schaye, J., Crain, R., et al. 2017, submitted
- Pezzulli et al. (2017) Pezzulli, G., Fraternali, F., & Binney, J. 2017, MNRAS, 467, 311
- Planck Collaboration (2014) Planck Collaboration, 2014, A&A, 571, A1
- Prochaska et al. (2017) Prochaska, J. X., Werk, J. K., Worseck, G., et al. 2017, ApJ, 837, 169
- Putman et al. (2012) Putman, M. E., Peek, J. E. G., & Joung, M. R. 2012, ARA&A, 50, 491
- Rahmati et al. (2016) Rahmati, A., Schaye, J., Crain, R. A., et al. 2016, MNRAS, 459, 310
- Richings et al. (2014) Richings, A. J., Schaye, J., & Oppenheimer, B. D. 2014, MNRAS, 440, 3349
- Rosas-Guevara et al. (2015) Rosas-Guevara, Y. M., Bower, R. G., Schaye, J., et al. 2015, MNRAS, 454, 1038
- Roškar et al. (2010) Roškar, R., Debattista, V. P., Brooks, A. M., et al. 2010, MNRAS, 408, 783
- Salem et al. (2015) Salem, M., Besla, G., Bryan, G., et al. 2015, ApJ, 815, 77
- Salem et al. (2016) Salem, M., Bryan, G. L., & Corlies, L. 2016, MNRAS, 456, 582
- (2015) Schaller, M., Dalla Vecchia, C., Schaye, J., et al. 2015, MNRAS, 454, 2277
- Schaye & Dalla Vecchia (2008) Schaye, J., & Dalla Vecchia, C. 2008, MNRAS, 383, 1210
- Schaye et al. (2015) Schaye, J., Crain, R. A., Bower, R. G., et al. 2015, MNRAS, 446, 521
- Smith et al. (2016) Smith, R. K., Abraham, M. H., Allured, R., et al. 2016, SPIE, 9905, 99054M
- (2005) Springel, V. 2005, MNRAS, 364, 1105
- Stevens et al. (2017) Stevens, A. R. H., Lagos, C. d. P., Contreras, S., et al. 2017, MNRAS, 467, 2066
- Stewart et al. (2008) Stewart, K. R., Bullock, J. S., Wechsler, R. H., Maller, A. H., & Zentner, A. R. 2008, ApJ, 683, 597-610
- Stewart et al. (2017) Stewart, K. R., Maller, A. H., Oñorbe, J., et al. 2017, ApJ, 843, 47
- Stocke et al. (2013) Stocke, J. T., Keeney, B. A., Danforth, C. W., et al. 2013, ApJ, 763, 148
- Suto et al. (2013) Suto, D., Kawahara, H., Kitayama, T., et al. 2013, ApJ, 767, 79
- Tepper-García et al. (2015) Tepper-García, T., Bland-Hawthorn, J., & Sutherland, R. S. 2015, ApJ, 813, 94
- Teklu et al. (2015) Teklu, A. F., Remus, R.-S., Dolag, K., et al. 2015, ApJ, 812, 29
- Tumlinson et al (2011) Tumlinson, J., Thom, C., Werk, J. K., et al. 2011, Science, 334, 948
- Tumlinson et al. (2017) Tumlinson, J., Peeples, M. S., & Werk, J. K. 2017, ARA&A, 55, 389
- Übler et al. (2014) Übler, H., Naab, T., Oser, L., et al. 2014, MNRAS, 443, 2092
- van de Voort & Schaye (2012) van de Voort, F., & Schaye, J. 2012, MNRAS, 423, 2991
- Vogelsberger et al. (2014) Vogelsberger, M., Genel, S., Springel, V., et al. 2014, MNRAS, 444, 1518
- Werk et al. (2013) Werk, J. K., Prochaska, J. X., Thom, C., et al. 2013, ApJS, 204, 17
- Werk et al. (2014) Werk, J. K., Prochaska, J. X., Tumlinson, J., et al. 2014, ApJ, 792, 8
- Werk et al. (2016) Werk, J. K., Prochaska, J. X., Cantalupo, S., et al. 2016, ApJ, 833, 54
- (1991) White, S. D. M., & Frenk, C. S. 1991, ApJ, 379, 52
- (2009a) Wiersma, R. P. C., Schaye, J., & Smith, B. D. 2009, MNRAS, 393, 99
- (2009b) Wiersma, R. P. C., Schaye, J., Theuns, T., Dalla Vecchia, C., & Tornatore, L. 2009, 399, 574
Appendix A Numerical convergence
The M6.2 MW halo sample is also shown in Figure 6 in green. The M6.2 resolution (equivalent to Ref-L100N1504) shows weaker O vi column densities (Oppenheimer et al., 2016), which was also seen in Rahmati et al. (2016). There are significant differences between the resolutions when examining their physical properties. As resolution decreases, increases and increases from to . Note that the gridding is coarser at lower resolution (§2.2), and that the inner radius we trust for the Euler terms is log and for M5.3 and M6.2, respectively.
The cumulative baryon plot in the lower right of Fig. 6 demonstrates increasing hot CGM masses within with resolution ( for M6.2 and for M5.3). This is a significant difference, and demonstrates in part the EAGLE “weak” resolution convergence strategy of altering the prescription (Ref vs. Recal) at different resolutions to attempt to reproduce the same galaxy properties (Schaye et al., 2015) can lead to other parameters being unconverged. Thermally heating winds with more mass per feedback event from M5.3 to M6.2 results in gas that travels further (more often outside ) and achieves greater angular momentum in the CGM leading to higher . However varies less between resolutions and is significantly enhanced by feedback no matter the resolution.
Feedback spins up hot haloes at both resolutions, but which is most correct for the CGM? We advocate the M5.3 zooms and results from the Recal-L025N0752 volume, because of their ability to reproduce a range of CGM observables, including X-ray properties that are sensitive to the hot baryon content of haloes, which is most obviously variable across resolutions. Whether this mass resolution has physical meaning for the mass scales of feedback-driven buoyant hot bubbles in the real Universe is still to be determined.