Exploring the 13CO/C18O abundance ratio towards Galactic young stellar objects and Hii regions
Abstract
Aims. Determining molecular abundance ratios is important not only for the study of the Galactic chemistry but also because they are useful to estimate physical parameters in a large variety of interstellar medium environments. The CO is one of the most important molecules to trace the molecular gas in the interstellar medium, and the 13CO/C18O abundance ratio is usually used to estimate molecular masses and densities of regions with moderate to high densities. Nowadays this kind of isotopes ratios are in general indirectly derived from elemental abundances ratios. We present the first 13CO/C18O abundance ratio study performed from CO isotopes observations towards a large sample of Galactic sources of different nature at different locations.
Methods. To study the 13CO/C18O abundance ratio it was used 12CO J=3–2 data obtained form the CO High-Resolution Survey, 13CO and C18O J=3–2 data from the 13CO/C18O (J=3–2) Heterodyne Inner Milky Way Plane Survey, and some complementary data extracted from the James Clerk Maxwell Telescope database. It was analyzed a sample of 198 sources composed by young stellar objects (YSOs), Hii and diffuse Hii regions as catalogued in the Red MSX Source Survey in and .
Results. Most of the analyzed sources are located in the galactocentric distance range 4.0–6.5 kpc. We found that YSOs have, in average, smaller 13CO/C18O abundance ratios than Hii and diffuse Hii regions. Taking into account that the gas associated with YSOs should be less affected by the radiation than in the case of the others sources, selective far-UV photodissociation of C18O is confirmed. The 13CO/C18O abundance ratios obtained in this work are systematically lower than the predicted from the known elemental abundance relations. These results would be useful in future studies of molecular gas related to YSOs and Hii regions based on the observation of these isotopes.
Key Words.
ISM: abundances – ISM: molecules – Galaxy: abundances – (ISM:) Hii regions – Stars: formation1 Introduction
Studying molecular abundances towards different Galactic sources and their association with the the surrounding interstellar medium is a very important issue in astrophysics. To study the chemical evolution of the Galaxy, and hence the physical processes related to the chemistry, is crucial to know accurate values of molecular abundances.
It is well known that the carbon monoxide is the second most abundant molecule in the universe, and the rotational transitions of 12C16O (commonly 12CO) are easily observable. Our knowledge of the molecular gas distribution along the Galaxy comes mainly from the observation of this molecular species and its isotopes, such as 13C16O (13CO) and 12C18O (C18O). It can be affirmed that any study involving molecular gas traced by the CO isotopes needs molecular abundance relations to derive physical and chemical parameters.
Wilson & Rood (1994) and Wilson (1999) presented one of the most complete and used works about interstellar abundances focused on chemical elements. Regarding to C and O, and hence to CO and its isotopes, most of the works in the literature that have to assume an abundance ratio concerning to the CO use the values from the Wilson’s papers. Wilson & Rood (1994) have shown that the 12C/13C and the 16O/18O ratios depend on the distance to the Galactic center. These relations were obtained mainly from H2CO absorption lines observations because, as the authors mention, direct measurements from the CO presented some problems such as a lack of surveys with a complete set of CO isotopes with good S/N ratio. Later, Milam et al. (2005) studied the 12C/13C ratio through the N = 1–0 transition of the CN radical and also found the same dependency with the galactocentric distance. Besides this dependency with the distance to the Galactic center, the isotope abundance ratios can present variations along the same molecular cloud. This is the case for the 12CO/13CO abundance ratio, which may vary considerably within the same molecular cloud due to chemical fractionation and isotope-selective chemical processes (see Szűcs et al. 2014 and references therein).
Concerning to the 13CO/C18O abundance ratio, early works of Dickman et al. (1979) and Langer et al. (1980) have shown spatial gradients from the edge to the center of molecular clouds. More recently, direct observations of 12CO, 13CO, and C18O lines have been used to determine abundance ratios and its relation with far-UV radiation towards different regions in molecular clouds (Lin et al. 2016; Kong et al. 2015; Shimajiri et al. 2014), showing that the 13CO/C18O abundance ratio may exhibit significant spatial variations. These kind of studies show that the abundance ratios can depend not only on galactocentric distances, but also on the type of the observed source and its surroundings. Hii regions and young stellar objects (YSOs) can be useful targets to study this issue because the molecular gas at their surroundings are affected by far-UV radiation, jets, winds and outflows. Studies towards a large sample of these objects using the CO J=3–2 line, which has a critical density 104 cm-3 and nowadays is extensively used to observe their surroundings, are needed.
It is important to mention that if one needs to assume some abundance ratio between molecular isotopes, the best would be to use a value that have been derived directly from the molecular species instead from the ratio between the elements that compose the molecules. In the case of the 13CO/C18O abundance ratio most of the works in the literature perform a double ratio from the Wilson’s 12C/13C and 16O/18O expressions, due to, as mention above, a lack of CO isotopes surveys with good S/N that cover large areas in the Galaxy.
At present there are some surveys of 12CO, 13CO and C18O J=3–2 with good S/N ratio that allow us to perform abundances estimates towards many sources of different nature in the Galaxy. We present here a study of the 13CO/C18O abundance ratio towards a large sample of YSOs and Hii regions in a region of about 20∘1∘ at the first Galactic quadrant. This is the first large survey of 13CO/C18O abundance ratios and it was performed with the aims of testing the known CO abundances relations using a modern data set, and to explore how the abundance ratios depends not only on the distance to the Galactic center but also on the type of source or region observed.


2 Data and sources selection
The data of the CO isotopes were extracted from two public databases performed with the 15 m James Clerck Maxwell Telescope (JCMT) in Hawaii. The 12CO J=3–2 data were obtained from the CO High-Resolution Survey (COHRS) with an angular and spectral resolution of 14′′ and 1 km s-1 (see Dempsey et al. 2013). The data of the other CO isotopes were obtained from the 13CO/C18O (J=3–2) Heterodyne Inner Milky Way Plane Survey (CHIMPS), which have an angular and spectral resolution of 15′′ and 0.5 km s-1 (Rigby et al. 2016). The intensities of both set of data are on the scale, and it was used the mean detector efficiency for the 12CO, and for the 13CO and C18O to convert to main beam brightness temperature (T) (Buckle et al. 2009).
Taking into account that the CHIMPS survey covers the Galactic region in and , we selected all sources catalogued as YSOs, Hii and diffuse Hii regions lying in this area from the Red MSX Source Survey (Lumsden et al. 2013), which is the largest statistically selected catalog of young massive protostars and Hii regions to date. Figure 1 shows the 198 sources among YSOs (blue crosses), Hii regions (red circles), and diffuse Hii regions (green circles). This source classification, and the separation from other kind of sources, was done by Lumsden et al. (2013) using several multiwavelength criteria. The authors combined near- and mid-infrared color criteria, analysis of spectral energy distributions, near-infrared spectroscopy, analysis of radio continuum fluxes and maser emission, and comparisons with other published lists of sources and catalogs to classify the sources. In addition, the morphology of the emission at different wavelengths was also analyzed. For example sources with stronger emission at 12 m than at either 8 m or 14 m are often extended and classified as diffuse Hii regions. Lumsden et al. (2013) remark that the final source classification was decided individually for every source. What it is important for our work is that the classification presented in the Red MSX Source Survey differentiates efficiently between two classes of stellar objects: the youngest (YSOs) and the more evolved (Hii regions). The ‘Hii region’ category can include ultracompact, compact, and point-like Hii regions, while the ‘diffuse Hii regions’ category refers to extended and likely more evolved Hii regions.
At the Galactic longitude range covered by CHIMPS the COHRS survey is restricted to Galactic latitudes of . Thus the 12CO data for sources lying in and were obtained from the JCMT database11 1 http://www.cadc-ccda.hia-iha.nrc-cnrc.gc.ca/en/jcmt/. In these cases it was used the reduced data.
The spectra of each isotope were extracted from the position of each catalogued source in the Red MSX Source Survey. Given that we need the emission from the three isotopes to obtain the 13CO and C18O column densities (N(13CO) and N(C18O)) and then the abundance ratio (XN(13CO)/N(C18O)), in the cases of sources that some isotope does not present emission above the noise level in the surveys, we checked in the JCMT database if there are observing programs around the source coordinate other than those used to perform the surveys. In the affirmative case we investigated these data in order to find the lacking spectra.
The data were visualized and analyzed with the Graphical Astronomy and Image Analysis Tool (GAIA)22 2 GAIA is a derivative of the Skycat catalogue and image display tool, developed as part of the VLT project at ESO. Skycat and GAIA are free software under the terms of the GNU copyright. and with tools from the Starlink software package (Currie et al. 2014) such as the Spectral Analysis Tool (Starlink SPLAT-VO). The typical rms noise levels of the spectra, in units of , are: 0.25, 0.35, and 0.40 K for the 12CO, 13CO, and C18O, respectively.
3 Results
From the sample of 198 sources lying in the analyzed region (see Fig. 1), we obtained spectra from the three CO isotopes in 114 cases. Table 1-at the end of the manuscript- presents the line parameters obtained from Gaussian fits to the spectra of each CO isotope, including also the velocity-integrated line emission in the case of 13CO and C18O. The assigned number, the source designation and its classification from the Red MSX Source Survey are included in Cols. 1, 2, and 3. For simplicity, errors are not included in the Table. In the case of the 12CO and 13CO the typical errors (the formal 1 value for the model of the Gaussian line shape) in Tmb are between 5 and 10 %, while the typical error in this parameter for the C18O ranges from 10 to 20 %. The integrated line emission has typical errors of 5–10 %, and 10–20 % for the 13CO and C18O, respectively. All the C18O, and most of the 13CO spectra, present only one component along the velocity axis, which represents the emission related to the catalogued source, defining in that way its central velocity (vLSR). In several cases this velocity could be checked with methanol and/or ammonia maser emission catalogued in the Red MSX Source Survey. When the 12CO spectrum of any source presents several velocity components, it was selected the one coinciding with the vLSR measured from the other isotopes.
Given that the galactocentric distance of the sources is an important parameter to take into account to study abundances (Wilson & Rood 1994), it is also included in Table 1-at the end of the manuscript- (Col. 4). Most of the sources have catalogued distances to us in the Red MSX Source Survey, which were used to estimate the corresponding galactocentric distance. In the cases that it is not included a distance in the Red MSX Source Survey, we derived it from the C18O central velocity (v) using the Galactic rotation model of Fich et al. (1989), obtaining a pair of possible distances to us (the nearest and farthest) due to the distance ambiguity in the first Galactic quadrant. Finally, using this pair of possible distances to us it was obtained the corresponding galactocentric distances, which in all cases, are almost the same independently if we use the nearest or farthest distances derived from the v. Thus, no ambiguity in the galactocentric distances appears in the studied sources. Most of the sources are located at galactocentric distances between 4.0 and 6.5 kpc, which taking into account the Galactic longitude range of the surveyed area, indicates that we are mainly studying sources in the Scutum-Crux and Sagitarius-Carina Galactic arms.

We estimated the column densities of 13CO and C18O on the assumption that the rotational levels of these molecules are in local thermodynamic equilibrium (LTE). The optical depths ( and ) and column densities (N(13CO) and N(C18O)) can be derived using the following equations:
| (1) |
| (2) |
with
| (3) |
| (4) |
| (5) |
with
| (6) |
The parameter is in the case of Eq. (3) and in Eq. (6). In all equations is the peak main brightness temperature obtained from Gaussian fits (see Table 1-at the end of the manuscript-) and the excitation temperature. Assuming that the 12CO J=3–2 emission is optical thick the was derived from:
| (7) |
where is the peak main brightness temperature obtained from the Gaussian fitting to the 12CO J=3–2 line. In cases that the 12CO emission appears self-absorbed, the central component of the spectrum was corrected for absorption (see Fig. 2) in order to obtain a value for . In those cases, it was used the best single Gaussian that fits the wings of the self-absorbed profile. This procedure was also applied in a few 13CO spectra that presented signatures of self-absorption. It is important to remark that the 13CO and C18O spectra were carefully inspected to look for signatures of saturation in the line which would generate an underestimation in some of its parameters. Besides the mentioned few cases of self-absorbed 13CO emission, we did not find any feature suggesting line saturation in the 13CO and C18O spectra. Line saturation is discussed in Sect. 4.1.
Table 2-at the end of the manuscript- presents the results obtained for each source: the source number, type, galactocentric distance, and the integrated line ratio (I) are presented in Cols. 1, 2, 3, and 4, respectively, and the Tex, , N(13CO), , N(C18O), and the abundance ratio X13/18 obtained from N(13CO)/N(C18O) are included in the others columns, respectively.


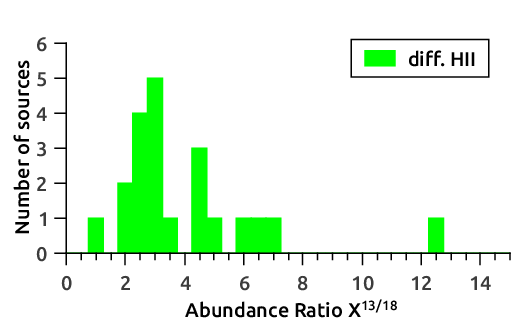
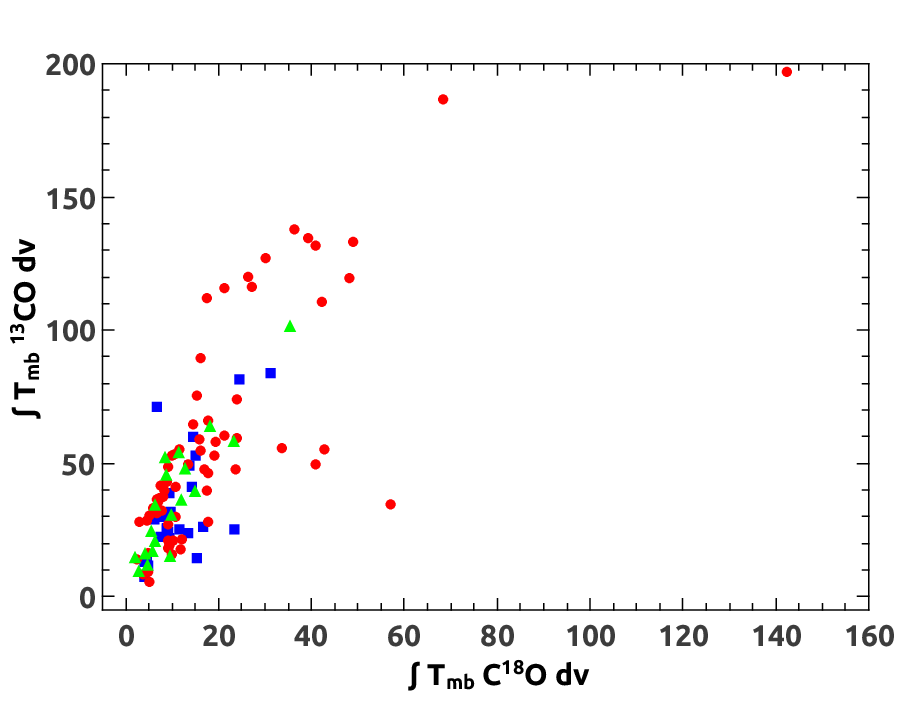
Figure 3 displays in histogram diagrams the number of sources vs. the abundance ratio (X13/18) for YSOs, Hii regions, and diffuse Hii regions, respectively. The width of the histograms bar is 0.5, thus, the height of the bar represents the amount of sources that have abundance ratios distributed from the center of the bar . Figure 4 shows the integrated line relation between the isotopes, i.e. I vs. I.
Table 1 presents the mean values of the abundance and integrated line ratios ( and ) for each kind of source together with the total number of sources composing each sample (N). Values between brackets are the results obtained after removing the outliers points of each sample (see the bars totally detached from the main distribution in Fig. 3).
Figure 5 displays the obtained abundance ratio for each source vs. the C18O column density. Figure 6 displays the abundance ratio X13/18 vs. the integrated line ratio I13/18, which shows good linear relations. The results from linear fittings for each kind of source are presented in Table 2. It is also included the factor obtained from each fitting. As in Table 1, between brackets it is presented the results obtained after removing the above mentioned outliers points. These points are: (X13/18, I13/18) (14.3, 10.8) for a YSO, (9.8, 10.5) for an Hii region, and (12.7, 12.3) for a diffuse Hii region.
| N | |||
|---|---|---|---|
| YSO | 26 | 3.13 (2.68) | 3.27 (2.97) |
| Hii | 67 | 3.68 (3.59) | 3.65 (3.55) |
| diffuse Hii | 21 | 4.09 (3.66) | 4.36 (3.96) |
| Note: Values between brackets are the results obtained | |||
| after removing the outliers points of each sample. | |||
| YSO | 1.330.05 (0.980.04) | 1.240.19 (0.250.15) | 0.96 (0.94) |
|---|---|---|---|
| Hii | 1.050.05 (1.100.05) | 0.170.20 (0.320.22) | 0.87 (0.84) |
| Diffuse Hii | 1.040.04 (0.970.07) | 0.430.24 (0.200.30) | 0.95 (0.89) |
| Note: Values between brackets are the results obtained after removing the outliers | |||
| points of each sample. | |||


4 Discussion
Taking into account that the molecular gas related to YSOs should be less affected by the UV radiation than the gas associated with Hii regions, from the analysis of the 13CO/C18O abundance ratios X13/18 obtained towards the 114 studied sources, as a first result, it can be suggested that the X13/18 increases as the degree of UV radiation increases. It is important to note that it is likely that the molecular gas related to some sources catalogued as YSOs can be affected by the UV radiation. These sources could be located at the borders of extended Hii regions, and/or they may be transiting the last stages of star formation and have begun to ionize their surroundings. However, we consider that the gas associated with most of them should be less affected by the radiation than in the case of sources catalogued as Hii and diffuse Hii regions. This phenomenon is indeed reflected in our analysis. Figure 3 shows that YSOs tend to have smaller X13/18 values than the other type of sources, which can be also appreciated by comparing the mean values presented in Table 1. This result is in agreement with what it is observed in different regions of molecular clouds that are affected by far-UV radiation, such as the Orion-A giant molecular cloud (Shimajiri et al. 2014), and what it is predicted from photodissociation models (Visser et al. 2009; van Dishoeck & Black 1988). Thus, we confirm, through a large sample of sources, that selective far-UV photodissociation of C18O indeed occurs. Moreover, as Fig. 5 shows, the X13/18 ratio decreases with the increasing C18O column density in all sources, which suggests that this phenomenon occurs even considering each group of source separately.
The relation between the isotopes integrated line (I13 vs. I18, see Fig. 4) shows slight differences between the kind of source. This is also reflected in the relation between the abundance and the integrated line ratios (Fig. 6), which is an interesting relation because it compares values that were derived from excitation considerations (LTE assumption) with values that are direct measurements. These relations show that the 13CO/C18O abundance ratio could be estimated directly from the integrated line ratios, as it can be appreciated by comparing the values presented in Table 1.
4.1 Saturation of the J=3–2 line
It is known that a linear molecule may increase its opacity with the increasement of the J rotational level until reaching a J maximum (Jmax), for which the optical depth exhibits a peak (Goldsmith & Langer 1999). The Jmax depends on the temperature and the molecule rotational constant. Thus, depending on the temperature of the region, it is possible that the CO J=3–2 line can suffer more saturation than the lower transitions, and hence a quantitative comparison of the abundance ratio with previous results obtained from the J=2–1 and 1–0 lines should be done with caution.
Wouterloot et al. (2008) measured the 13CO/C18O integrated intensity ratio (I13/18) using the J=1–0 and J=2–1 line towards some Galactic star forming and Hii regions, and suggested that saturation can be more pronounced in the J=2–1 transition. We compare our 13CO/C18O integrated intensity ratios with those obtained by Wouterloot et al. (2008) (see their Fig. 3) in the galactocentric distance range (4–8 kpc). We find that they do not present large discrepancies. Our results are very similar to those obtained from the J=2–1 line in Wouterloot et al. (2008), suggesting that the saturation does not increase considerably from J=2–1 to J=3–2 in this kind of sources, and moreover, in some cases it is comparable even with the obtained from the J=1–0 line.
Thus, taking into account that the 13CO and C18O spectra do not present any signature of line saturation, almost all , and all values are lower than unity (see Table 2-at the end of the manuscript), and our 13CO/C18O integrated intensity ratios are in good agreement with those obtained from the J=2–1 and 1–0 lines in a previous work towards similar sources, we conclude that line saturation should not be an important issue in our analysis.
4.2 Abundance ratio and the distance
Given that the elemental abundance ratios 12C/13C, 16O/18O, between others, presented in Wilson & Rood (1994) are largely used in the literature when CO data are studied, we compare our results with them. The abundance relations presented in Wilson & Rood (1994) are:
| (8) | |||
| (9) |
where DGC is the galactocentric distance. Thus, to assume a 13CO/C18O abundance ratio one must to perform a double ratio between the above expressions, yielding:
| (10) |
Figure 7 displays the abundance ratio X13/18 vs. galactocentric distance for the sources analyzed in this work. The black curve is the plot of Eq. 10, which shows that the mean value of the X13/18 ratio is between 7 and 8 for the whole galactocentric distance range. The dashed curves are the result of plotting this equation considering the errors bars. These curves delimit a region where, according to Wilson & Rood (1994), the sources should lie.

The analyzed sources lie mainly in the galactocentric distance range 4.0–6.5 kpc, and a few has farther distances, around 8 kpc. Thus our analysis lack of information concerning to the molecular gas lying within a radius of 4 kpc from the Galactic center. From Fig. 7 it can be appreciated that almost all the abundance ratio values of our complete sample are lower than the mean value predicted by Wilson & Rood (1994), and moreover, there are many values lying under the lower limit from Eq. 10 (bottom dashed curve in Fig. 7). This suggests that the 13CO/C18O abundance ratio derived from the double ratio between 12C/13C and 16O/18O could overestimate the actual value.
5 Summary and concluding remarks
Using the 12CO, 13CO, and C18O J=3–2 emission obtained from the COHRS and CHIMPS surveys performed with the JCMT telescope and using additional data from the telescope database, we studied the 13CO/C18O abundance ratio towards a large sample of YSOs and Hii regions located in the first Galactic quadrant.
From the statistical analysis of the X13/18 ratio we found that YSOs have, in average, smaller values than Hii and diffuse Hii regions. Taking into account that the gas associated with YSOs should be less affected by the radiation than in the case of Hii and diffuse Hii regions, we can confirm the selective far-UV photodissociation of C18O as it was observed in previous works towards particular molecular clouds and as it was predicted by models. Additionally, it was found a linear relation between the abundance ratios and the integrated line ratios (I13/18), suggesting that the 13CO/C18O abundance ratio could be estimated directly from I13/18.
Most of the sources are located in the galactocentric distance range 4.0–6.5 kpc, which indicates that we are mainly studying sources in the Scutum-Crux and Sagitarius-Carina Galactic arms. A few sources are located so far as 8 kpc. Thus our analysis lack of information concerning to the molecular gas lying within a radius of 4 kpc from the Galactic center. Extension of the used surveys, or others 12CO, 13CO, and C18O surveys covering the inner Galaxy would be useful to complete this study. From the covered galactocentric distance range it was shown that the 13CO/C18O abundance ratios obtained directly from the molecular emission are lower than if they are derived from the known elemental abundances relations.
Finally, it is important to mention that this is the first 13CO/C18O abundance ratio study obtained directly from CO observations towards a large sample of sources of different nature at different locations. Thus, the 13CO/C18O abundance ratios derived in this work would be useful for future studies of molecular gas associated with YSOs and Hii regions based on the observation of these isotopes.


Acknowledgments
We thank the anonymous referee for her/his helpful comments and suggestions. M.B.A. and M.C.P. are doctoral fellows of CONICET, Argentina. S.P. and M.O. are members of the Carrera del Investigador Científico of CONICET, Argentina. This work was partially supported by Argentina grants awarded by UBA (UBACyT), CONICET and ANPCYT.
References
- Buckle et al. (2009) Buckle, J. V., Hills, R. E., Smith, H., et al. 2009, MNRAS, 399, 1026
- Currie et al. (2014) Currie, M. J., Berry, D. S., Jenness, T., et al. 2014, in Astronomical Society of the Pacific Conference Series, Vol. 485, Astronomical Data Analysis Software and Systems XXIII, ed. N. Manset & P. Forshay, 391
- Dempsey et al. (2013) Dempsey, J. T., Thomas, H. S., & Currie, M. J. 2013, ApJS, 209, 8
- Dickman et al. (1979) Dickman, R. L., McCutcheon, W. H., & Shuter, W. L. H. 1979, ApJ, 234, 100
- Fich et al. (1989) Fich, M., Blitz, L., & Stark, A. A. 1989, ApJ, 342, 272
- Goldsmith & Langer (1999) Goldsmith, P. F. & Langer, W. D. 1999, ApJ, 517, 209
- Kong et al. (2015) Kong, S., Lada, C. J., Lada, E. A., et al. 2015, ApJ, 805, 58
- Langer et al. (1980) Langer, W. D., Goldsmith, P. F., Carlson, E. R., & Wilson, R. W. 1980, ApJ, 235, L39
- Lin et al. (2016) Lin, S.-J., Shimajiri, Y., Hara, C., et al. 2016, ApJ, 826, 193
- Lumsden et al. (2013) Lumsden, S. L., Hoare, M. G., Urquhart, J. S., et al. 2013, ApJS, 208, 11
- Milam et al. (2005) Milam, S. N., Savage, C., Brewster, M. A., Ziurys, L. M., & Wyckoff, S. 2005, ApJ, 634, 1126
- Rigby et al. (2016) Rigby, A. J., Moore, T. J. T., Plume, R., et al. 2016, MNRAS, 456, 2885
- Shimajiri et al. (2014) Shimajiri, Y., Kitamura, Y., Saito, M., et al. 2014, A&A, 564, A68
- Szűcs et al. (2014) Szűcs, L., Glover, S. C. O., & Klessen, R. S. 2014, MNRAS, 445, 4055
- van Dishoeck & Black (1988) van Dishoeck, E. F. & Black, J. H. 1988, ApJ, 334, 771
- Visser et al. (2009) Visser, R., van Dishoeck, E. F., & Black, J. H. 2009, A&A, 503, 323
- Wilson (1999) Wilson, T. L. 1999, Reports on Progress in Physics, 62, 143
- Wilson & Rood (1994) Wilson, T. L. & Rood, R. 1994, ARA&A, 32, 191
- Wouterloot et al. (2008) Wouterloot, J. G. A., Henkel, C., Brand, J., & Davis, G. R. 2008, A&A, 487, 237