Synthesis and electronic properties of Ruddlesden-Popper strontium iridate epitaxial thin films stabilized by control of growth kinetics
Abstract
We report on the selective fabrication of high-quality Sr2IrO4 and SrIrO3 epitaxial thin films from a single polycrystalline Sr2IrO4 target by pulsed laser deposition. Using a combination of X-ray diffraction and photoemission spectroscopy characterizations, we discover that within a relatively narrow range of substrate temperature, the oxygen partial pressure plays a critical role in the cation stoichiometric ratio of the films, and triggers the stabilization of different Ruddlesden-Popper (RP) phases. Resonant X-ray absorption spectroscopy measurements taken at the Ir -edge and the O -edge demonstrate the presence of strong spin-orbit coupling, and reveal the electronic and orbital structures of both compounds. These results suggest that in addition to the conventional thermodynamics consideration, higher members of the Srn+1IrnO3n+1 series can possibly be achieved by kinetic control away from the thermodynamic limit. These findings offer a new approach to the synthesis of ultra-thin films of the RP series of iridates and can be extended to other complex oxides with layered structure.
I Introduction
In recent years, 5 transition metal oxides have attracted a tremendous research interest due to the comparable strength of the on-site electron-electron correlations and the spin-orbit coupling (SOC) , which can give rise to a plethora of exotic quantum states of matter including topological insulator, quantum spin liquid, Weyl semimetals, spin-orbit Mott insulator, etc.[1, 2] A prototypical example is the Ruddlesden-Popper (RP) series (Srn+1IrnO = 1, 2, , ) of iridium oxides (Ir4+, 5), where the electronic structure exhibits distinct variations as a function of , which is effectively controlled by the dimensionality of these compounds.[3] On one hand, in layered perovskite Sr2IrO4 ( = 1), the t2g band is split by the strong SOC, leading to the formation of and subbands. A modest further opens a gap and splits the narrow band into upper Hubbard band (UHB) and lower Hubbard band (LHB), giving rise to a unique spin-orbit entangled Mott insulating ground state with antiferromagnetic long range ordering.[4, 5] Moreover, in view of its close similarity to cuprates in both the structure and the electronic behaviors [6, 7, 8, 9], doped Sr2IrO4 has been regarded as a promising platform to realize high-temperature superconducting iridates.[10, 11, 12] On the other hand, for the perovskite SrIrO3 ( = ), the increased Ir 5 bandwidth , together with comparable in the magnitude and , eventually prevents a Mott gap opening and results in an intriguing correlated semi-metallic ground state [3, 13]; Based on this consideration theorists have predicted the formation of artificial topological insulating phases.[14, 15, 16]
Lately, to exploit the possibility of novel emergent phenomena caused by the pronounced SOC effect, active fabrication efforts for Sr2IrO4 (Sr214) and SrIrO3 (Sr113) epitaxial thin films, superlattices, and heterostructures have been put forward [17, 18, 19, 20, 21, 22, 23, 24, 25, 26, 27, 28, 29, 30, 31, 32, 33, 34, 35, 36, 37]. Among those, the majority of the films were synthesized by pulsed laser deposition (PLD) in which the proper stoichiometry of the film is typically achieved from a chemically equivalent target. Very recently, however, it was noticed that off-stoichiometry can occur when using either SrIrO3 and Sr2IrO4 target as the source [33, 34]. Due to the highly non-equilibrium nature of the ablation process, the kinetics of the RP Srn+1IrnO3n+1 epitaxial growth such as plume propagation or crystallization at substrate surface has been thus far little explored.
In this paper, we demonstrate that in addition to the conventional thermodynamic considerations, a selective fabrication of different Srn+1IrnO3n+1 () epitaxial films can be achieved from a single Sr214 target by virtue of the kinetic nature of PLD. A combination of X-ray diffraction and d.c. transport measurements confirm the formation of both proper chemical composition and excellent structural quality of the samples. By systematically varying the oxygen partial partial P and the substrate temperature , we find that the oxygen partial pressure plays a decisive role in the cation stoichiometric ratio of the film leading to the stabilization of various RP phases, and the proper substrate temperature mainly enables the persistent two-dimensional (2D) growth mode. Synchrotron based X-ray absorption measurements at Ir -edge indicate large expectation values of the spin-orbit coupling for both compounds. Polarization-dependent absorption spectra taken at O -edge reveal the presence of an expected strong hybridization between Ir 5 and O 2 states within each film.
II Experiments
The basic unit cell of Sr214 and Sr113 are shown in Fig. 1. As seen, for the starting member Sr214 (), where integer refers to the number of the perovskite blocks sandwiched between the extra rock-salt SrO layers, the network of the corner-sharing IrO6 octahedra persist two dimensionally in the plane and is essentially disrupted along the axis. The tilts and rotations of the IrO6 octahedra further expand the unit cell by along three axes, leading to the tetragonal crystal structure. In contrast, for the end-member Sr113 () the corner-sharing IrO6 octahedra are connected three dimensionally with tilts and rotations along each axis, giving rise to a perovskite structure with orthorhombic space group. It is important to note that under ambient pressure Sr113 crystalizes into a monoclinic 6M rather than perovskite structure.[38] Therefore high pressure environment or epitaxial compressive strain is needed for stabilizing the proper perovskite phase.
The strontium iridate Srn+1IrnO3n+1 () thin films were grown on (001) SrTiO3 (STO) substrates, by varying the oxygen partial pressure , and the substrate temperature , from 10-6 to 10-1 Torr, and from 550∘C to 700 ∘C, respectively. The detailed lattice parameters of bulk Sr214, Sr113, and STO are given in Table I. During the growth, a single stoichiometric Sr214 polycrystalline target was used as the ablation source for all reported samples. The fluence and the repetition rate of the KrF excimer laser ( nm) were fixed at about 2 J/cm2 and 2 Hz, respectively. The substrate-to-target distance was set at 60 mm. To explore the growth kinetics the entire deposition process was monitored by in-situ high-pressure reflection-high-energy-electron-diffraction (HP RHEED). After growth, samples were cooled down to room temperature at a rate of 15 ∘C/min.

The chemical composition of the films was investigated by X-ray photoelectron spectroscopy (XPS). The measurements were carried out in a Thermo Scientific X-ray Photoelectron Spectrometer System equipped with a hemispherical analyzer and a monochromatic Al Kα source. The photoelectrons were collected in a surface normal geometry in order to increase the bulk sensitivity. The spectra were calibrated using C 1 spectra with binding energy close to 284.6 eV. Decomposition of each spectrum was performed with the casaXPS software using Gaussian-Lorentz line profiles. Structural properties of the samples were characterized by high resolution X-ray diffraction (XRD) and reciprocal space mapping (RSM) measurements using a PANalytical Material Research Diffractometer (Cu Kα1 line, = 1.5406 Å). The d.c. electrical transport properties were performed with a Physical Property Measurement System (PPMS, Quantum Design) in the Van der Pauw geometry. The X-ray absorption spectra (XAS) on Ir edges were performed at beamline 4-ID-D of the Advanced Photon Source in Argonne National Laboratory. Data were collected using a helicity modulation technique at 10 K and recorded in the fluorescence yield (FY) detection mode. In addition, the O -edge polarization dependent XAS were measured at beamline 4.0.2 of the Advanced Light Source in Lawrence Berkeley National Laboratory. Those data were collected in the total electron yield (TEY) detection mode at 300 K.
| Material | (Å) | (Å) | (Å) | (Å) | (Å) | (%) |
|---|---|---|---|---|---|---|
| Sr2IrO4 | 5.49 | 5.49 | 25.78 | 3.88 | 12.89 | +0.52% |
| SrIrO3 | 5.60 | 5.58 | 7.89 | 3.95 | 3.95 | -1.26% |
| SrTiO3 | 3.90 | 3.90 | 3.90 |
III Results and Discussion
III.1 Synthesis


To obtain microscopic insight into the phase formation, a set of in-situ RHEED and ex-situ XPS measurements was taken on four films grown at different oxygen pressure () and substrate temperature (). As shown in Fig. 2, the growth conditions of the single phase Sr214 [sample ()] and Sr113 [sample ()] were optimized at Torr, C, and Torr, C, respectively. The RHEED streaks (specular and off-specular) are clearly seen and well distributed around the Laue rings from all films with distinct Kikuchi lines, indicative of flat surface and high crystallinity of the samples. The oscillation and recovery of the RHEED intensity further establish the presence of the 2D growth mode for each film. In particular, the two faint spots shown on sample (iv) indicate that the SrIrO3 film possesses the c-Pbnm phase [39]. However, three-dimensional (3D) growth appears for Torr, C [sample ()], or Torr, C [sample ()], as evidenced by the electron transmission-like RHEED patterns [40].
Next, we investigate the charge states and stoichiometry of the films by XPS. First, since chemical reactions of Sr with CO2 or H2O on surface of the films can easily take place, the Sr 3 spectra contain contributions from SrO/SrCO3/Sr(OH)2 secondary phases [41]. Those contributions are found in all samples and expressed by the blue line at 133.5 eV for 3 and 135.3 eV for 3. In addition, the component at lower binding energy shown as green line at 132.3 eV for 3 and 134.1 eV for 3 is attributed to the chemically distinct Sr species located beneath the surface, thus reflecting the information from the RP phases [41]. Note, as shown on Fig. 3 left panel, the Sr 3 spectrum of the sample (i) is well described by single component from SrO/SrCO3/Sr(OH)2, indicating that no RP phase forms at this growth condition and the obtained 3D islands likely constitute of thermodynamically stable SrO or Sr(OH)- clusters. [42] In sharp contrast, the spectra of the samples (ii) – (iv) contain components from both the SrO/SrCO3/Sr(OH)2 and the RP phases. In particular, in the case of the 2D Sr214 (ii) and Sr113 (iv) films, the relative intensity of the impurity peak is rather weak implying that the thickness of the secondary phases of only a few Å at the surface region. However, for sample (iii) the relative intensity of the impurity peak becomes much stronger compared to the RP samples, implying a large increase in the formation of SrO clusters on top of the RP layers during the initial stage of deposition.
Moreover, each of the Ir 4 spectrum exhibits distinctly asymmetric spectral features which have been decomposed in two components, with one relatively intense doublet and one relatively weak doublet, as shown on the right panel of Fig. 3. The intense doublet (orange line) represents the spin-orbit splitting peaks (i.e. Ir 4 and Ir 4).[43] Interestingly, each Ir 4 spectrum also contains two additional broad peaks (violet line) at higher binding energy with identical spin-orbit strength (peak splitting of 3.1 eV). The appearance of such additional broad features can be assigned to either the emergence of two different final states, i.e. screened and un-screened core holes [44, 45] or the existence of plasmon satellites in the higher binding energy range [46, 47]. According to the Kotani model [48], for narrow band metals the core hole generated in the photoemission process interacts with conduction carriers and thereby creates two different (screened and un-screened) final sates. On the other hand, plasmonic satellites always appear at higher binding energy and becomes broadened by conduction electron scattering; In general, the intensity of the plasmonic satellite increases with decreasing electron density. In our samples, the presence of plasmonic satellite is more likely since intensity of the satellite is significantly higher for insulating Sr214 compared to semi-metallic Sr113.
The spin-orbit doublet of sample (i) at 60.8 eV for Ir 4 and 63.9 eV for Ir 4 correspond to Ir0 valence state [49, 50], indicating that the film is mostly composed of clusters of unoxidized Ir metals. However, the spectra of sample (ii) – (iv) all exhibit doublet peaks at 62.1 eV for Ir 4 and 65.2 eV for Ir 4, confirming the formation of Ir4+ as a result of oxidation by the excess oxygen background, which is consistent with the observations from Sr 3 spectra. In addition, the resultant Sr/Ir intensity ratio is calculated to be 1.8 and 1.2 for Sr214 and Sr113, respectively. The small deviation from the ideal stoichiometric ratio is likely due to the error induced during background subtraction. This ratio confirms the expected chemical composition of each film. Surprisingly, the Sr/Ir ratio for the samples with 3D growth is found to be 4.5 for sample (i) and 3.5 for sample (iii) implying a substantial excess of Sr in those samples.
In order to link the observed unusual phenomena to the underlying growth mechanism, we consider several distinct stages of the deposition process. First, we note that because of a high laser fluence of 2 J/cm2, the preferential ablation of various species is likely eliminated [33]. Therefore we can attribute the issues of stoichiometry and growth mode to the next two stages of the PLD process, namely, to the dynamics of plume propagation and the initial stage of nucleation on the substrate surface. It has been generally recognized that during the PLD growth of multicomponent oxide thin films, the background gas pressure can induce significant variations of the angular distribution of different species in the plume, which in turn results in off-stoichiometry of films with respect to the chemical composition of a target. [51, 52, 53, 54, 55] More specifically, in nearly vacuum, the plume is primarily composed of elemental atomic/ionic species. Compared to heavier ions, lighter species tend to propagate with higher velocity and hence a narrower angular distribution towards the substrate normal.[51, 52] This corresponds to the case of sample (), where the concentration of the lighter Sr related species exceeds the concentration of Ir species at the forefront part of the plume, thus resulting in a Sr enriched phase on the substrate. Furthermore, this regime results in a 3D growth mode due to the reduced surface mobility of the adatoms compared to the large kinetic energy of the subsequently arriving species from the plume. The increasing amount of allows the plume species to be gradually oxidized and broadens the plume angular distribution. [51, 52, 53, 54, 55, 56, 57]. In particular, under an intermediate background pressure (sample (), 10-3 Torr), this broadening effect for lighter species is more pronounced compared to the heavier ones. As a result, the stoichiometry of the plume front becomes commensurate with that of target.[51] Furthermore, under high background pressure (sample () Torr), lighter species are likely to experience back-scattering by background oxygen. [51, 58, 59, 29]; Eventually a crossover to the regime where the angular distribution of lighter species is broader than that of the heavier ones takes place. This mechanism gives rise to the formation of a Ir-rich phase in the film. In each described case, the adatoms gain sufficient mobility determined primarily by to propagate and nucleate before the arrival of subsequent species; this condition leads to the desired 2D or layer-by-layer growth mode. It is worth noting that if is set at 10-3 Torr and reduces down to 600 ∘C (i.e. moving from sample (ii) to sample (iii)), the Sr-enriched phase emerges again. Interestingly, similar phenomena were also observed during the PLD growth of perovskite manganite and titanite thin films [56, 51, 60], where it was found that can effectively tune the shape and concentration of species within the plume. Specifically lowering will make the lighter species redistribute preferentially toward the plume front with faster velocity, while the heavier ones largely remain at the tail. In analogy, the distribution of Sr and Ir species in this case is similar to that of (i), leading to the formation of a Sr-enriched phase. These analysis are depicted as the insets of Fig. 3.
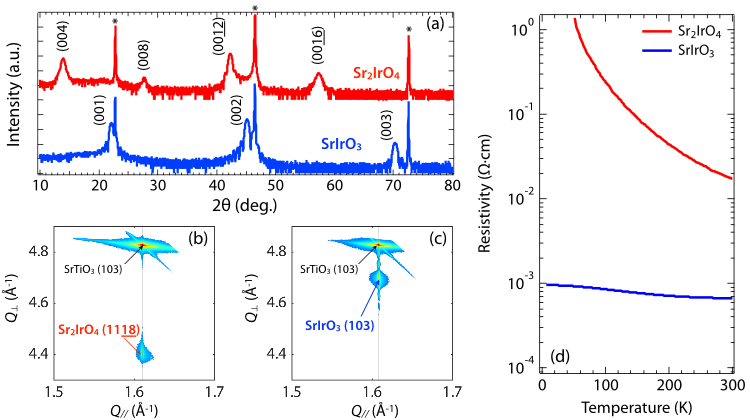
Fig. 4(a) presents the high resolution XRD 2- scans for both Sr214 and Sr113 thin films deposited under the optimized conditions specifically for each material. The exclusive presence of peaks for Sr214 [61] and peaks for Sr113 unambiguously confirms that single crystal phases of Sr214 and Sr113 are indeed stabilized without any secondary chemical phases within the resolution of XRD. Both films are about 20 nm thin, as evidenced from the interval between consecutive Kessig fringes around the film peaks. The extracted from the data out-of-plane lattice parameter is 4.01 Å for Sr113 (under compressive strain of -1.26%) and 25.63 Å for Sr214 (under tensile strain of +0.52%), respectively. These values deviate only slightly from their bulk values given in Table I and are perfectly consistent with the expected strain effect induced by the epitaxy with STO substrate. To investigate the epitaxial relationship and strain, reciprocal space mapping (RSM) was performed for both samples. As shown in Fig.s 4(b) and 4(c), the RSMs around the STO asymmetric (103) reflections corroborate with the materials phase identified for each film: namely, the presence of the (103) reflection for the Sr113 film confirms the perovskite structure, while the observed (1118) reflection for Sr214 provides a strong evidence for the layered perovskite K2NiF4-type structure with -axis oriented out of the sample surface [20]. Moreover, both films are coherently strained to the substrate with no detectable strain relaxation as evidenced by the identical with STO substrate in-plane values. As the result, the axial ratios for Sr113 and 3.28 for Sr214 are very close to the reported results grown with separate stoichiometric targets [17, 23, 19].
III.2 Electronic properties
Next we turn our attention to the electronic properties of each single-phase sample. The temperature-dependent resistivity of both samples was measured from 300 K down to 5 K, and is displayed in Fig. 4(d). In close correspondence with the recently reported results for Srn+1IrnO3n+1 epitaxial thin films, the Sr214 sample exhibits a strongly insulating behavior down to the base temperature, whereas the overall resistivity of Sr113 sample barely changes and remains rather low ( 800 cm) in the whole temperature range indicative of a semi-metallic behavior.[30] The estimated activation band gap at 300 K is approximately 120 meV for Sr214, smaller than the bulk value 200 meV [62] due to the strain effect [19].

Given the proposed importance of the SOC effect for the layered iridate compounds, we carried out the XAS measurements on Ir edge shown in Fig. 5. We recall that the branching ratio is a measure of the SOC and represents the integrated white line intensity at each absorption edge. The obtained values are 4.9(7) for Sr214, and 4.6(8) for Sr113. Note, those numbers are more than twice as much as the statistical 2 indicating the presence of a very strong SO interaction in the iridate thin films.[63] Moreover, according to the branching ratio analysis, the expectation value of the SOC operator is directly related to the value of via , where and refers to the number of 5 holes.[64] Taking 5 for both films yeilds for Sr214 and 2.3(6) for Sr113. These values agree very well with the reported result for the bulk compounds [65, 66] thus implying the formation of the spin-orbit entangled electronic ground state(see inset in Fig. 5).

In addition, more information about the Ir 5 – O 2 hybridization can be obtained by measuring the polarization dependent XAS at the O -edge of each single phase film. The relative geometry of the polarization vector with respect to the film orientation is displayed in Fig. 6(a). In general, with linearly polarized X-rays, one can search for the valence holes, and the polarization dependence of the XAS intensity is primarily determined by the orientation of the hole-carrying orbitals. In our case, by selectively probing the holes on different oxygen 2 orbitals (i.e. , , ) that are strongly hybridized with Ir 5 states, we can deduce the distribution of holes on the Ir 5 orbitals. As previously shown for the layered perovskite compounds [67], due to the local tetrahedral distortion, the Ir and orbitals can only hybridize with orbitals from the four in-plane oxygens while the Ir orbitals can only hybridize with orbitals from the two apical oxygens. The remaining orbitals are allowed to hybridize with both apical oxygen and in-plane oxygen orbitals.[67, 68] Following this scenario, the weak peak at 528.3 eV of Sr214 in Fig. 6(b) is a signature of the apical O – Ir bonding state, as is only probed with in-plane polarized X-rays. The much more profound peak at 529.1 eV represents the bondings between in-plane O and Ir . In particular, the XAS intensity from out-of-plane polarization is about twice as large as that from in-plane polarization, which is a hallmark of the equal orbital population () contributed to the ground state.[4] Furthermore, the features between 530 eV and 535 eV are due to the transitions from O levels that are hybridized with Ir 5 states. On the other hand, for Sr113 only one distinct peak appears at 528.8 eV in the pre-edge region with the broad Ir 5 – O states seen between 529.5 eV and 534.5 eV. Compared to Sr214, the tetragonal distortion is significantly suppressed in Sr113, effectively lowering the energy levels and intermixing the J with J states, so that the distribution of holes at each orbital composition becomes .[69] Again, as shown in Fig. 6(b) for Sr113 sample this observation is consistent with the slightly larger XAS intensity from out-of-plane polarization than that from in-plane.
IV Conclusion
In summary, we have demonstrated the selective synthesis of high-quality single phase Sr214 and Sr113 epitaxial thin films of the RP series from a single polycrystalline Sr2IrO4 target. Additionally, we revealed that the oxygen partial pressure plays a decisive role in the cation stoichiometric ratio of the film, while the substrate temperature must be manipulated accordingly to maintain the 2D growth mode. Branching ratio analysis of the XAS results at Ir -edge confirm the large SOC in both films. Polarization dependence of the absorption spectra at O -edge further elucidate the Ir 5 – O 2 hybridization in each single phase film. Our findings provide valuable insight into the growth mechanism of Srn+1IrnO3n+1 films at non-equilibrium conditions, and pave another way for the fabrications of a variety of RP phases by kinetic control.
V Acknowledgements
The authors deeply acknowledge Jaewook Kim and Mike Hawkridge for their assistance on electrical transport and X-ray diffraction measurements, respectively. X.L. also thank Heung-sik Kim for fruitful discussions. X.L., Y.C. and J.C. were supported by the Gordon and Betty Moore Foundation’s EPiQS Initiative through Grant GBMF4534, and by the Department of Energy under grant DE-SC0012375. This research used resources of the Advanced Light Source, which is a Department of Energy Office of Science User Facility under Contract No. DE-AC0205CH11231. This research used resources of the Advanced Photon Source, a U.S. Department of Energy Office of Science User Facility operated by Argonne National Laboratory under Contract No. DE-AC02-06CH11357.
References
- [1] W. Witczak-Krempa, G. Chen, Y. Kim, and L. Balents, Annu. Rev. Condens. Matter Phys. 5, 57-82 (2014).
- [2] R. Schaffer, E. Lee, B. Yang, and Y. Kim, Rep. Prog. Phys. 79, 094504 (2016).
- [3] S. J. Moon et al., Phys. Rev. Lett. 101, 226402 (2008).
- [4] B. J. Kim et al., Phys. Rev. Lett. 101, 076402 (2008).
- [5] B. J. Kim, H. Ohsumi, T. Komesu, S. Sakai, T. Morita, H. Takagi, T. Arima, Science 323, 1329 (2009).
- [6] J. Kim et al., Phys. Rev. Lett. 108, 177003 (2012).
- [7] Y. K. Kim, N. H. Sung, J. D. Denlinger, and B. J. Kim, Nat. Phys. 12, 37-41 (2016).
- [8] L. Zhao, D. H. Torchinsky, H. Chu, V. Ivanov, R. Lifshitz, R. Flint, T. Qi, G. Cao, and D. Hsieh, Nat. Phys. 12, 32-36 (2016).
- [9] Y. J. Yan et al., Phys. Rev. X 5, 041018 (2015).
- [10] F. Wang and T. Senthil, Phys. Rev. Lett. 106, 136402 (2011).
- [11] H. Watanabe, T. Shirakawa, and S. Yunoki, Phys. Rev. Lett. 110, 027002 (2013).
- [12] Z. Y. Meng, Y. B. Kim, and H.-Y. Kee, Phys. Rev. Lett. 113, 177003 (2014).
- [13] M. Ahsan Zeb, and H. Kee, Phys. Rev. B 86, 085149 (2012).
- [14] D. Xiao et al., Nature Commun. 2, 596 (2011).
- [15] J.-M. Carter, V. Vijay Shankar, M. Ahsan Zeb, and H.-Y Kee, Phys. Rev. B 85, 115105 (2012).
- [16] Y. Chen, Y.-M. Lu, and H.-Y. Kee, Nature Commun. 6, 6593 (2015).
- [17] J. Liu et al., arXiv:1305.1732v1.
- [18] J. S. Lee, Y. Krockenberger, K. S. Takahashi, M. Kawasaki, and Y. Tokura, Phys. Rev. B 85, 035101 (2012).
- [19] C. Rayan Serrao et al., Phys. Rev. B 87, 085121 (2013).
- [20] J. Nichlos, J. Terzic, E. G. Bittle, O. B. Korneta, L. E. De Long, J. W. Brill, G. Cao, and S. S. A. Seo, Appl. Phys. Lett. 102, 141908 (2013).
- [21] J. Nichlos, O. B. Korneta, J. Terzic, L. E. De Long, G. Cao, J. W. Brill, and S. S. A. Seo, Appl. Phys. Lett. 103, 131910 (2013).
- [22] L. Miao, H. Xu, and Z. Q. Mao, Phys. Rev. B 89, 035109 (2014).
- [23] A. Biswas, K.-S. Kim, and Y. H. Jeong, J. Appl. Phys. 116, 213704 (2014).
- [24] L. Zhang et al., Phys. Rev. B 91, 035110 (2015).
- [25] Y. F. Nie et al., Phys. Rev. Lett. 114, 016401 (2015).
- [26] Z. T. Liu et al., Sci. Rep. 6, 30309 (2016).
- [27] I. Fina et al., Nature Commun. 5, 4671 (2013).
- [28] J. Matsuno, K. Ihara, S. Yamamura, H. Wadati, K. Ishii, V. V. Shankar, H.-Y. Kee, and H. Takagi, Phys. Rev. Lett. 114, 247209 (2015).
- [29] D. J. Groenendijk, N. Manca, G. Mattoni, L. Kootstra, S. Gariglio, Y. Huang, E. van Heumen, and A. D. Caviglia, Appl. Phys. Lett. 109, 041906 (2016).
- [30] D. Hirai. J. Matsuno, and H. Takagi, APL Mater. 3, 041508 (2015).
- [31] D. Yi et al., PNAS. 113, 6397-6402 (2016).
- [32] J. Nichols et al., Nature Commun. 7, 12721 (2016).
- [33] K. Nishio, H. Y. Hwang, and Y. Hikita, APL Mater. 4, 036102 (2016).
- [34] S. S. A. Seo, J. Nichoos, J. Hwang, J. Terzic, J. H. Gruenewald, M. Souri, J. Thompson, J. G. Connell, and G. Cao, Appl. Phys. Lett. 109, 201901 (2016).
- [35] J. H. Gruenewald et al., Adv. Mater. 29, 1603797 (2017).
- [36] L. Hao et al., Phys. Rev. Lett. 119, 027204 (2017).
- [37] S. Okamoto, J. Nichols, C. Sohn, S. Y. Kim, T. W. Noh, and H. N. Lee, Nano Lett. 17, 2126-2130 (2017).
- [38] J. M. Longo, J. A. Kafalas, and R. J. Arnott, J. Solid State Chem. 3, 174-179 (1971).
- [39] See Supplemental Material.
- [40] A. Ichimiya and P. I. Cohen, Reflection High-Energy Electron Diffraction (Cambridge University Press, Cambridge, 2004).
- [41] E. Mutoro, E. J. Crumlin, M. D. Biegalski, H. M. Christen, and Y. Shao-Horn, Energy Environ. Sci. 4, 3689 (2011).
- [42] C. Xu, H. Du, A. J. H. van der Torren, J. Aarts, C.-L. Jia, and R. Dittmann, Sci. Rep. 6, 38296 (2016).
- [43] W. C. Yang et al., Sci. Rep. 7, 7740 (2017).
- [44] V. Pfeifer et al., Surf. Interface Anal. 48, 261-273 (2016).
- [45] J. M. Kahk et al., Phys. Rev. Lett. 112, 117601 (2014).
- [46] D. J. Payne, R. G. Egdell, W. Hao, J. S. Foord, A. Walsh, and G. W. Watson, Chem. Phys. Lett. 411, 181-185 (2005).
- [47] A. Bourlange et al., J. Appl. Phys. 106, 013703 (2009).
- [48] A. Kotani, J. Electron Spectrosc. Relat. Phenom. 78, 7 (1996).
- [49] C. Shan, D. Tsai, Y. Huang, S. Jian, and C. Cheng, Chem. Mater. 19, 424-431 (2007).
- [50] T. Kwon, H. Hwang, Y. Sa, J. Park, H. Baik, S. Joo, and K. Lee, Adv. Funct. Mater. 27, 1604688 (2017).
- [51] A. Sambri, C. Aruta, E. Di Gennaro, X. Wang, U. Scotti di Uccio, F. Miletto Granozio, and S. Amoruso, J. Appl. Phys. 119, 125301 (2016).
- [52] I. Konomi, T. Motohiro, M. Horii, and M. Kawasumi, J. Vac. Sci. Technol. A 26, 1455 (2008).
- [53] T. C. Droubay, L. Qiao, T. C. Kaspar, M. H. Engelhard, V. Shutthanand, and S. A. Chambers, Appl. Phys. Lett. 97, 124105 (2010).
- [54] S. Canulescu, E. L. Papadopoulou, D. Anglos, Th. Lippert, C. W. Schneider, and A. Wokaun, J. Appl. Phys. 105, 063107 (2009).
- [55] S. Amoruso, C. Aruta, P. Aurino, R. Bruzzese, X. Wang, F. Miletto Granozio, and U. Scotti di Uccio, Appl. Surf. Sci. 258, 9116-9122 (2012).
- [56] A. Sambri, S. Amoruso, X. Wang, F. Miletto Granozio, and R. Bruzzese, J. Appl. Phys. 104, 053304 (2008).
- [57] S. Amoruso, C. Aruta, R. Bruzzese, D. Maccariello, L. Maritato, F. Miletto Granozio, P. Orgiani, U. Scotti di Uccio, and X. Wang, J. Appl. Phys. 108, 043302 (2010).
- [58] S. Wicklein, A. Sambri, S. Amoruso, X. Wang, R. Bruzzese, A. Koehl, and R. Dittmann, Appl. Phys. Lett. 101, 131601 (2012).
- [59] T. Ohnishi, and K. Takada, Appl. Phys. Express 4, 025501 (2011).
- [60] A. Sambri, S. Amoruso, X. Wang, M. Radovic, F. Miletto Granozio, and R. Bruzzese, Appl. Phys. Lett. 91, 151501 (2007).
- [61] K. Shibuya, S. Mi, C.-L. Jia, P. Meuffels, and R. Dittmann, Appl. Phys. Lett. 92, 241918 (2008).
- [62] M. Ge, T. F. Qi, O. B. Korneta, D. E. De Long, P. Schlottmann, W. P. Crummett, and G. Cao, Phys. Rev. B 84, 100402(R) (2011).
- [63] J. P. Clancy, N. Chen, C. Y. Kim, W. F. Chen, K. W. Plumb, B. C. Jeon, T. W. Noh, and Y.-J. Kim, Phys. Rev. B 86, 195131 (2012).
- [64] G. van der Laan, and B. T. Thole, Phys. Rev. Lett. 60, 1977 (1988).
- [65] D. Haskel, G. Fabbris, M. Zhernenkov, P. P. Kong, C. Q. Jin, G. Cao, and M. van Veenendaal, Phys. Rev. Lett. 109, 027204 (2012).
- [66] M. A. Laguna-Marco, D. Haskel, N. Souza-Neto, J. C. Lang, V. V. Krishnamurthy, S. Chikara, G. Cao, and M. van Veenendaal, Phys. Rev. Lett. (105), 216407 (2010).
- [67] T. Mizokawa, L. H. Tjeng, G. A. Kawatzky, G. Ghiringhelli, O. Tjernberg, N. B. Brookes, H. Fukazawa, S. Nakatsuji, and Y. Maeno, Phys. Rev. Lett. 87, 077202 (2001).
- [68] H.-J. Noh et al., Phys. Rev. B 72, 052411 (2005).
- [69] K.-H. Kim, H.-S. Kim, and M. J. Han, J. Phys.: Condens. Matter 26, 185501 (2014).