Evolution of amorphous carbon across densities: an inferential study
Abstract
In this paper, we offer large and realistic models of amorphous carbon spanning densities from 0.95 to 3.5 . The models are designed to agree as closely as possible with experimental diffraction data while simultaneously attaining a local minimum of a density functional Hamiltonian. The structure varies dramatically from interconnected wrapped and defective sheets at 0.95 to a nearly perfect tetrahedral topology at 3.5 . Force Enhanced Atomic Refinement (FEAR) was used and is shown here to be computationally superior and more experimentally realistic than conventional ab initio melt quench methods. We thoroughly characterize our models by computing structural, electronic and vibrational spectra. The vibrational density of states of the 0.95 model is strikingly similar to monolayer amorphous graphene. Our / ratios are close to experimental predictions where available, a consequence of compelling a satisfactory fit for pair correlation function.
I Introduction
Amorphous materials are exploited for myriad applications such as thin-film transistors, solar photovoltaics, coatings and artificial heart-valves.[1, 2, 3] However, a lack of long range order in amorphous solids impose a challenge for a condensed matter theorists. A logical approach for determining structure is to use experiment to infer structure. This is accepted practice for crystals, even those with extremely large unit cells. For amorphous materials, a unique inversion is impossible because of the smooth structure factors and pair-correlation functions. The key shortcoming of such an approach is the unbiased inclusion of chemical information. A long used alternative: the method of “melt quenching” is limited by fast quenching rates and ignores a priori experimental information in the process of model formation.[2] We bridge the divide between these approaches in this paper.
For proper context we note that inverse modeling is experimentally driven where Reverse Monte Carlo (RMC)[4] is used for modeling of different amorphous systems.[5, 6, 7, 8] RMC approach to match experimental information seems logical and gives us computation time benefit. Often these models result in highly-constrained or under-constrained structures, which may turn out be inaccurate or totally unrealistic.[9, 10] To resolve these in-adequacies different experimentally motivated constraints have been proposed such as: multiple scattering data[11, 12, 13], bond-angle constraints [14], coordination constraints[6] and so on, which can be quite effective.[9] The real concern about constraints is that they introduce bias into the modeling scheme. Alternatively, energy functional based constraints involve minimization of total energy and total forces. Numerous approaches[15, 16, 17, 18, 19] depending upon stage for implementing minimization been explored using empirical/DFT interactions along with several other methods. [20, 21, 22, 23, 24, 25, 26]
We have implemented Force Enhanced Atomic Refinement (FEAR)[17, 18, 19] method in amorphous carbon (a-Carbon). FEAR has advantages over other contemporary inversion methods. It’s ability to predict accurate structure with correct chemical composition, starting from a random structure without any constraints has been a feature of this approach. We have used FEAR with state of the art ab initio interactions for our calculations. FEAR has been tested in several materials, it is a robust and efficient method to model different amorphous systems.[17, 18]
In this paper, we present a series of models of a-Carbon at various densities using the same approach for all. We systematically report the dependence of observables on the density. The paper is organized as follows, In section 2 we discuss the computational methodology. In section 3, we report our models and the methods of preparation. Section 4, mainly focuses on the structural properties of the models and comparisons to experiments. Section 5 is devoted to the electronic properties of the system. Section 6 we describe the vibrational properties of these carbons. In section 7, we summarize our findings and discuss the effectiveness of our approach by comparing it to the other known results.
II Methodology
We have prepared four models of a-Carbon with 648 atoms at densities (3.50 , 2.99 , 2.44 and 0.951 ) using FEAR. In FEAR, we begin with randomly chosen coordinates which are subjected to partial structural refinement with “M” accepted RMC steps and partial relaxations with conjugate gradient (CG) method for “N” relaxation steps. This cycle is repeated until the model is fully converged (fitting the data and a minimum of the DFT interactions).[17, 18] To our knowledge, these are the largest ab initio models offered to date for a-Carbon.
The relaxation step was performed with single- basis, periodic boundary conditions and Harris functional at constant volume using SIESTA11 1 DFT code using LDA with Ceperley Alder exchange correlation[62]. As an additional check of our models, we have relaxed the converged models using the ab initio package VASP[28] with plane wave basis[28], , plane-wave cutoff of 400 eV and an energy convergence tolerance of eV. To compare and contrast, we have also prepared ab initio based MQ models. We have prepared three models (160 atom) each using SIESTA (LDA, Harris functional) and VASP (LDA, self-consistency).[29, 30]
III Models


The starting random configuration is fitted to appropriate experimental data with RMCProfile22 2 RMC based applications for the structural refinement[63]. After every 100 accepted RMC moves[17, 18, 19], the total energy and forces were evaluated (using a single force call) and the atoms were moved along the gradient to reduce the total energy. We have chosen a maximum RMC step size of 0.25-0.375, a minimum approach of 1.05-1.20 , with a fixed spacing of 0.02 and weight of the experimental data. Meanwhile, relaxation (CG) is carried out in SIESTA using a force tolerance of 0.01 eV/ and maximum CG displacement of 0.70 .
In the meantime, we implemented MQ calculations with random coordinates, which were equilibrated at 7000 K, then cooled to 300 K, further equilibrated at 300 K and finally relaxed using CG method. This process employed a time step of 1.0 fs for a total time of 26 ps. We have also prepared a self-consistent MQ model using VASP. These models were started from random, then heated to 8000 K, equilibrated at 8000 K, cooled to 300 K and finally relaxed with CG method. A time step of 1.5 fs was used for total time of 24 ps.
These models will hereafter be identified as (F648, S160 and V160). The assigned nomenclature indicates: method of preparation (FEAR-SIESTA-VASP) and number of atoms in the cell of each model. We have used our previous VASP prepared model (V72 at 0.92 )[32] to compare the result of our lowest density model. Our models are summarized in Table. 1.
| Models | = 3.50 | = 2.99 | = 2.44 | = 0.95 | |||||||
|---|---|---|---|---|---|---|---|---|---|---|---|
| F648 | V160 | S160 | F648 | V160 | S160 | F648 | V160 | S160 | F648 | V72aafootnotemark: a | |
| n | 3.96 | 3.98 | 3.94 | 3.83 | 3.75 | 3.85 | 3.41 | 3.26 | 3.58 | 3.00 | 2.67 |
| of | 96.00 | 97.50 | 93.75 | 82.70 | 75.00 | 85.00 | 42.00 | 26.87 | 58.13 | 10.80 | — |
| of | 4.00 | 2.50 | 6.25 | 17.30 | 25.00 | 15.00 | 57.40 | 72.50 | 41.25 | 79.00 | 66.67 |
| of | — | — | — | — | — | — | 0.60 | 0.63 | 0.62 | 9.60 | 33.33 |
| bbfootnotemark: b | 28.12 | 100 | — | 30.73 | 100 | — | 23.58 | 100 | — | — | — |
- a
a at density .[32]
- b
b CPU time for fixed number of total cores.


IV Structural Properties
Structurally, amorphous carbon at density is diamond-like () bonded whereas near graphitic density it is mostly bonded and further at low densities ( ) we observe a few conformation with mostly bonded carbon structures.[38] This change in bonding preferences with density is shown in Fig. 1. We have assigned different color codes (via. Jmol 33 3 Jmol, an open-source Java viewer for chemical structures in 3D) for varying bonding and it reveals at high densities mainly inter-connects networks while at low densities it is exactly vice-versa. Our ratios are close to experimental findings.[40, 41] In Fig. 2, we show a comparison of experimental static structure factor (S(Q)) and radial distribution function (RDF, g(r)) with our FEAR models.
At density , we have used a Wooten-Wearie-Winer (WWW)[34] model as our input experimental diffraction data as no data is available for this density. The WWW model is obtained with bond-switching-algorithm[42] with perfect (100 ) bonding and has been an ideal model for tetrahedral amorphous systems[43]. We have close agreement for both S(Q) and g(r) with the WWW model, further we reproduce 96 of the content in our model (Table 1). In contrast, earlier finding[44] report a lower concentration of at this density.
We have used experimental diffraction data as our RMC input for next three calculations. At a density , we employed the neutron diffraction data of Gilkes et al.[35] which is estimated to have 84 bonding and a coordination-number (n) of 3.84. Our obtained S(Q) and g(r) are in an excellent agreement with experiment and we reproduce 82.70 bonding with a coordination(n) of 3.83. Similarly, at density , we have used experimental diffraction data of Li and Lannin[36] as our RMC input. We again obtain good agreement with the experimental diffraction data (S(Q) and g(r)) while some deviations are seen in MQ models. These results for densities ( and ) are in better agreement with the experiment compared to some earlier work.[38, 44, 33]
Finally, at density , we employed neutron diffraction data obtained for silicon carbide-derived nanoporous carbon(SIC-CDC)[37] as FEAR input. Amorphous carbon at this density is also known as glassy carbon, a bit of a misnomer as the materials are not conventional glasses. The uncertainty of density, structure and significant H-content makes it difficult to study glassy carbons.[6, 45, 46, 47, 10] Most calculations include strong assumptions, such as choosing a perfect graphitic or graphene sheets, co-ordination restrictions, bond-angle restrictions and so on.[6, 45, 48, 47] Some of these constrained models were found to be unstable and were subjected to change upon relaxation.[10] Additionally, accurate “ab initio”(complete basis DFT) based calculations of these glassy carbons have been limited to a few hundred atoms until this work. To check this significant inferences we repeated the calculation with a different random starting point and received a statistically equivalent model.
Our F648 model depicts the best extant picture of glassy carbon starting from random and without any bias. We have a credible agreement with the experiment as we have successfully reproduced major RDF peaks for glassy carbon occurring at, 1.42 , 2.46 , 2.84 and so on.[49] There is a slight deviations in the low Q range which was also observed in previous work[6, 37] done with ( atoms), concluding that it’s not a finite size limitation.
IV.1 Bond Angle Distribution and Ring statistics
Bond angle distribution (BAD) and ring statistics provide vital information about microstructure. In a typical RMC simulation with a perfect fit to experiment, a peak near is observed in BAD[17]. This is one of the major drawbacks of using RMC which FEAR avoids. Although, constraints have been suggested[33] to avoid these unrealistic cases, FEAR achieves it without external bias. We have reported our result for BAD and ring statistics in Fig. 3.
At the high density the BAD peak is close to the tetrahedral angle of , with small deviation. At low densities the BAD peak is closer to , indicating trigonal symmetry is dominant in these structures. It is reported that even with high content BAD peak at low density is close to .[50]
We have shown in Fig. 3 that amorphous carbons mostly prefer 5-7 membered ring structures. This is also true for the high concentration structures which further clarifies that these a-C structures are different from graphite (only 6 membered rings). A negligible fraction of smaller ring structures were also observed but these are less than MD and other calculations.[33] The ring statistics were evaluated with King’s shortest path method[51] using ISAACS software.[52]
IV.2 Convergence and stability of FEAR carbon
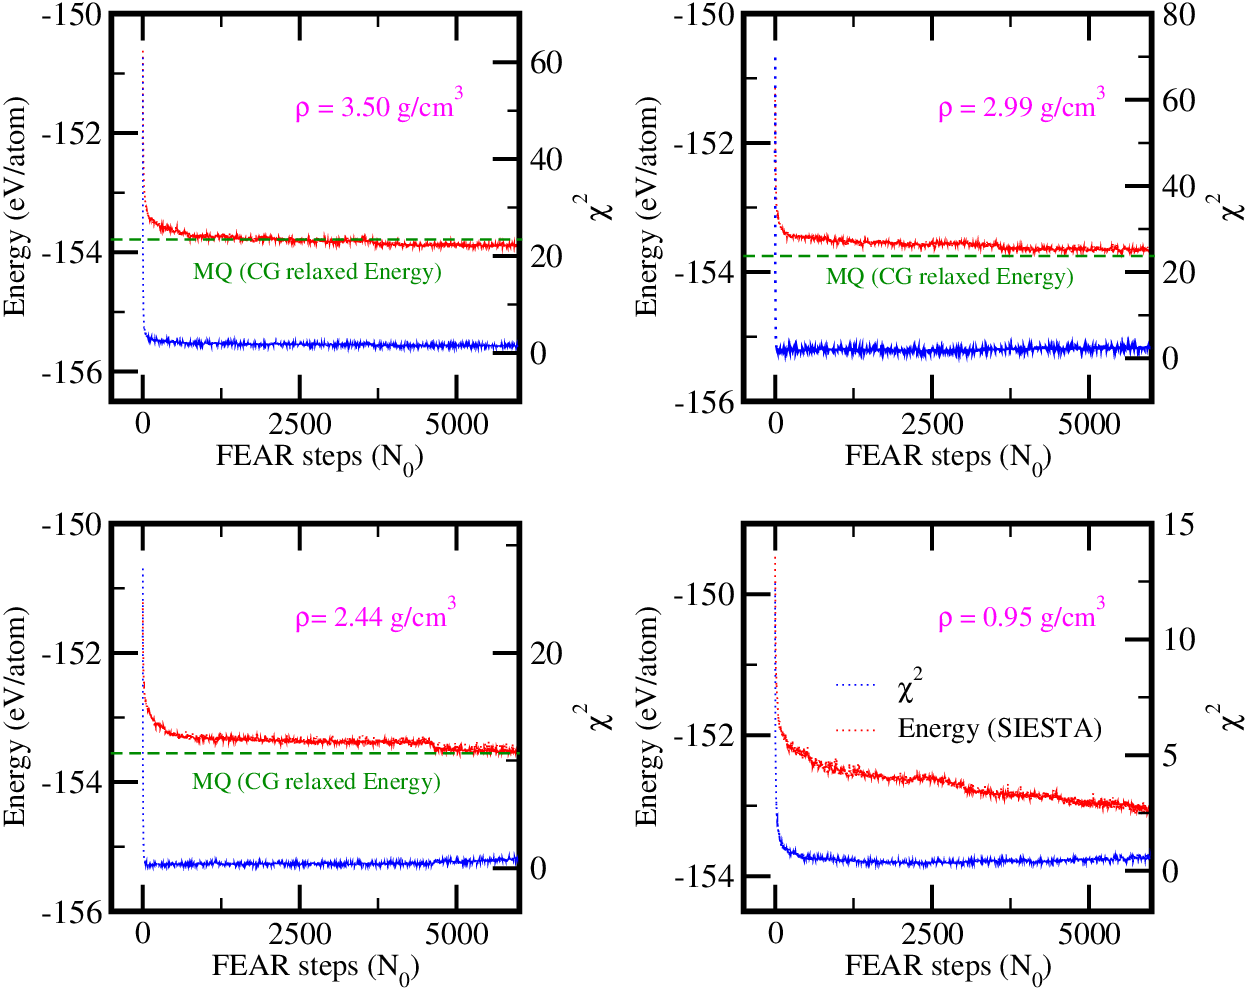
In FEAR, we obtain low values of in conjunction with a local energy minimum44 4 measures goodness of fit between experimental and FEAR model[17, 18, 19]. Our plot of variation of total energy (E) and is shown in Fig. 3. The results obtained shows that a initial structure in formed within few hundred FEAR steps where the system has attained the energy landscape for a-Carbon with some defects. These states have more or less the same average energy and as we move along with FEAR steps these defects are removed, thus leading to a chemically realistic structure.
V Electronic Density of States
The concentration of , and states strongly influence the nature of the electronic density of states (EDOS). As in the case of diamond, a-Carbon with high is non-conducting. We have presented plots of the EDOS of our F648 models in Fig. 4, where we have also decomposed the total EDOS by , and contributions. We can clearly see that that the states for density act as a defect and leads to formation of a pseudo-gap.[54] Subsequently, a-Carbon models at lower density are conducting as expected.[55, 38] In Fig. 4 (Right panel) we show the plot of Inverse Participation Ratio (IPR)[56], IPR gives information about the spatial localization of electronic states. As seen in Fig. 4, the gap states for high density are highly localized while the lower two density have much more extended states. This supports our observation that low density a-Carbon are conducting.

VI Vibrational Properties
The vibrational density of states (VDOS) provides crucial information about changes in local bonding environment which is very effective test for theoretical models[57] and offers a remarkably direct comparison between experiment and theory. It is well know that a-Carbon exhibits two major peaks in VDOS and Raman spectra show these occurring at: and .[36] In contrast, several theoretical models show a single broad peak occurring roughly at .[54, 58]
We have calculated the vibrational density of states (VDOS) of our four F648 models. The dynamical matrix was obtained by displacing each atom in 6-directions (,,) by a small displacement of 0.015 (see details[59]). We have used Harris functional to our advantage for accelerating these computationally intensive calculations. Our VDOS plot for the four models are shown in Fig.5.

Our results show reasonable agreement with the literature. There is distinct bifurcation seen in our F648 models as seen in several experiments. At , we compare our result with VDOS obtained for 216-WWW model.[34] We observed a slight shift for as compared to model at . At , we have compared our results ( fraction ) with experimental data[57] obtained for amorphous carbon containing fraction at , we have a qualitative match with the experimental finding. The position of two peaks and their relative intensity is reported to slightly differ for different incident energies and fraction.[57, 61]
At low density , our model resembles distorted graphene structures (see Fig.1). We have compared our results with 2D a-graphene result of Li and Drabold[60]. The plots bear a remarkable similarity, most notably the peak occurring at and . This is surprising in view of the two models have different topology (one is 3-D, the other one 2-D). We have also computed the inverse participation ratio (IPR) for our F648 models. IPR, gives localization of these vibrational modes.[59, 32] Our obtained result for IPR shows that vibrational modes are extended at the low frequency regime and localized modes are only observed a higher frequency than , which are likely to be localized stretching modes.[58, 32]
VII Conclusions
We have used a uniform approach to model a-Carbon using FEAR at various densities. We have used method FEAR efficiency to obtain large size (648 atom) “ab initio” based models. FEAR allows system to evolve on it’s own to find the appropriate energy minimum based on the force direction evaluated at each relaxation step. This inclusion of ab initio interactions not only guides us towards a chemically correct structures, it directly helps us to avoid high energy small ring structures. A typical RMC based calculation fails to accurately model amorphous systems without the addition of experimental based constraints. FEAR models yield a lower DFT energy minimum and take less time to converge as compared to the regular models obtained via. method of “melt and quench” with same interactions.
We have established a set of accurate ab initio models for amorphous carbon that we hope will serve as a benchmark for future modeling studies.
VIII Acknowledgment
The authors are thankful to the NSF under grant number DMR 1506836. We thank Dr. Ronald L. Cappelletti for helpful conversations. We acknowledge the financial support from Condensed Matter and Surface Science (CMSS) at Ohio University. We also acknowledge computing time provided by the Ohio Supercomputer Center.
Data availability
The coordinates of the four relaxed FEAR (648 atoms) models and of melt quench models prepared during this study are available from corresponding authors upon request.
References
- [1] D. R. Mckenzie, Rep. Prog. Phys. 59, 1611 (1995).
- [2] D. A. Drabold, Eur.Phys.J. B 68, 1 (2009).
- [3] J. Robertson, Mater. Sci. Eng. R37, 129 (2002).
- [4] R. L. McGreevy and L. Pusztai, Mol. Simul. 1, 359 (1988).
- [5] P. Biswas, R. Atta-Fynn, and D. A. Drabold, Phys.Rev.B 69, 195207 (2004).
- [6] B. O’Malley, I. Snook, and D. McCulloch, Phys.Rev.B 57, 14148 (1998).
- [7] D. A. Keen and M. T. Dove, J. Phys.: Condens. Matter 11, 9263 (1999).
- [8] V. Gereben and L. Pusztai, Phys.Rev.B 50, 14136 (1994).
- [9] G. Opletal, T. C. Petersen, A. S. Barnard, and S. P. Russo, J. Comput. Chem. 38, 1547 (2017).
- [10] S. K. Jain, R. J. M. Pellenq, J. P. Pikunic, and K. E. Gubbins, Langmuir 22, 9942 (2006).
- [11] J. K. Walters, K. W. R. Gilkes, J. D. Wicks, and R. J. Newport, J. Phys.: Condens. Matter 9, 457 (1997).
- [12] S. Hosokawa, W. C. Pilgrim, J. F. Berar, and S. Kohara, Eur. Phys. J. Spec. Top. 208, 291 (2012).
- [13] S. J. Gurman and R. L. McGreevy, J. Phys.: Condens. Matter 2, 9463 (1990).
- [14] M. G. Tucker, D. A. Keen, M. T. Dove, and K. Trachenko, J. Phys.: Condens. Matter 17, 67 (2005).
- [15] P. Biswas, D. N. Tafen, and D. A. Drabold, Phys.Rev.B 71, 054204 (2005).
- [16] G. Opletal, T. Petersen, B. Omalley, I. Snook, D. G. Mcculloch, N. A. Marks, and I. Yarovsky, Mol. Sim. 28, 927 (2002).
- [17] A. Pandey, P. Biswas, and D. A. Drabold, Scientific Reports 6, 33731 (2016a).
- [18] A. Pandey, P. Biswas, and D. A. Drabold, Phys.Rev.B 92, 155205 (2015).
- [19] A. Pandey, P. Biswas, B. Bhattarai, and D. A. Drabold, Phys.Rev.B 94, 235208 (2016b).
- [20] K. Prasai, P. Biswas, and D. A. Drabold, Phys. Status Solidi A 213, 1653 (2016).
- [21] M. J. Cliffe, A. P. Bartok, R. N. Kerber, C. P. Grey, G. Csanyi, and A. L. Goodwin, Phys.Rev.B 95, 224108 (2017).
- [22] M. J. Cliffe, M. T. Dove, D. A. Drabold, and A. L. Goodwin, Phys.Rev.Lett 104, 125501 (2010).
- [23] J. Tersoff, Phys. Rev. Lett. 61, 2879 (1988).
- [24] N. A. Marks, Phys.Rev.B 63, 035401 (2000).
- [25] C. Mathioudakis, G. Kopidakis, P. C. Kelires, C. Z. Wang, and K. M. Ho, Phys.Rev.B 70, 125202 (2004).
- [26] L. Li, M. Xu, W. Song, A. Ovcharenko, G. Zhang, and D. Jia, App. Surf. Sci. 286, 287 (2013).
- [27] DFT code using LDA with Ceperley Alder exchange correlation[62].
- [28] G. Kresse and J. Furthmuller, Phys.Rev.B 54, 11169 (1996).
- [29] G. Kresse and D. Joubert, Phys.Rev.B 59, 1758 (1999).
- [30] P. E. Blochl, Phys.Rev.B 50, 17953 (1994).
- [31] RMC based applications for the structural refinement[63].
- [32] B. Bhattarai and D. A. Drabold, Carbon 115, 532 (2017).
- [33] G. Opletal, T. C. Petersen, D. G. McCulloch, I. K. Snook, and I. Yarovsky, J. Phys: Condens. Matter 17, 2605 (2005).
- [34] B. Djordjevic, M. Thorpe, and F. Wooten, Phys.Rev.B 52, 5685 (1995).
- [35] K. W. R. Gilkes, P. H. Gaskell, and J. Robertson, Phys.Rev.B 51, 12303 (1995).
- [36] F. Li and J. Lannin, Phys.Rev.Lett 65, 1905 (1990).
- [37] A. H. Farmahini, G. Opletal, and S. K. Bhatia, J. Phys. Chem. C 117, 14081−14094 (2013).
- [38] D. G. McCulloch, D. McKenzie, and C. Goringe, Phys.Rev.B 61, 2349 (2000).
- [39] Jmol, an open-source Java viewer for chemical structures in 3D.
- [40] A. C. Ferrari, A. Libassi, B. K. Tanner, V. Stolojan, J. Yuan, L. M. Brown, S. E. Rodil, B. Kleinsorge, and J. Robertson, Phys.Rev.B 62, 11089 (2000).
- [41] P. J. Fallon, V. S. Veerasamy, C. A. Davis, J. Robertson, G. A. J. Amaratunga, W. I. Milne, and J. Koskinen, Phys.Rev.B 48, 4777 (1993).
- [42] F. Wooten, K. Winer, and D. Weaire, Phys.Rev.Lett. 54, 1392 (1985).
- [43] D. N. Tafen and D. A. Drabold, Phys.Rev.B 68, 165208 (2003).
- [44] C. Wang and K. Ho, Phys.Rev.B 50, 12429 (1994).
- [45] T.Petersen, I. Yarovsky, I. Snook, D. G. McCulloch, and G. Opletal, Carbon 41, 2403 (2003).
- [46] D. Mildner and J. Carpenter, Journal of Non-Crystalline Solids 47, 391 (1982).
- [47] P. Zetterstrom, S. Urbonaite, F. Lindberg, R. G. Delaplane, J. Leis, and G. Svensson, J. Phys.: Condens. Matter 17, 3509 (2005).
- [48] J. Pikunic, C. Clinard, N. Cohaut, K. E. Gubbins, J.-M. Guet, R.-M. Pellenq, I. Rannou, and J.-N. Rouzaud, Langmuir 19, 8565 (2003).
- [49] S. F. Parker, S. Imberti, S. Callear, and P. Albers, Chemical Physics 427, 44 (2013).
- [50] D. Beeman, J. Silverman, R. Lynds, and M. R. Anderson, Phys.Rev.B 30, 870 (1984).
- [51] S. King, Nature 213, 1112 (1967).
- [52] S. Roux and V. Petkov, J. Appl. Cryst. 43, 181 (2010).
- [53] measures goodness of fit between experimental and FEAR model[17, 18, 19].
- [54] D. A. Drabold, P. A. Fedders, and P. Stumm, Phys.Rev.B 49, 16415 (1994).
- [55] J. Robertson and E. O’Reilly, Phys.Rev.B 35, 2946 (1987).
- [56] C. Chen and J. Robertson, Journal of Non-Crystalline Solids 227-230, 602 (1998).
- [57] G. P. Lopinski, V. I. Merkulov, and J. S. Lanin, Appl. Phys. Lett. 69, 3348 (1996).
- [58] C. Wang and K. Ho, Phys.Rev.Lett 71, 1184 (1993).
- [59] B. Bhattarai and D. A. Drabold, Journal of Non-Crystalline Solids 439, 6 (2016).
- [60] Y. Li and D. A. Drabold, Phys. Status Solidi B 250, 1012 (2013).
- [61] P. Papanek, W. A. Kamitakahara, P. Zhou, and J. E. Fischer, J. Phys.: Condens. Matter 13, 8287 (2001).
- [62] J. M. Soler, E. Artacho, J. D. Gale, A. García, J. Junquera, P. Ordejon, and D. Sanchez-Portal, Journal of Physics: Condensed Matter 14, 2745 (2002).
- [63] M. G. Tucker, D. A. Keen, M. T. Dove, A. L. Goodwin, and Q. Hui, J. Phys.: Condens. Matter 19, 335218 (2007).